Recognition: no theorem link
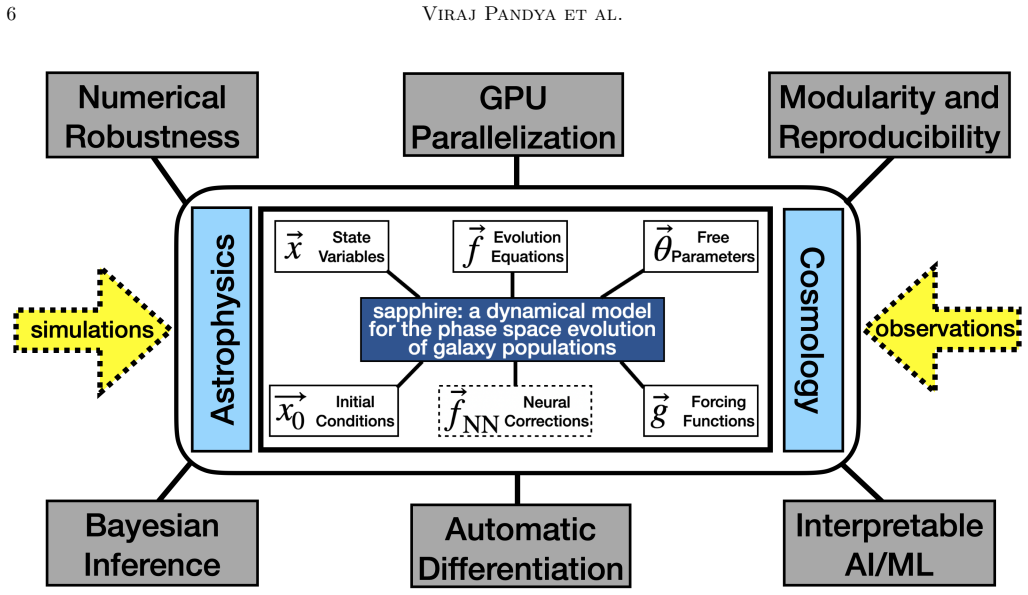
Introducing sapphire: Towards Hybrid Physics-Informed, Data-Driven Modeling of Galaxy Formation
Pith reviewed 2026-05-10 19:31 UTC · model grok-4.3
The pith
A new automatically differentiable semi-analytic model computes exact Jacobians of galaxy evolution equations and infers that preventative feedback primarily regulates star formation.
A machine-rendered reading of the paper's core claim, the machinery that carries it, and where it could break.
Core claim
The central discovery is that exact Jacobian matrices of the nonlinear differential equations in the galaxy formation model exhibit interpretable, non-random structures, and that comprehensive parameter inference from observational data indicates galaxies primarily self-regulate their star formation through preventative feedback rather than ejective feedback.
What carries the argument
The automatically differentiable semi-analytic model framework that enables exact computation of Jacobian matrices for sensitivity analysis and parameter inference via gradient descent and Hamiltonian Monte Carlo.
If this is right
- The stellar-to-halo-mass relation at z=0 alone does not contain enough information to constrain many astrophysical parameters.
- Supernova energy loading emerges as a key astrophysical parameter controlling galaxy evolution.
- Gradient descent and Hamiltonian Monte Carlo methods enable comprehensive mock parameter recovery and real data inference.
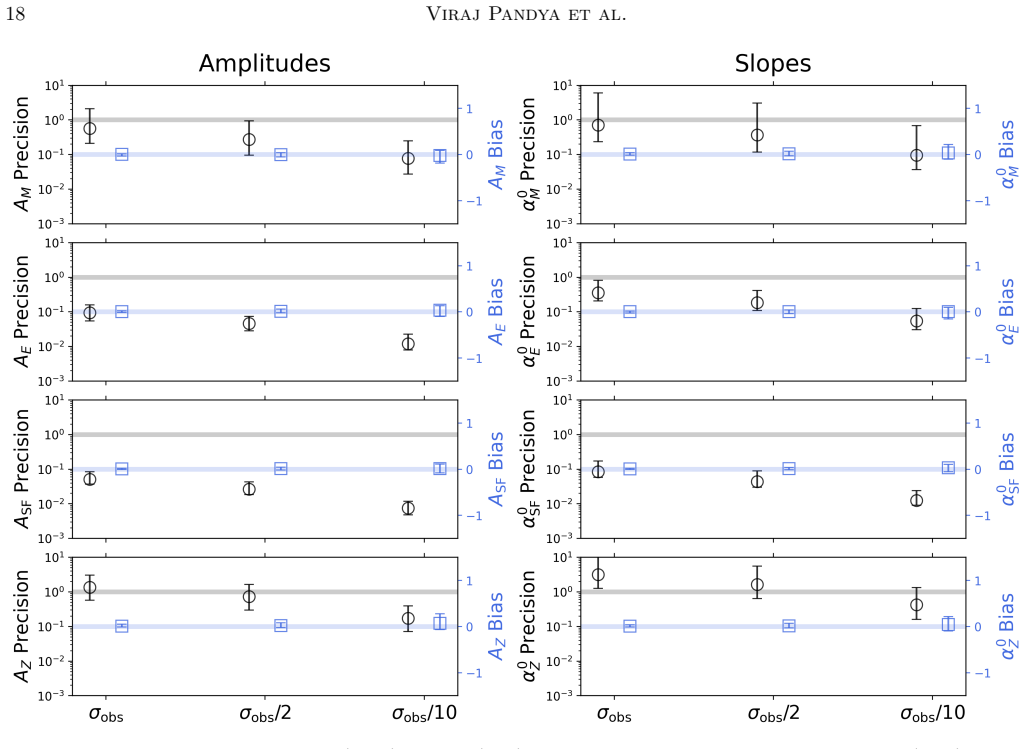
- Fisher and HMC forecasts indicate the framework can support precision inference of galaxy formation parameters with suitable data.
Where Pith is reading between the lines
- The modular structure could support swapping in different physical prescriptions to test their impact on inferred feedback modes.
- The exact Jacobians open a route to hybrid models that blend the differential equations with machine-learned corrections for missing processes.
- Similar Jacobian-based sensitivity analysis could be applied to other sets of nonlinear equations describing cosmic structure formation.
Load-bearing premise
The chosen combination of observational data on stellar masses, gas fractions, and metallicities together with the specific physical model is sufficient to distinguish between preventative and ejective feedback without major systematic biases.
What would settle it
An expanded dataset that includes star formation rates at higher redshifts and strongly favors ejective feedback parameters over preventative ones would contradict the inference.
Figures


read the original abstract
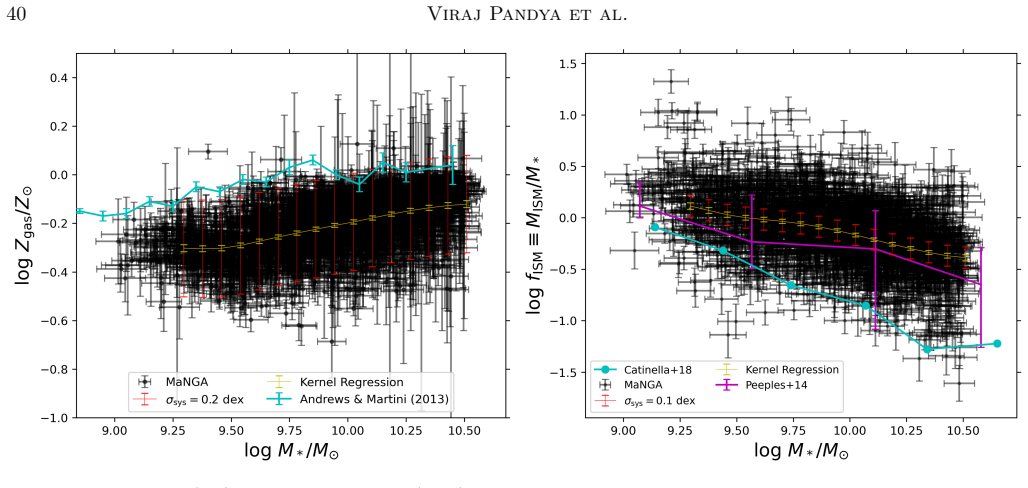
Semi-analytic models (SAMs) have been treating galaxy populations as dynamical systems for $\gtrsim50$ years, but their evolution equations remain poorly constrained. We introduce sapphire, a modular, automatically differentiable, GPU-accelerated SAM written from scratch in JAX. For the first time, we compute exact Jacobian matrices of our nonlinear differential equations and show that they have interpretable, non-random structures, using the Pandya et al. (2023) physical model as an initial example. Both local and global sensitivity analyses reveal that supernova energy loading is a key astrophysical parameter for galaxy evolution. We use gradient descent and Hamiltonian Monte Carlo (HMC) to perform comprehensive mock parameter recovery tests. These indicate that the z=0 stellar-to-halo-mass relation alone does not contain enough information to infer many astrophysical parameters. Using observations of star-forming galaxies from the MaNGA survey and the Behroozi et al. (2019) empirical model as one baseline, we derive multiple posteriors assuming different combinations of data, including z=0 interstellar medium gas fractions and metallicities. The inferred physical parameters suggest that galaxies self-regulate their star formation primarily through preventative rather than ejective feedback. Both Fisher and HMC forecasts demonstrate the potential of sapphire to enable precision inference for galaxy formation, but more work is needed to expand its library of models. We discuss how our unique blend of differentiability, massive GPU parallelization, numerical robustness and principled Bayesian methods sets the stage for hybrid physics-informed, data-driven discovery of galaxy formation astrophysics and cosmology. We make sapphire publicly available at https://github.com/virajpandya/sapphire.
Editorial analysis
A structured set of objections, weighed in public.
Referee Report
Summary. The manuscript introduces sapphire, a modular, automatically differentiable, GPU-accelerated semi-analytic model (SAM) for galaxy formation written in JAX. Using the Pandya et al. (2023) physical model as an initial example, it computes exact Jacobian matrices of the nonlinear differential equations and demonstrates that they exhibit interpretable, non-random structures. Local and global sensitivity analyses identify supernova energy loading as a key astrophysical parameter. Mock parameter recovery tests via gradient descent and Hamiltonian Monte Carlo (HMC) show that the z=0 stellar-to-halo-mass relation alone is insufficient to constrain many parameters. Incorporating MaNGA survey data on gas fractions and metallicities together with the Behroozi et al. (2019) empirical baseline, the paper derives posteriors under different data combinations and concludes that galaxies self-regulate star formation primarily through preventative rather than ejective feedback. Fisher and HMC forecasts are presented, and the code is released publicly.
Significance. If the central inference holds, this work provides a valuable new framework for hybrid physics-informed and data-driven galaxy formation modeling, leveraging differentiability for efficient sensitivity analysis and Bayesian inference. Explicit strengths include the public code release at https://github.com/virajpandya/sapphire, the computation of exact Jacobians, GPU parallelization, and the use of HMC for parameter recovery. These elements position the approach to enable more precise constraints on astrophysical parameters and could influence future SAM development.
major comments (3)
- [§5] §5 (Bayesian inference results): The conclusion that galaxies self-regulate primarily via preventative feedback is drawn from posteriors obtained with the z=0 SHMR plus MaNGA gas fractions and metallicities. However, no explicit test is provided showing that these observables break degeneracies between preventative (e.g., accretion suppression) and ejective (e.g., outflow loading) channels within the Pandya et al. (2023) parameterization, nor are alternative models or missing physics (such as AGN) explored to confirm the distinction is not an artifact of the chosen setup.
- [§4.2] §4.2 (Sensitivity analysis): Supernova energy loading is identified as the most sensitive parameter, yet this is conventionally associated with ejective feedback; the manuscript does not supply a direct parameter-to-channel mapping or degeneracy analysis to reconcile this with the preventative-feedback dominance claim, which is load-bearing for the self-regulation interpretation.
- [§3] §3 (Jacobian computation): Exact Jacobian matrices are computed and stated to have interpretable non-random structures, but the text does not demonstrate quantitatively how these structures resolve the mapping from parameters to distinct feedback modes, leaving the link to the main physical conclusion unestablished.
minor comments (3)
- The abstract and methods sections provide limited detail on data selection criteria, error treatment, and covariance assumptions for the MaNGA gas fractions and metallicities; expanding this would improve reproducibility.
- Figure captions for the Jacobian visualizations could include annotations or color scales that explicitly highlight the claimed interpretable structures.
- A summary table listing the median and 68% credible intervals for all inferred parameters across the different data combinations would aid comparison.
Simulated Author's Rebuttal
We are grateful to the referee for their insightful comments, which have helped us identify areas where the manuscript can be clarified and strengthened. Below, we provide a point-by-point response to the major comments.
read point-by-point responses
-
Referee: [§5] §5 (Bayesian inference results): The conclusion that galaxies self-regulate primarily via preventative feedback is drawn from posteriors obtained with the z=0 SHMR plus MaNGA gas fractions and metallicities. However, no explicit test is provided showing that these observables break degeneracies between preventative (e.g., accretion suppression) and ejective (e.g., outflow loading) channels within the Pandya et al. (2023) parameterization, nor are alternative models or missing physics (such as AGN) explored to confirm the distinction is not an artifact of the chosen setup.
Authors: We thank the referee for highlighting this important point. Our manuscript demonstrates that the inclusion of MaNGA gas fractions and metallicities, in addition to the z=0 SHMR, leads to posterior distributions that favor parameters associated with preventative feedback over ejective channels in the Pandya et al. (2023) model. However, we agree that we have not provided an explicit test isolating the degeneracy-breaking power of these observables or explored alternative parameterizations including AGN feedback. We will revise the discussion in §5 to include a more nuanced interpretation of the results, explicitly noting the limitations of the current model setup and the need for future work to test robustness against missing physics. revision: partial
-
Referee: [§4.2] §4.2 (Sensitivity analysis): Supernova energy loading is identified as the most sensitive parameter, yet this is conventionally associated with ejective feedback; the manuscript does not supply a direct parameter-to-channel mapping or degeneracy analysis to reconcile this with the preventative-feedback dominance claim, which is load-bearing for the self-regulation interpretation.
Authors: The local sensitivity analysis indeed flags supernova energy loading as a key parameter, consistent with its role in driving outflows. To address the apparent tension with the preventative feedback conclusion, we will add a clear mapping of model parameters to physical channels (preventative vs. ejective) in §4.2. Additionally, we will incorporate a short degeneracy analysis showing how the Bayesian posteriors from combined datasets prioritize preventative parameters despite the sensitivity of ejective ones. This will help reconcile the two analyses. revision: yes
-
Referee: [§3] §3 (Jacobian computation): Exact Jacobian matrices are computed and stated to have interpretable non-random structures, but the text does not demonstrate quantitatively how these structures resolve the mapping from parameters to distinct feedback modes, leaving the link to the main physical conclusion unestablished.
Authors: We accept that the quantitative link between Jacobian structures and feedback mode mappings is not explicitly demonstrated in the text. While the Jacobians enable our sensitivity and inference methods, we will enhance §3 with quantitative examples, such as identifying specific Jacobian elements or patterns that correspond to high-sensitivity parameters like supernova loading and preventative accretion terms. This will better connect the Jacobian computation to the physical insights. revision: yes
Circularity Check
No significant circularity in derivation chain
full rationale
The paper's core contributions—exact Jacobian computation for the nonlinear DEs, sensitivity analyses, mock recovery tests, and Bayesian posteriors from MaNGA + SHMR data—are direct numerical operations and standard inference procedures applied to the Pandya et al. (2023) equations as an explicit initial example. No step reduces by construction to its inputs: the Jacobian structures are computed outputs, not presupposed; the preventative-feedback inference is a fitted result from the chosen observables rather than a renaming or self-definition; self-citations supply the model equations and baseline but are not load-bearing for the new differentiability claims or conclusions, which the paper itself qualifies by calling for expanded model libraries. The chain is self-contained against external benchmarks.
Axiom & Free-Parameter Ledger
free parameters (2)
- supernova energy loading
- multiple astrophysical parameters
axioms (2)
- domain assumption The Pandya et al. (2023) physical model provides an adequate description of the relevant galaxy evolution processes.
- domain assumption Combinations of z=0 stellar-to-halo-mass relation, gas fractions, and metallicities are sufficient to constrain feedback mechanisms.
Forward citations
Cited by 1 Pith paper
-
Informative Priors on Primordial Non-Gaussianity Bias $b_{\phi}$ From Galaxy Formation
Conditioning CAMELS-SAM simulations on the stellar mass function or stellar-to-halo mass relation reduces uncertainty in b_phi by 88-97% for DESI emission line galaxy samples while remaining consistent across galaxy f...
Reference graph
Works this paper leans on
-
[1]
DiffstarPop: A generative physical model of galaxy star formation history
Alarcon, A., Hearin, A. P., Becker, M. R., et al. 2025, arXiv e-prints, arXiv:2510.27604, doi: 10.48550/arXiv.2510.27604 Alsing, J., Thorp, S., Deger, S., et al. 2024, ApJS, 274, 12, doi: 10.3847/1538-4365/ad5c69 Andrews, B. H., & Martini, P. 2013, ApJ, 765, 140, doi: 10.1088/0004-637X/765/2/140 Angl´ es-Alc´ azar, D., Faucher-Gigu` ere, C.-A., Kereˇ s, D...
work page internal anchor Pith review Pith/arXiv arXiv doi:10.48550/arxiv.2510.27604 2025
-
[2]
http://jmlr.org/papers/v18/17-468.html Behroozi, P., Wechsler, R. H., Hearin, A. P., & Conroy, C. 2019, MNRAS, 488, 3143, doi: 10.1093/mnras/stz1182 Behroozi, P. S., Wechsler, R. H., & Conroy, C. 2013a, ApJ, 770, 57, doi: 10.1088/0004-637X/770/1/57 Behroozi, P. S., Wechsler, R. H., & Wu, H.-Y. 2013b, ApJ, 762, 109, doi: 10.1088/0004-637X/762/2/109 Behrooz...
-
[3]
F., Croton, D., Bundy, K., et al
http://jmlr.org/papers/v15/hoffman14a.html Hopkins, P. F., Croton, D., Bundy, K., et al. 2010, ApJ, 724, 915, doi: 10.1088/0004-637X/724/2/915 Hopkins, P. F., Wetzel, A., Kereˇ s, D., et al. 2018, MNRAS, 480, 800, doi: 10.1093/mnras/sty1690 Horowitz, B., Hahn, C., Lanusse, F., Modi, C., & Ferraro, S. 2024, MNRAS, 529, 2473, doi: 10.1093/mnras/stae350 Horo...
-
[4]
http://www.jstor.org/stable/1268522 McQuinn, K. B. W., van Zee, L., & Skillman, E. D. 2019, ApJ, 886, 74, doi: 10.3847/1538-4357/ab4c37 Mitchell, P. D., & Schaye, J. 2022, MNRAS, 511, 2948, doi: 10.1093/mnras/stab3339 Mitchell, P. D., Schaye, J., Bower, R. G., & Crain, R. A. 2020, MNRAS, 494, 3971, doi: 10.1093/mnras/staa938 Mitra, S., Dav´ e, R., & Finla...
-
[5]
Here we combine the Primary, Secondary and Color-Enhanced Samples
using simple cuts on redshift,i-band luminosity and color designed to mitigate selection biases. Here we combine the Primary, Secondary and Color-Enhanced Samples. The Primary Sample selects galaxies atz∼0.03 for IFU coverage out to 1.5 times the half-light radius. The Secondary Sample includes more distant galaxies atz∼0.06 to enable IFU coverage out to ...
2019
-
[6]
multiple imputations
We are able to cross-match our star-forming sample above to 3567 galaxies in the HI-MaNGA survey. Of these, only 2393 galaxies have HI detections. Lastly, because we only model halos up to logM vir/M⊙ ∼12, we cut off the sample at logM ∗/M⊙ = 9−10.5, leaving 1787 galaxies in our final sample. A.2.ISM mass-metallicity relation Figure 17 shows our fit to th...
2022
-
[7]
fraction
and in Subsection 6.4 we assess the impact of systematic shifts in the ISM MZR on model parameter posteriors. A.3.ISM gas fractions Figure 17 also shows our regression of the ISM gas fraction, which is more involved since we start with only HI masses from HI-MaNGA (Masters et al. 2019; Stark et al. 2021). We assign every MaNGA galaxy a value ofR mol ≡M H2...
2019
-
[8]
degraded
sapphire: Towards Hybrid Physics-Informed, Data-Driven Modeling of Galaxy Formation41 Figure 18.Simple hierarchical Bayesian model for SMHM relation of MaNGA galaxies. Left: the SMHM ratio and halo mass for three example galaxies (blue, green and magenta errorbars) follow the assumed Behroozi et al. (2019) relation. However, the posterior density from poo...
2019
-
[9]
forward-mode
of magnitude speed gains by solving large batches of ODE systems in parallel using vectorized inputs such as our interpolated merger tree matrices. Figure 21 compares the runtime for solving the ODE systems of different numbers of halos on CPUs and GPUs. All runtimes exclude the initialjitcompilation time. For small batch sizes, GPUs are∼10×slower than CP...
2021
-
[10]
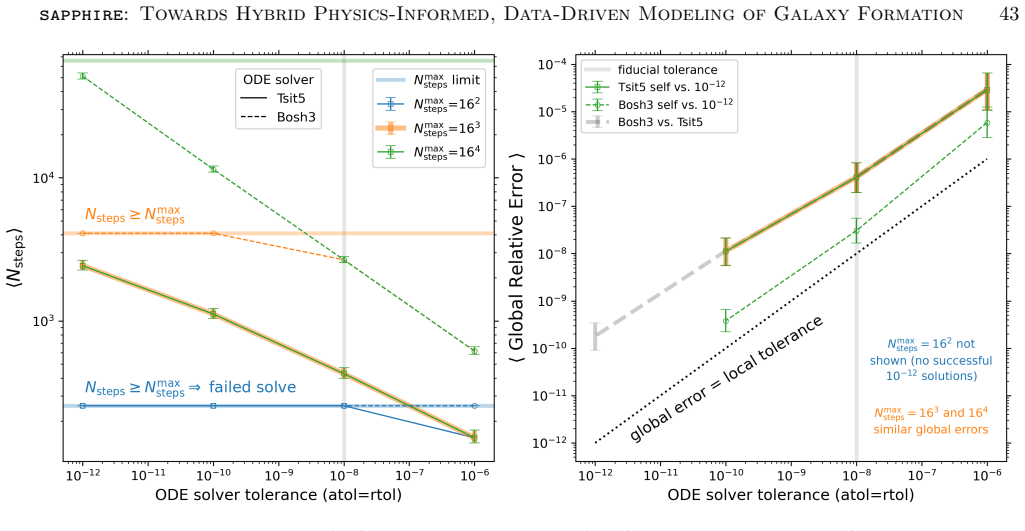
As a baseline, the black line compares each autodiff Jacobian to the “true” autodiff Jacobian with the tightesta tol =r tol = 10−12
depends ona tol =r tol andϵ. As a baseline, the black line compares each autodiff Jacobian to the “true” autodiff Jacobian with the tightesta tol =r tol = 10−12. Since autodiff Jacobians are not subject to finite-diff noise from an arbitraryϵ, this is a self-consistency check of the dependence of the numerical ODE solution on solver error tolerances alone...
2000
-
[11]
The numerical exercises of this subsection increase our confidence in the auto-diff gradients used throughout this paper. Surprisingly, we are unable to find any other study in the≳50 year history of SAMs that attempted this kind of sensitivity analysis using finite-differences, likely because it is very expensive and requires multi-GPU parallelization. N...
2023
discussion (0)
Sign in with ORCID, Apple, or X to comment. Anyone can read and Pith papers without signing in.