REVIEW 2 minor 1 cited by
Introduction to Relational Event Modelling
T0 review · 0 major / 2 minor · reviewed 2026-05-10 · grok-4.3
Pith's one-line read A hands-on tutorial shows how to model timed relational events by expressing them as generalized additive models.
desk verdict A hands-on tutorial on relational event models that organizes existing methods with simulations and applications but adds no new technical results. read the letter →
The pith
A machine-rendered reading of the paper's core claim, the machinery that carries it, and where it could break.
The reading
What carries the argument
Relational event models expressed as generalized additive models, which encode time-dependent effects and sender-receiver dependencies to predict event occurrence.
What would settle it
Running the tutorial's simulation procedure on a small test data set and obtaining event counts or parameter estimates that deviate substantially from the expected distributions shown in the paper.
Extended reading notes
Core claim
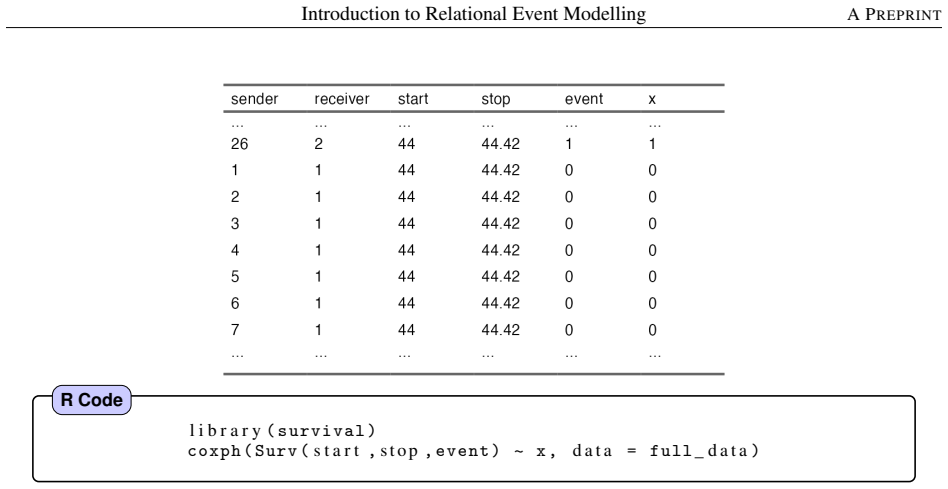
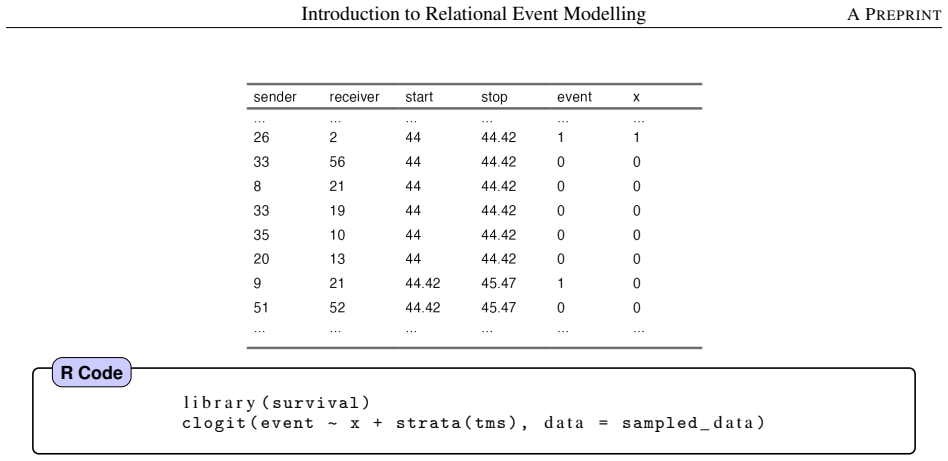
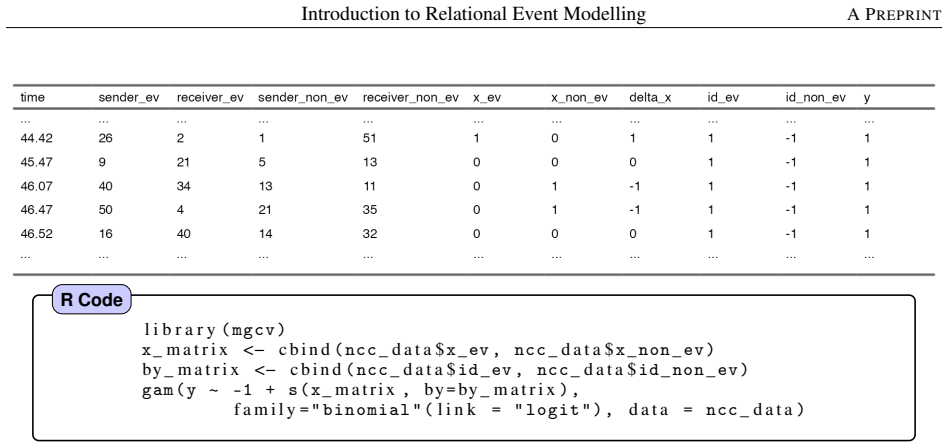
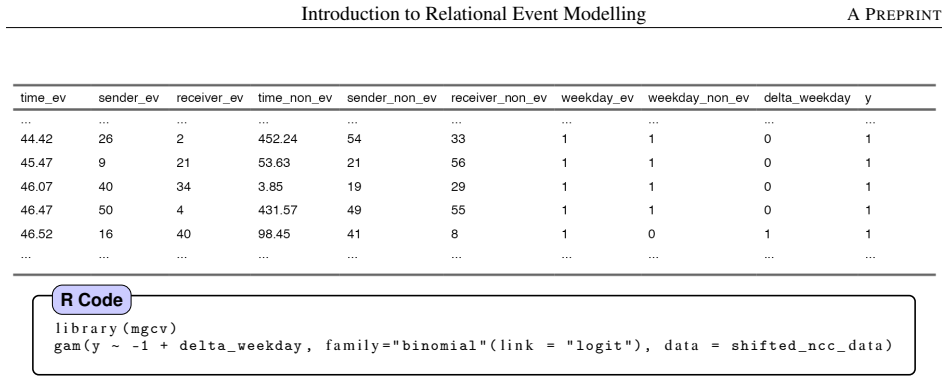
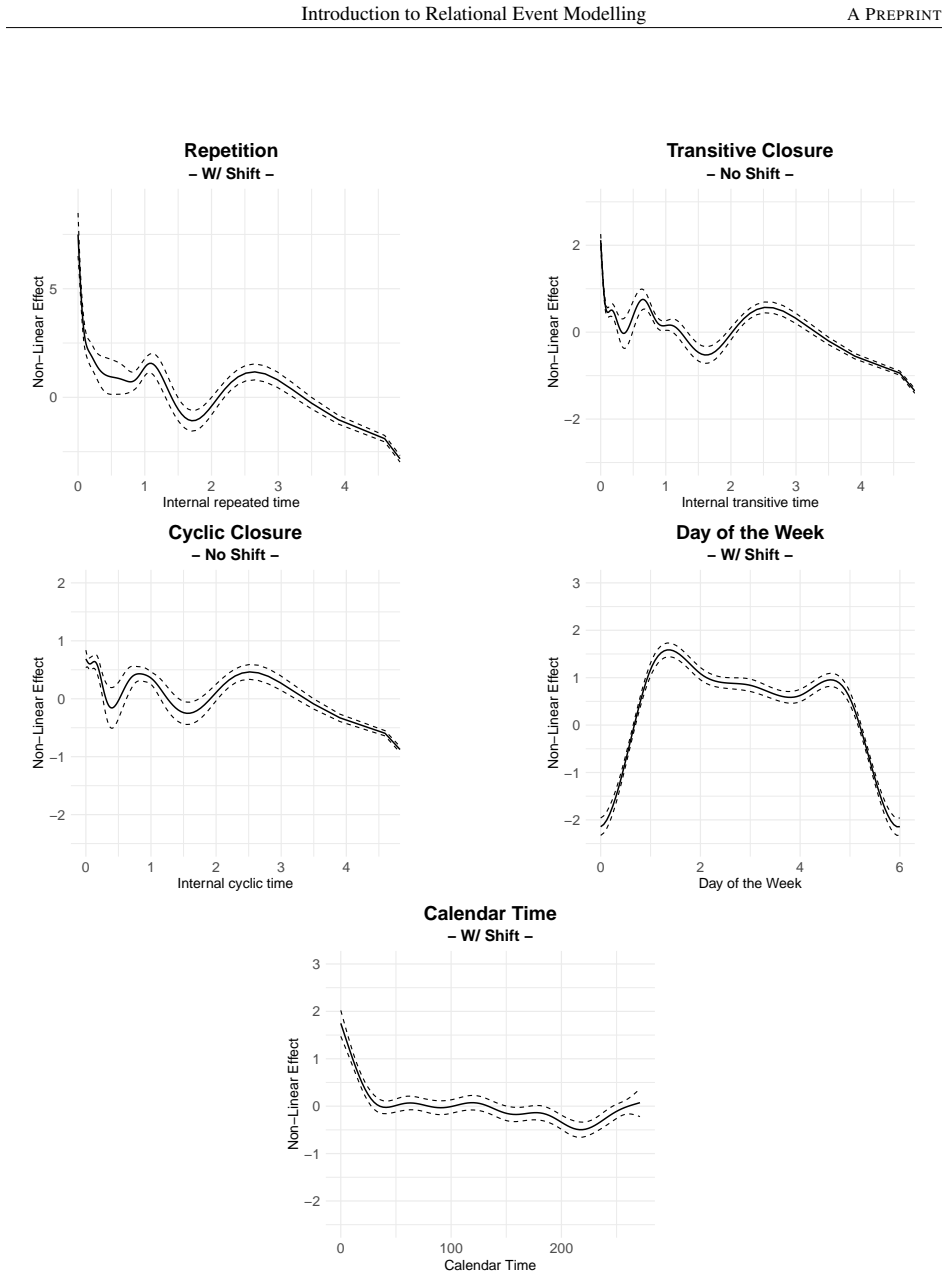
Relational event models treat interactions between a sender and a receiver at a precise time as the basic unit of analysis; recent advances allow these models to be written as generalized additive models that capture complex non-linear effects, and the tutorial supplies the code and examples needed to simulate data under this framework and apply it to empirical cases while comparing modelling options.
Load-bearing premise
The presented simulation code and application examples correctly implement current best practices and that readers can follow them to apply the models on their own data.
Editorial extensions
If this is right
- Analysts gain the ability to generate synthetic relational-event data sets that match chosen dependence structures.
- Empirical studies can directly compare different modelling and inference strategies on the same interaction data.
- Complex non-linear time patterns become identifiable in sender-receiver processes such as citations or transfers.
- Event-history and network perspectives merge into a single usable framework for dynamic interaction data.
Reading between the lines
- Wider availability of working code could increase the number of studies that treat interaction timing as the primary outcome rather than an afterthought.
- The same simulation approach might be adapted to test robustness of findings when event rates change over long observation windows.
- Researchers studying very large networks could build on the tutorial's structure to develop scalable approximations.
Editorial analysis
A structured set of objections, weighed in public.
Referee Report
Summary. The manuscript is a hands-on tutorial introducing relational event models (REMs) for analyzing time-stamped interactions between senders and receivers. It covers theoretical foundations at the intersection of event-history analysis and network modeling, demonstrates simulation of synthetic relational-event data, and walks through empirical applications that compare different modeling and inference strategies, including recent formulations of REMs as generalized additive models. The central claim is that integrating theory, simulation, and applications fills a gap and lowers the barrier to entry for using REMs.
Significance. If the tutorial's explanations and examples are accurate and reflect current best practices, the work would provide a valuable practical resource for researchers in statistics, sociology, and related fields studying dynamic relational data. The explicit comparison of modeling strategies is a strength that can help users make informed choices, and the focus on simulation offers a concrete way to build intuition before applying the methods to real data.
minor comments (2)
- The abstract states that 'an essay and a comprehensive review exist' but does not cite them; adding these references would strengthen the novelty claim and help readers locate prior work.
- To support the tutorial's goal of lowering the barrier to entry, the manuscript should explicitly indicate the availability of code and data for the simulation and empirical examples (e.g., via a GitHub repository or supplementary materials).
Simulated Author's Rebuttal
We thank the referee for their thorough and positive review of our manuscript. We are pleased that the tutorial is viewed as a valuable practical resource that integrates theory, simulation, and empirical applications to lower the barrier for using relational event models. The recommendation to accept is appreciated.
Circularity Check
No circularity: purely instructional tutorial with no derivations or predictions
full rationale
The paper is a hands-on tutorial introducing relational event models (REMs), covering theory, synthetic data simulation, and empirical applications. It makes no claims of deriving new predictions, first-principles results, or fitted quantities from within its own content. The central contribution is filling a gap for accessible instructional material by integrating existing concepts, without any self-definitional loops, fitted inputs renamed as predictions, or load-bearing self-citations that reduce the argument to its own inputs. No equations or modeling steps are presented as novel derivations that could exhibit circularity.
Assumptions & free parameters
assumptions (1)
- domain assumption Relational event models can be expressed as generalized additive models to capture complex non-linear patterns over time
Cite this review
Pith. "Pith review of Introduction to Relational Event Modelling." pith.science (2026). https://pith.science/paper/2604.07063
@misc{pith2026260407063,
  author       = {Pith},
  title        = {Pith review of: Introduction to Relational Event Modelling},
  year         = {2026},
  howpublished = {\url{https://pith.science/paper/2604.07063}},
  note         = {Machine review of arXiv:2604.07063}
}
read the original abstract
Interactions and time shape many aspects of life. Everyday activities -- like conversations, emails, money transfers, citations, and even acts of violence -- are relational events: interactions between a sender and a receiver at a specific moment. At the intersection of event-history analysis and network modelling, relational event models (REMs) offer a powerful framework for studying when and why these events occur. Recent advances have made it possible to express REMs as generalized additive models, allowing researchers to capture complex, non-linear patterns over time. While an essay and a comprehensive review exist, a hands-on tutorial paper on REMs is still missing. This work fills that gap. It provides a practical introduction to REMs, incorporating the latest developments in the field. It demonstrates how to simulate synthetic relational-event data and walks through several empirical applications, comparing different modelling and inference strategies. By bringing together theory, simulation, and application, this tutorial lowers the barrier to entry and makes REMs a more accessible and practical tool.
Figures
Figures from the paper (14 more)
Lean theorems connected to this paper
-
IndisputableMonolith/Foundation/RealityFromDistinction.leanreality_from_one_distinction unclear?
unclearRelation between the paper passage and the cited Recognition theorem.
λ_sr(t) = I_sr(t) × λ0(t) × exp{f[x_sr(t)]} ... partial likelihood ... GAM formulation ... AIC model selection
-
IndisputableMonolith/Cost/FunctionalEquation.leanwashburn_uniqueness_aczel unclear?
unclearRelation between the paper passage and the cited Recognition theorem.
endogenous covariates ... reciprocity ... exponential decay ... non-linear effects via B-splines
What do these tags mean?
- matches
- The paper's claim is directly supported by a theorem in the formal canon.
- supports
- The theorem supports part of the paper's argument, but the paper may add assumptions or extra steps.
- extends
- The paper goes beyond the formal theorem; the theorem is a base layer rather than the whole result.
- uses
- The paper appears to rely on the theorem as machinery.
- contradicts
- The paper's claim conflicts with a theorem or certificate in the canon.
- unclear
- Pith found a possible connection, but the passage is too broad, indirect, or ambiguous to say the theorem truly supports the claim.
Forward citations
Cited by 1 Pith paper
-
Inference of large scale relational state processes
A continuous-time multi-state relational model with anchor-and-pull covariates admits efficient Cox nested-case-control estimation for full histories and a logistic approximation for binary panel data.
Reference graph
Works this paper leans on
-
[1]
doi:10.1038/s41598-025-94969-0. Frank Harary. On the notion of balance of a signed graph.Michigan Mathematical Journal, 2(2):143–146, 1953. doi:10.1307/mmj/1028989917. Trevor Hastie and Robert Tibshirani.Generalized Additive Models. Chapman and Hall, 1990. Trevor Hastie, Robert Tibshirani, Jerome H Friedman, and Jerome H Friedman.The elements of statistic...
-
[2]
doi:10.32614/RJ-2018-009. Edzer Pebesma and Roger Bivand.Spatial Data Science: With applications in R. Chapman and Hall/CRC, 2023. doi:10.1201/9780429459016. URLhttps://r-spatial.org/book/. Patrick O. Perry and Patrick J. Wolfe. Point process modelling for directed interaction networks.Journal of the Royal Statistical Society: Series B (Statistical Method...
-
[3]
Marc Schneble.New Approaches in Statistical Modeling
doi:10.1007/s10531-018-1535-9. Marc Schneble.New Approaches in Statistical Modeling. PhD thesis, Ludwig-Maximilians-Universität München, 2021. Hanno Seebens, Tim M Blackburn, Ellie E Dyer, Piero Genovesi, Philip E Hulme, Jonathan M Jeschke, Shyama Pagad, Petr Pyšek, Marten Winter, Margarita Arianoutsou, et al. No saturation in the accumulation of alien sp...
Reviewed May 10, 2026 · model on record in the stance chip above.
Discussion (0). Sign in to comment.