Grid Capacity Expansion under Data Centers and Electrified Manufacturing Large Loads
Pith reviewed 2026-06-29 10:07 UTC · model grok-4.3
The pith
Optimal investments in an ERCOT-like grid under data center and manufacturing loads require an 83.6 percent increase in generation capacity over seven years.
A machine-rendered reading of the paper's core claim, the machinery that carries it, and where it could break.
Core claim
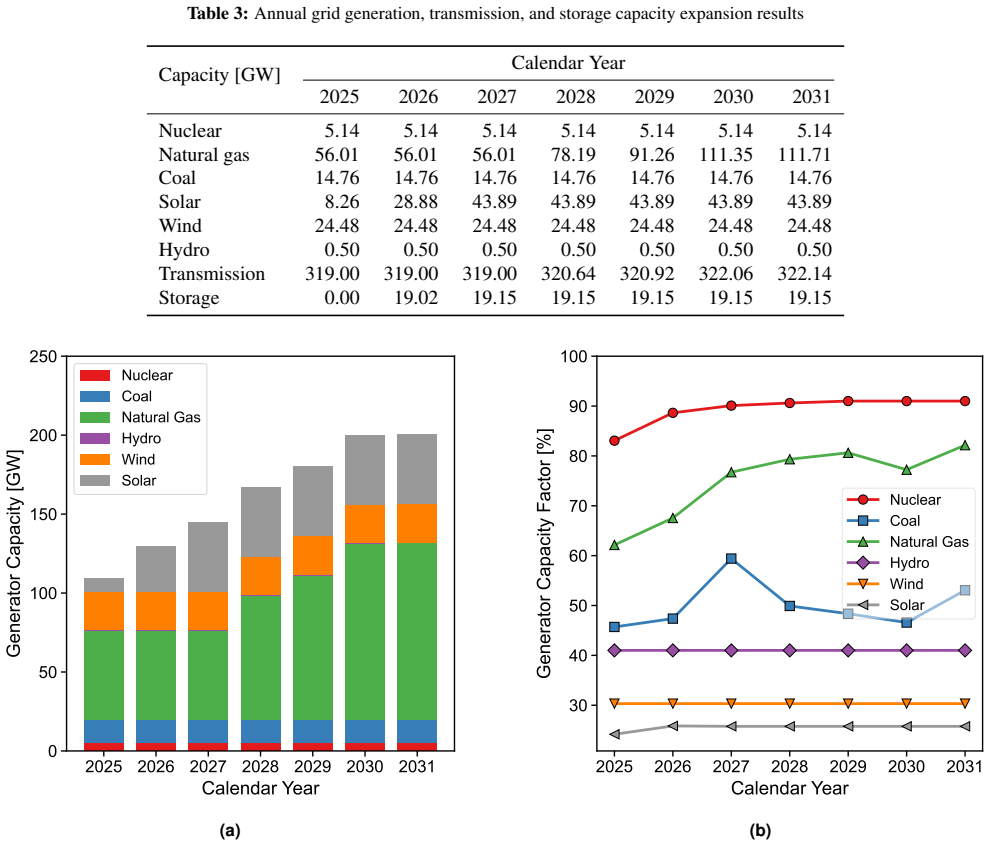
The central discovery is that the optimal investment policy leads to an 83.6% increase in generation capacity and exploits the short construction times of solar and storage as well as the operational flexibility of thermal generators to satisfy demand at minimum total cost over the seven-year horizon.
What carries the argument
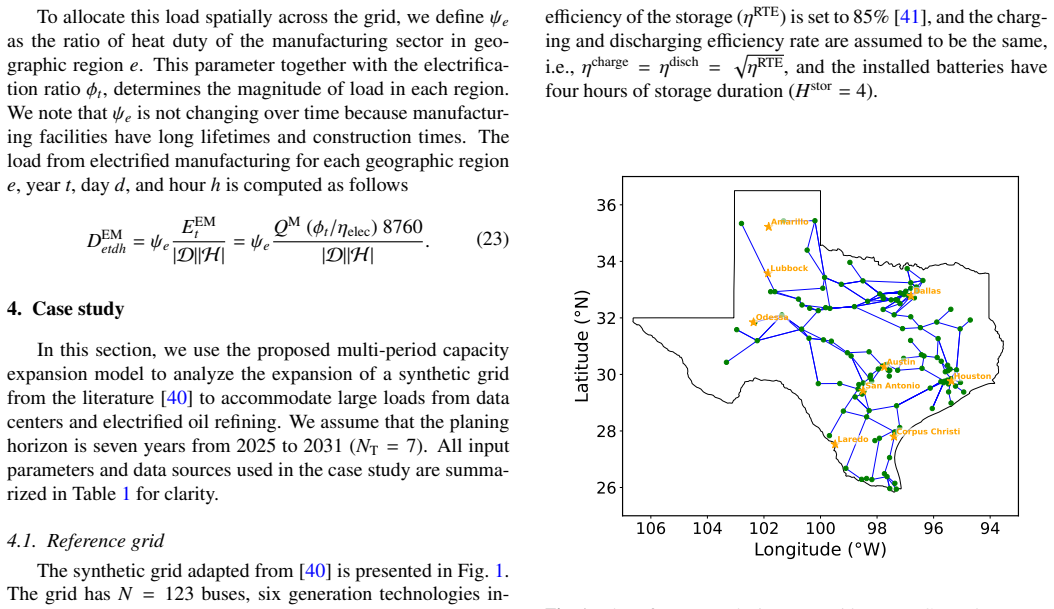
A multi-period grid capacity expansion model that accounts for hourly power dispatch and a new spatial distribution approach for large loads.
If this is right
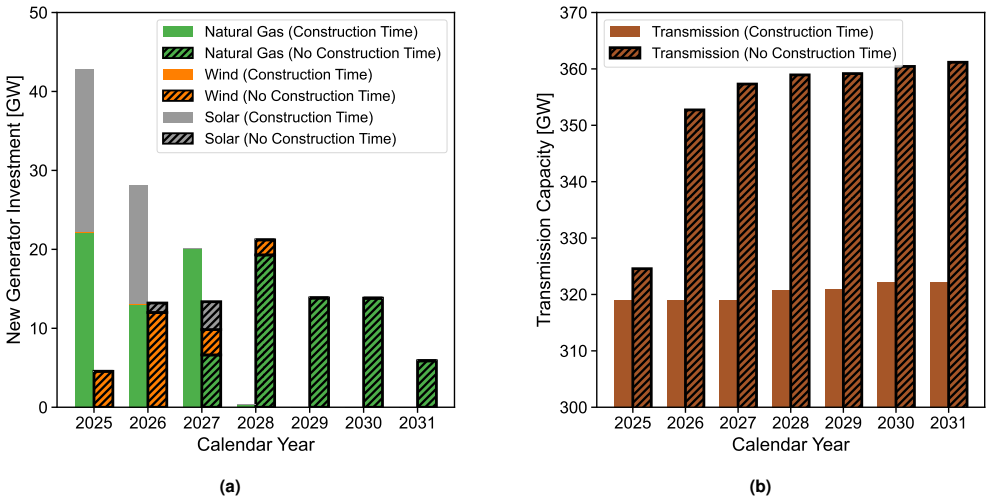
- Construction time of grid assets substantially impacts investment timing, generation technology mix, and transmission capacity expansion.
- The modeling framework is general and can be extended to other grid systems and demand scenarios.
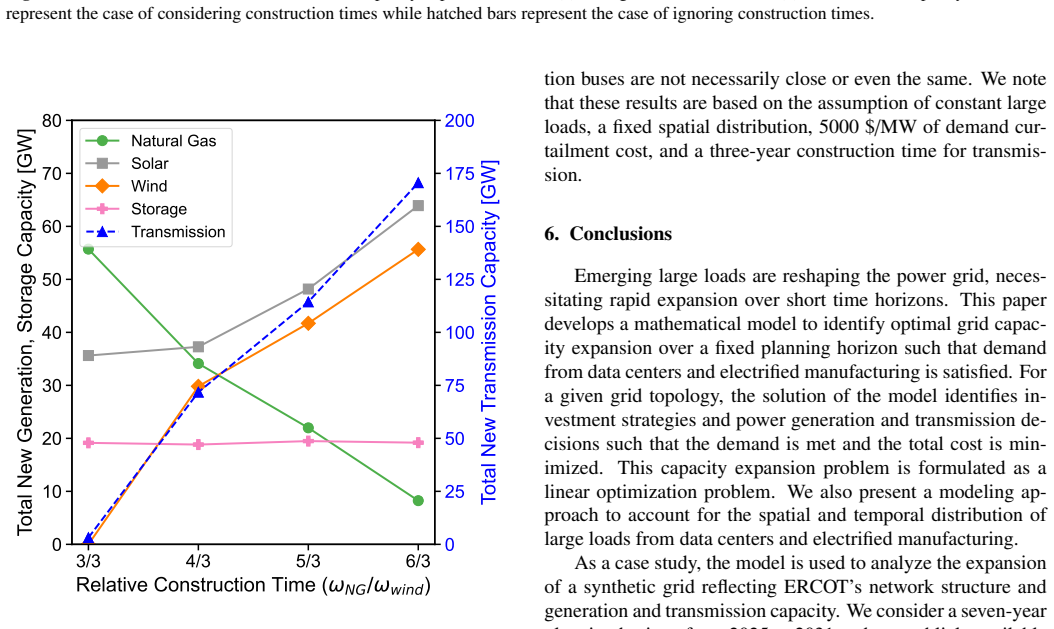
- Sensitivity analysis on construction times reveals effects on the overall expansion strategy.
Where Pith is reading between the lines
- Planners may need to accelerate permitting processes for solar and storage to match the model's preferred timeline.
- The spatial distribution assumption for loads could be tested by comparing model outputs against real-world interconnection queues in ERCOT.
- Similar models could inform siting decisions for future data centers to minimize transmission upgrades.
Load-bearing premise
The synthetic grid accurately captures the key characteristics of the ERCOT system and the assumed locations and growth rates of the large loads are realistic.
What would settle it
Running the actual ERCOT grid over the next seven years with the projected load growth and comparing the observed generation capacity additions and total costs against the model's 83.6 percent increase and optimal mix.
Figures
read the original abstract
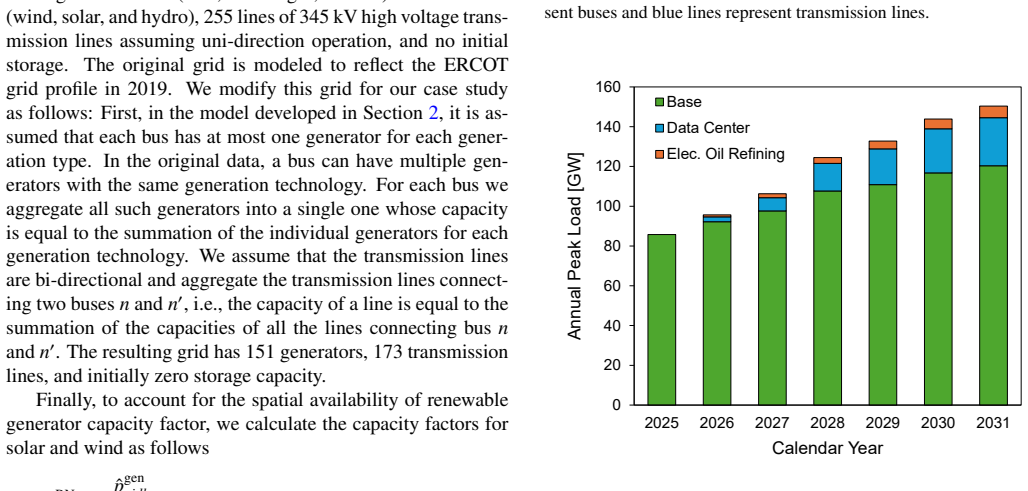
In this paper, we consider the expansion of power grids under emerging large loads from data centers and electrified manufacturing. We develop a multi-period grid capacity expansion model to determine optimal investment profiles for power generation, storage, and transmission capacity while accounting for hourly power dispatch, such that electricity demand is satisfied and the total planning and operation cost is minimized. We also propose a new modeling approach regarding the spatial distribution of demand from large loads. The model is used to analyze the expansion of a synthetic grid that follows key characteristics of the ERCOT system over a seven-year planning horizon, under loads from data centers and electrified oil refining, which account for 17.5% and 4.7% of total annual electricity demand by the end of the planning horizon. The optimal investment policy leads to an 83.6% increase in generation capacity and exploits the short construction times of solar and storage as well as the operational flexibility of thermal generators. Finally, sensitivity analysis reveals that the construction time of grid assets substantially impacts investment timing, generation technology mix, and transmission capacity expansion. The proposed modeling framework is general and can be extended to other grid systems, enabling the exploration of diverse demand scenarios, policy assumptions, and regional characteristics.
Editorial analysis
A structured set of objections, weighed in public.
Referee Report
Summary. The paper develops a multi-period mixed-integer linear programming model for power system capacity expansion that co-optimizes generation, storage, and transmission investments while enforcing hourly power balance and respecting construction lead times. A new spatial-allocation rule is introduced for large loads from data centers (17.5 % of annual demand) and electrified manufacturing (4.7 %). The model is solved on a synthetic network whose topology and parameters are stated to follow ERCOT characteristics over a seven-year horizon; the resulting optimal policy requires an 83.6 % increase in generation capacity, exploits short build times of solar and storage, and uses thermal-generator flexibility. Sensitivity analysis shows that construction durations materially affect investment timing, technology mix, and transmission expansion.
Significance. If the synthetic network and load-placement assumptions are representative, the work supplies a reusable planning framework that quantifies the scale of capacity additions needed under rapid sectoral electrification and isolates the policy-relevant role of construction lead times. The explicit multi-period, hourly-dispatch formulation and the reported sensitivity results constitute concrete, falsifiable outputs that can be tested against other systems or updated demand forecasts.
major comments (2)
- [model application paragraph] Abstract and model-application paragraph: the headline 83.6 % generation-capacity increase is obtained on a synthetic grid whose line limits, generator parameters, and topology are asserted to “follow key characteristics” of ERCOT, yet no quantitative fidelity metrics (RMSE on capacities, bus-level load correlation, or comparison with published ERCOT congestion reports) are supplied. Because the objective is total cost and the model is deterministic, even modest mismatches in binding transmission or reserve constraints can shift the optimal solar–storage–thermal mix and therefore the reported capacity increment.
- [spatial distribution modeling] Spatial-distribution section: the new modeling approach that places the 17.5 % data-center and 4.7 % electrified-manufacturing increments is load-bearing for the transmission-expansion component of the solution, but the manuscript provides neither an empirical justification for the chosen geographic allocation nor a sensitivity comparison against alternative spatial patterns. Altering the assumed locations would directly affect which lines become binding and therefore the 83.6 % figure.
minor comments (2)
- [model formulation] The MIP formulation would benefit from an explicit statement of the construction-time constraints (lead-time indexing of investment variables) in the main text rather than the appendix, to allow readers to verify how the short build times of solar and storage are encoded.
- [results] Table or figure reporting the technology mix under the base case and the construction-time sensitivity cases should include absolute GW values in addition to percentages so that the 83.6 % increase can be directly compared with ERCOT’s existing fleet size.
Simulated Author's Rebuttal
We thank the referee for the constructive comments. We address each major point below and indicate planned revisions where appropriate.
read point-by-point responses
-
Referee: Abstract and model-application paragraph: the headline 83.6 % generation-capacity increase is obtained on a synthetic grid whose line limits, generator parameters, and topology are asserted to “follow key characteristics” of ERCOT, yet no quantitative fidelity metrics (RMSE on capacities, bus-level load correlation, or comparison with published ERCOT congestion reports) are supplied. Because the objective is total cost and the model is deterministic, even modest mismatches in binding transmission or reserve constraints can shift the optimal solar–storage–thermal mix and therefore the reported capacity increment.
Authors: We agree that explicit quantitative fidelity metrics would strengthen the description of the synthetic network. The network was built to replicate key ERCOT characteristics (topology, aggregate capacities, and load patterns) drawn from public sources, but the manuscript does not report RMSE, bus-level correlations, or congestion-report comparisons. In revision we will add a concise subsection detailing the network-construction procedure and any direct comparisons that can be made with available ERCOT data. The 83.6 % figure remains the result for the modeled synthetic system; the added material will clarify its representativeness without altering the core analysis. revision: partial
-
Referee: Spatial-distribution section: the new modeling approach that places the 17.5 % data-center and 4.7 % electrified-manufacturing increments is load-bearing for the transmission-expansion component of the solution, but the manuscript provides neither an empirical justification for the chosen geographic allocation nor a sensitivity comparison against alternative spatial patterns. Altering the assumed locations would directly affect which lines become binding and therefore the 83.6 % figure.
Authors: The spatial-allocation rule is presented as a modeling contribution that incorporates realistic siting considerations (proximity to transmission, cooling resources, and industrial corridors). The current text does not supply empirical justification or sensitivity runs on alternative patterns. We will expand the spatial-distribution section to articulate the assumptions and data sources used for the chosen allocation and will add a sensitivity study on alternative geographic distributions. This will quantify the effect on binding lines, transmission investment, and the overall capacity increment. revision: yes
Circularity Check
No circularity: optimization outputs on externally specified inputs
full rationale
The paper formulates a multi-period MIP minimizing total planning and operation cost subject to demand satisfaction, capacity limits, and construction timelines. The 83.6% generation capacity increase is obtained by solving this model on a synthetic ERCOT-like grid and externally assumed spatial load increments (17.5% data centers + 4.7% electrified manufacturing). No equations reduce a claimed prediction to a fitted parameter by construction, no self-citations are load-bearing for the central result, and the spatial-distribution modeling approach is presented as a modeling choice rather than derived from the outputs. The derivation chain is self-contained against the stated assumptions.
Axiom & Free-Parameter Ledger
axioms (2)
- standard math Linear programming formulation accurately captures grid capacity expansion decisions and hourly dispatch constraints
- domain assumption The synthetic grid follows key characteristics of the ERCOT system
Forward citations
Cited by 2 Pith papers
-
Industrial electrification in the era of data centers: A Bayesian Optimization approach for grid-aware large load allocation
Bilevel optimization framework with Bayesian optimization allocates large loads from data centers and electrified oil refineries on a synthetic Texas-like grid, showing competition for power and distributed data cente...
-
Industrial electrification in the era of data centers: A Bayesian Optimization approach for grid-aware large load allocation
Bilevel optimization with Bayesian Optimization allocates large loads from electrified oil refineries and data centers on a synthetic Texas-like grid, revealing competition and data center distribution under high loads.
Reference graph
Works this paper leans on
-
[1]
Energy Information Administration, Monthly energy review: October 2025, Tech
U.S. Energy Information Administration, Monthly energy review: October 2025, Tech. rep., U.S. Department of En- ergy, Washington, DC, Accessed: 2025-11-20 (October 2025). URLhttps://www.eia.gov/totalenergy/data/m onthly/
2025
-
[2]
Electric Reliability Council of Texas (ERCOT), 2025 er- cot system planning: Long-term hourly peak demand and energy forecast, Technical report (Apr. 2025)
2025
-
[3]
Shehabi, S
A. Shehabi, S. J. Smith, A. Hubbard, A. Newkirk, N. Lei, M. A. B. Siddik, B. Holecek, J. Koomey, E. Masanet, D. Sartor, 2024 United States data center energy usage report, Lawrence Berkeley National LaboratoryLBNL- 2001637 (2024)
2024
-
[4]
Department of Energy, Industrial Technologies Of- fice, Manufacturing energy and carbon footprints (2018 mecs) (2022)
U.S. Department of Energy, Industrial Technologies Of- fice, Manufacturing energy and carbon footprints (2018 mecs) (2022). URLhttps://www.energy.gov/eere/amo/manufa cturing-energy-and-carbon-footprints-2018-m ecs
2018
-
[5]
Hemmati, R.-A
R. Hemmati, R.-A. Hooshmand, A. Khodabakhshian, State-of-the-art of transmission expansion planning: Comprehensive review, Renewable and Sustainable En- ergy Reviews 23 (2013) 312–319
2013
-
[6]
N. E. Koltsaklis, A. S. Dagoumas, State-of-the-art gener- ation expansion planning: A review, Applied energy 230 (2018) 563–589
2018
-
[7]
Nahmmacher, E
P. Nahmmacher, E. Schmid, L. Hirth, B. Knopf, Carpe diem: A novel approach to select representative days for long-term power system modeling, Energy 112 (2016) 430–442
2016
-
[8]
Y . Liu, R. Sioshansi, A. J. Conejo, Hierarchical cluster- ing to find representative operating periods for capacity- expansion modeling, IEEE Transactions on Power Sys- tems 33 (3) (2017) 3029–3039
2017
-
[9]
C. Li, A. J. Conejo, J. D. Siirola, I. E. Grossmann, On rep- resentative day selection for capacity expansion planning of power systems under extreme operating conditions, In- ternational Journal of Electrical Power & Energy Systems 137 (2022) 107697
2022
-
[10]
C. L. Lara, D. S. Mallapragada, D. J. Papageorgiou, A. Venkatesh, I. E. Grossmann, Deterministic electric power infrastructure planning: Mixed-integer program- ming model and nested decomposition algorithm, Eu- ropean Journal of Operational Research 271 (3) (2018) 1037–1054
2018
-
[11]
Potts, S
J. Potts, S. Castellanos, Grid planning insights from near- optimal generation portfolios amidst large-load growth, npj Clean Energy 1 (1) (2025) 14. 12
2025
-
[12]
C. Li, A. J. Conejo, P. Liu, B. P. Omell, J. D. Siirola, I. E. Grossmann, Mixed-integer linear programming mod- els and algorithms for generation and transmission expan- sion planning of power systems, European Journal of Op- erational Research 297 (3) (2022) 1071–1082
2022
-
[13]
B. A. Frew, M. Z. Jacobson, Temporal and spatial trade- offs in power system modeling with assumptions about storage: An application of the power model, Energy 117 (2016) 198–213
2016
-
[14]
M. M. Frysztacki, J. Hörsch, V . Hagenmeyer, T. Brown, The strong effect of network resolution on electricity sys- tem models with high shares of wind and solar, Applied Energy 291 (2021) 116726
2021
-
[15]
Aryanpur, B
V . Aryanpur, B. O’Gallachoir, H. Dai, W. Chen, J. Glynn, A review of spatial resolution and regionalisation in national-scale energy systems optimisation models, En- ergy Strategy Reviews 37 (2021) 100702
2021
-
[16]
Serpe, W
L. Serpe, W. Cole, B. Sergi, M. Brown, V . Carag, A. Kar- makar, The importance of spatial resolution in large-scale, long-term planning models, Applied Energy 385 (2025) 125534
2025
-
[17]
E. Glista, B. Knueven, J.-P. Watson, From zonal to nodal capacity expansion planning: Spatial aggregation impacts on a realistic test-case, arXiv preprint arXiv:2510.23586 (2025)
work page internal anchor Pith review Pith/arXiv arXiv 2025
-
[18]
Z. Shao, N. Yu, D. Wong, Stochastic long-term joint de- carbonization planning for power systems and data cen- ters: A case study in pjm, International Journal of Electri- cal Power & Energy Systems 173 (2025) 111377
2025
-
[19]
Abdelhady, E
M. Abdelhady, E. Iakovou, E. N. Pistikopoulos, Optimal energy portfolio investment strategies for data centers un- der deep market uncertainty, Applied Energy 410 (2026) 127510
2026
-
[20]
Lieberwirth, H
M. Lieberwirth, H. Hobbie, Decarbonizing the industry sector and its effect on electricity transmission grid oper- ation—implications from a model based analysis for ger- many, Journal of Cleaner Production 402 (2023) 136757
2023
-
[21]
Gailani, P
A. Gailani, P. Taylor, Assessing electricity network ca- pacity requirements for industrial decarbonisation in great britain, Energy Policy 201 (2025) 114559
2025
-
[22]
Arzumanyan, E
M. Arzumanyan, E. R. Calzado, N. Lin, V . Bahadur, J. Das, T. L. Ko, L. Koesterke, Geospatial suitability anal- ysis for data center placement: A case study in texas, usa, Sustainable Cities and Society (2025) 106687
2025
-
[23]
S. Kwon, L. Ntaimo, N. Gautam, Demand response in data centers: Integration of server provisioning and power procurement, IEEE transactions on Smart Grid 10 (5) (2018) 4928–4938
2018
-
[24]
Z. Ding, L. Xie, Y . Lu, P. Wang, S. Xia, Emission-aware stochastic resource planning scheme for data center mi- crogrid considering batch workload scheduling and risk management, IEEE Transactions on Industry Applications 54 (6) (2018) 5599–5608
2018
-
[25]
Bahrami, V
S. Bahrami, V . W. Wong, J. Huang, Data center demand response in deregulated electricity markets, IEEE Trans- actions on Smart Grid 10 (3) (2018) 2820–2832
2018
-
[26]
L. Yu, T. Jiang, Y . Zou, Distributed real-time energy man- agement in data center microgrids, IEEE Transactions on Smart Grid 9 (4) (2016) 3748–3762
2016
-
[27]
C.-C. Hung, L. Golubchik, M. Yu, Scheduling jobs across geo-distributed datacenters, in: Proceedings of the Sixth ACM Symposium on Cloud Computing, 2015, pp. 111– 124
2015
-
[28]
Z. Hu, B. Li, J. Luo, Time-and cost-efficient task schedul- ing across geo-distributed data centers, IEEE Transactions on Parallel and Distributed Systems 29 (3) (2017) 705– 718
2017
-
[29]
F. R. Dogar, T. Karagiannis, H. Ballani, A. Rowstron, Decentralized task-aware scheduling for data center net- works, ACM SIGCOMM Computer Communication Re- view 44 (4) (2014) 431–442
2014
-
[30]
URLhttps://maps.nrel.gov/speed-to-power/d ata-viewer
National Renewable Energy Laboratory, Data Center De- mand Capacity by County, Speed-to-Power Data Viewer (2025). URLhttps://maps.nrel.gov/speed-to-power/d ata-viewer
2025
-
[31]
Baldea, E
M. Baldea, E. E. Endler, E. Hale, C. T. Maravelias, M. Barolo, I. Harjunkoski, M. Mercangoz, S. L. Shah, M. Soroush, B. R. Young, et al., Transforming the pro- cess industries through electrification: Challenges and op- portunities, Industrial & Engineering Chemistry Research 64 (34) (2025) 16466–16478
2025
-
[32]
Giannikopoulos, A
I. Giannikopoulos, A. Skouteris, D. T. Allen, M. Baldea, M. A. Stadtherr, Thermal electrification of chemical pro- cesses using renewable energy: Economic and decar- bonization impacts, Industrial & Engineering Chemistry Research 63 (27) (2024) 12064–12082
2024
-
[33]
Chattopadhyay, K
S. Chattopadhyay, K. Karthikeyan, R. Gandhi, I. E. Gross- mann, A. I. Torres, Optimal retrofit of carbon capture and electrification technologies in oil refineries for reducing direct co2 emissions, Industrial & Engineering Chemistry Research 64 (20) (2025) 10131–10147
2025
-
[34]
J. H. Rho, M. Baldea, E. E. Endler, M. A. Heredia, V . Bo- jovic, P. Pajand, Probing the impact of electric heating on the design, dynamics, and operation of integrated chem- ical processes, Industrial & Engineering Chemistry Re- search 64 (11) (2025) 6043–6059. 13
2025
-
[35]
Granacher, C
J. Granacher, C. H. Geissler, C. T. Maravelias, System- level analysis of industrial electrification, AIChE Journal (2025) e70142
2025
-
[36]
Zhang, I
Q. Zhang, I. E. Grossmann, Enterprise-wide optimization for industrial demand side management: Fundamentals, advances, and perspectives, Chemical Engineering Re- search and Design 116 (2016) 114–131
2016
-
[37]
X. Tang, M. Baldea, A grid view on the dynamics of pro- cesses participating in demand response programs, Com- puters & Chemical Engineering 169 (2023) 108070
2023
-
[38]
J. Chen, T. Harms, Data center load forecasts, 2024–2040, Presentation slides, California Energy Commission, En- ergy Assessment Division, presented on October 21, 2024 (Oct. 2024)
2024
-
[39]
Sherwood, Review of large load tariffs to identify safe- guards and protections for existing ratepayers, Final re- port, Earthjustice, final Version, January 28, 2025 (Jan
S. Sherwood, Review of large load tariffs to identify safe- guards and protections for existing ratepayers, Final re- port, Earthjustice, final Version, January 28, 2025 (Jan. 2025)
2025
-
[40]
J. Lu, X. Li, H. Li, T. Chegini, C. Gamarra, Y . E. Yang, M. Cook, G. Dillingham, A synthetic texas power sys- tem with time-series weather-dependent spatiotemporal profiles, Sustainable Energy, Grids and Networks (2025) 101774
2025
-
[41]
Mirletz, L
B. Mirletz, L. Vimmerstedt, G. Avery, A. Sekar, D. Stright, D. Akindipe, S. Cohen, W. Cole, P. Duffy, A. Eberle, et al., Annual technology baseline: The 2024 electricity update, Tech. rep., National Renewable Energy Laboratory (NREL), Golden, CO (United States) (2024)
2024
-
[42]
Accessed: 2026-02-09 (2023)
International Energy Agency, Average lead times to build new electricity grid assets in europe and the united states, 2010–2021, license: CC BY 4.0. Accessed: 2026-02-09 (2023). URLhttps://www.iea.org/data-and-statistic s/charts/average-lead-times-to-build-new-e lectricity-grid-assets-in-europe-and-the-u nited-states-2010-2021
2010
-
[43]
Andrade, R
J. Andrade, R. Baldick, Estimation of transmission costs for new generation, University of Texas (2016)
2016
-
[44]
DeCarolis, A
J. DeCarolis, A. LaRose, Annual energy outlook 2023, US Energy Information Administration (2023)
2023
-
[45]
McMillan, M
C. McMillan, M. Ruth, Industrial process heat demand characterization, Tech. rep., National Renewable Energy Laboratory-Data (NREL-DATA), Golden, CO (United . . . (2018)
2018
-
[46]
M. J. S. Zuberi, A. Hasanbeigi, W. Morrow, Electrification of industrial boilers in the usa: potentials, challenges, and policy implications, Energy Efficiency 15 (8) (2022) 70
2022
-
[47]
Tavenard, J
R. Tavenard, J. Faouzi, G. Vandewiele, F. Divo, G. An- droz, C. Holtz, M. Payne, R. Yurchak, M. Rußwurm, K. Kolar, et al., Tslearn, a machine learning toolkit for time series data, Journal of machine learning research 21 (118) (2020) 1–6
2020
-
[48]
URLhttps://geo.fcc.gov/api/census/block/f ind
Federal Communications Commission (FCC), Area and census block api, online; accessed March 3, 2026 (n.d.). URLhttps://geo.fcc.gov/api/census/block/f ind
2026
-
[49]
Gurobi Optimization, LLC, Gurobi Optimizer Reference Manual (2025)
2025
-
[50]
C. Guo, F. Luo, Z. Cai, Z. Y . Dong, Integrated energy sys- tems of data centers and smart grids: State-of-the-art and future opportunities, Applied Energy 301 (2021) 117474
2021
-
[51]
S. Hall, F. Micheli, G. Belgioioso, A. Radovanovi ´c, F. Dörfler, Carbon-aware computing for data centers with probabilistic performance guarantees, IEEE Transactions on Power Systems (2025)
2025
- [52]
-
[53]
Zhang, I
Q. Zhang, I. E. Grossmann, Planning and scheduling for industrial demand side management: advances and chal- lenges, Alternative energy sources and technologies: pro- cess design and operation (2016) 383–414. 14
2016
discussion (0)
Sign in with ORCID, Apple, or X to comment. Anyone can read and Pith papers without signing in.