A Rapid Evolution in the Observed Mbh/M* Relation at z > 3 Revealed via Spectro-photometric SED-Modeling
Pith reviewed 2026-06-29 06:29 UTC · model grok-4.3
The pith
Non-LRD AGN at z>4.5 show elevated Mbh/M* ratios that match the local relation below z=3.5, with the shift driven by stellar mass growth.
A machine-rendered reading of the paper's core claim, the machinery that carries it, and where it could break.
Core claim
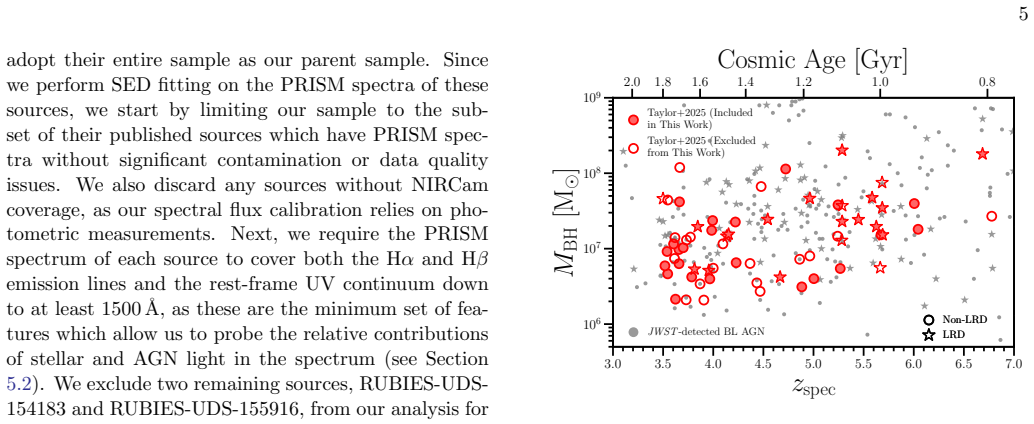
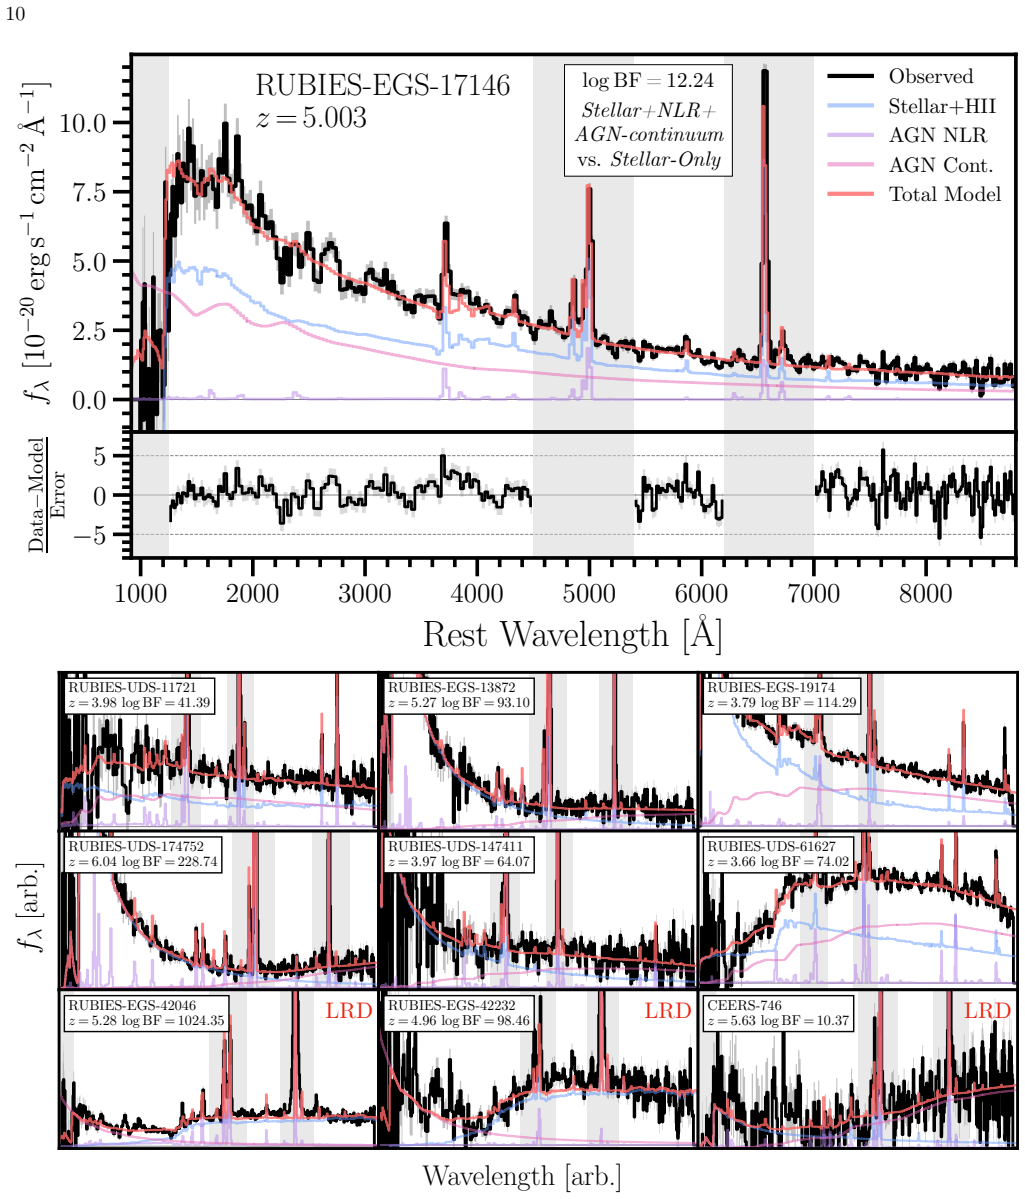
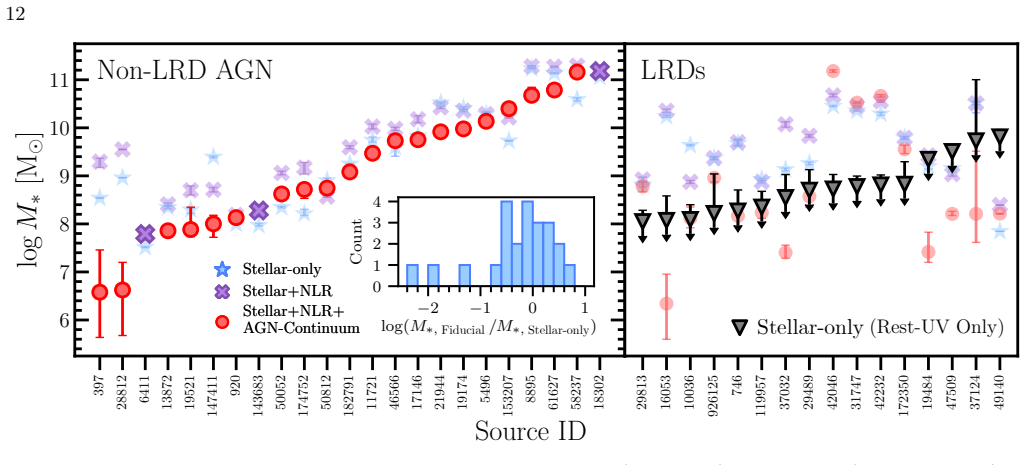
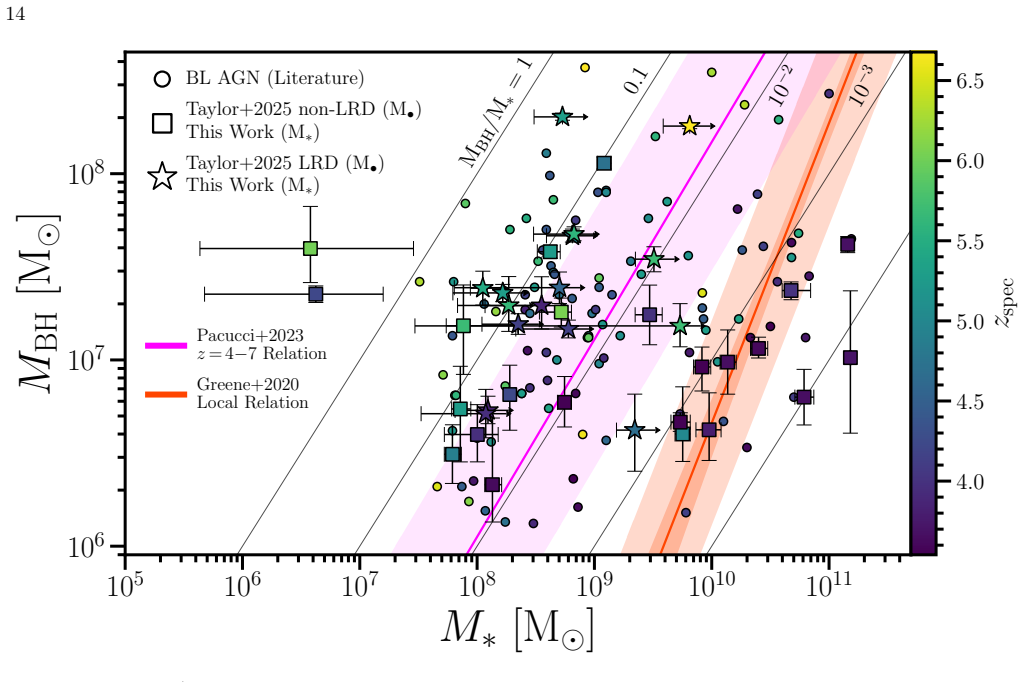
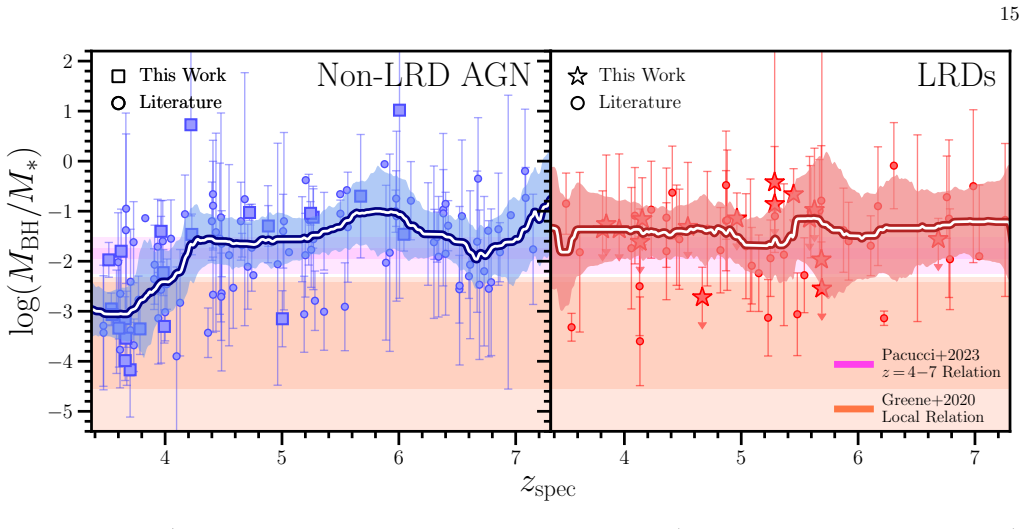
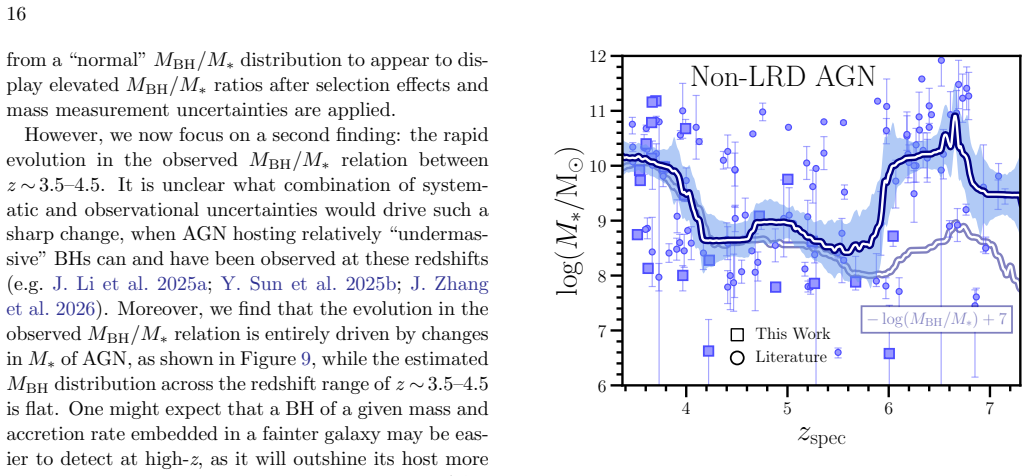
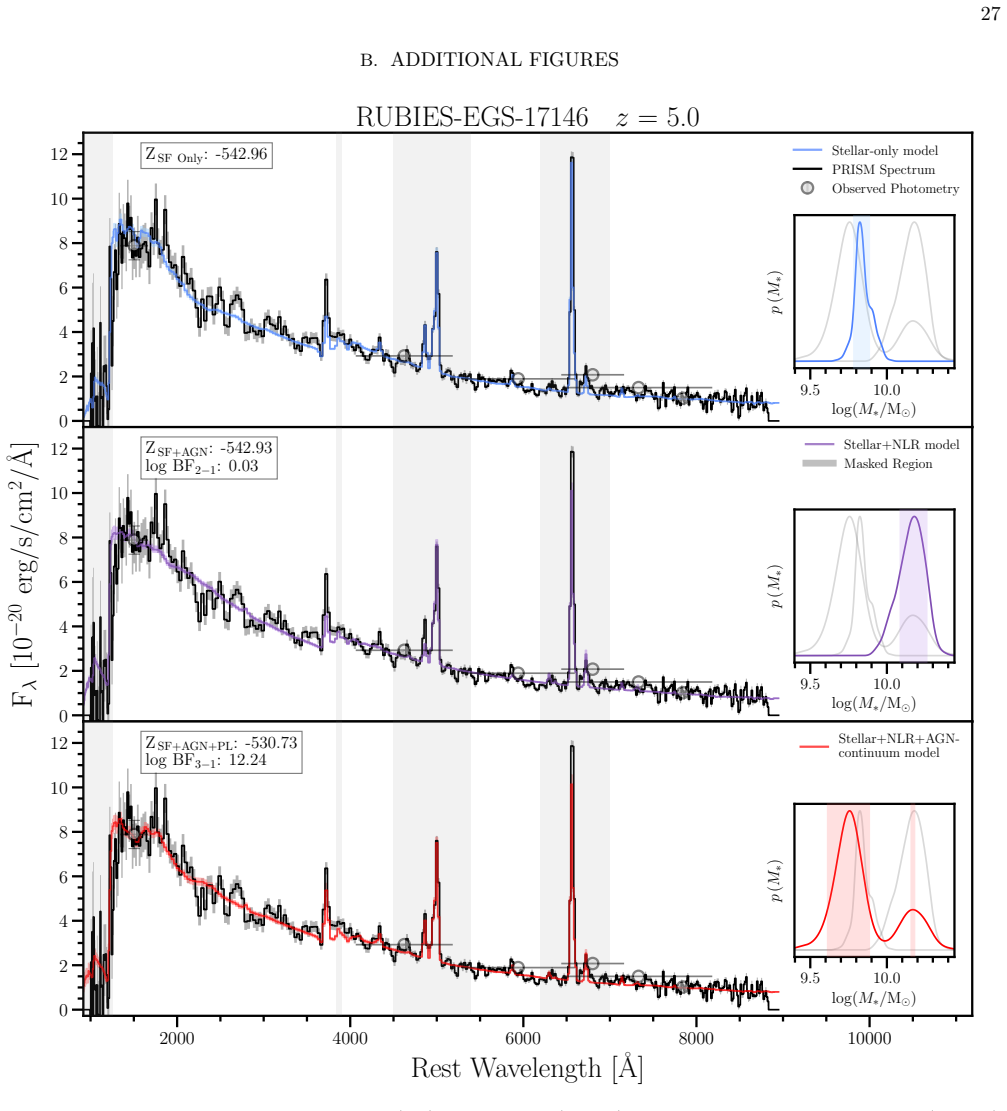
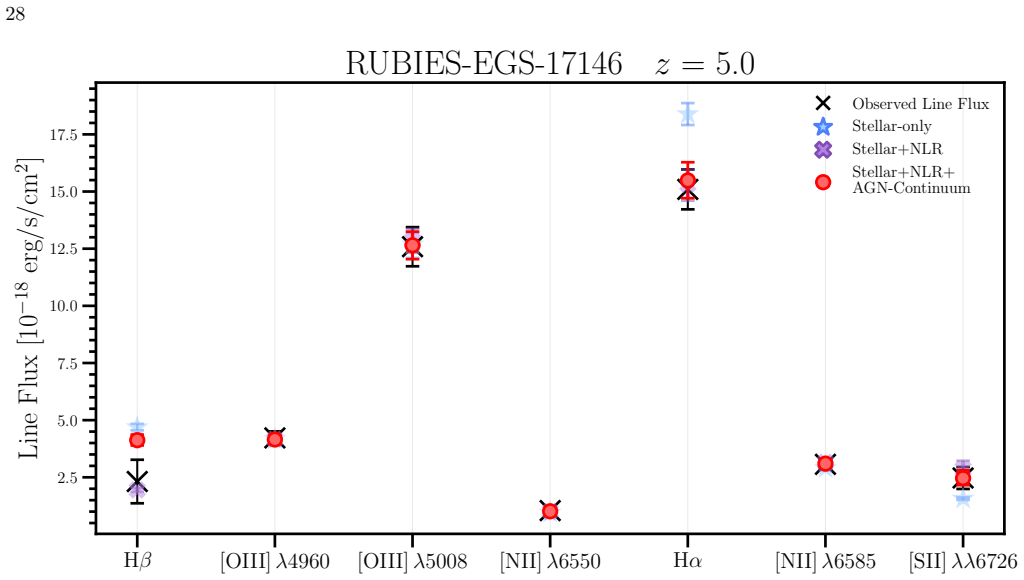
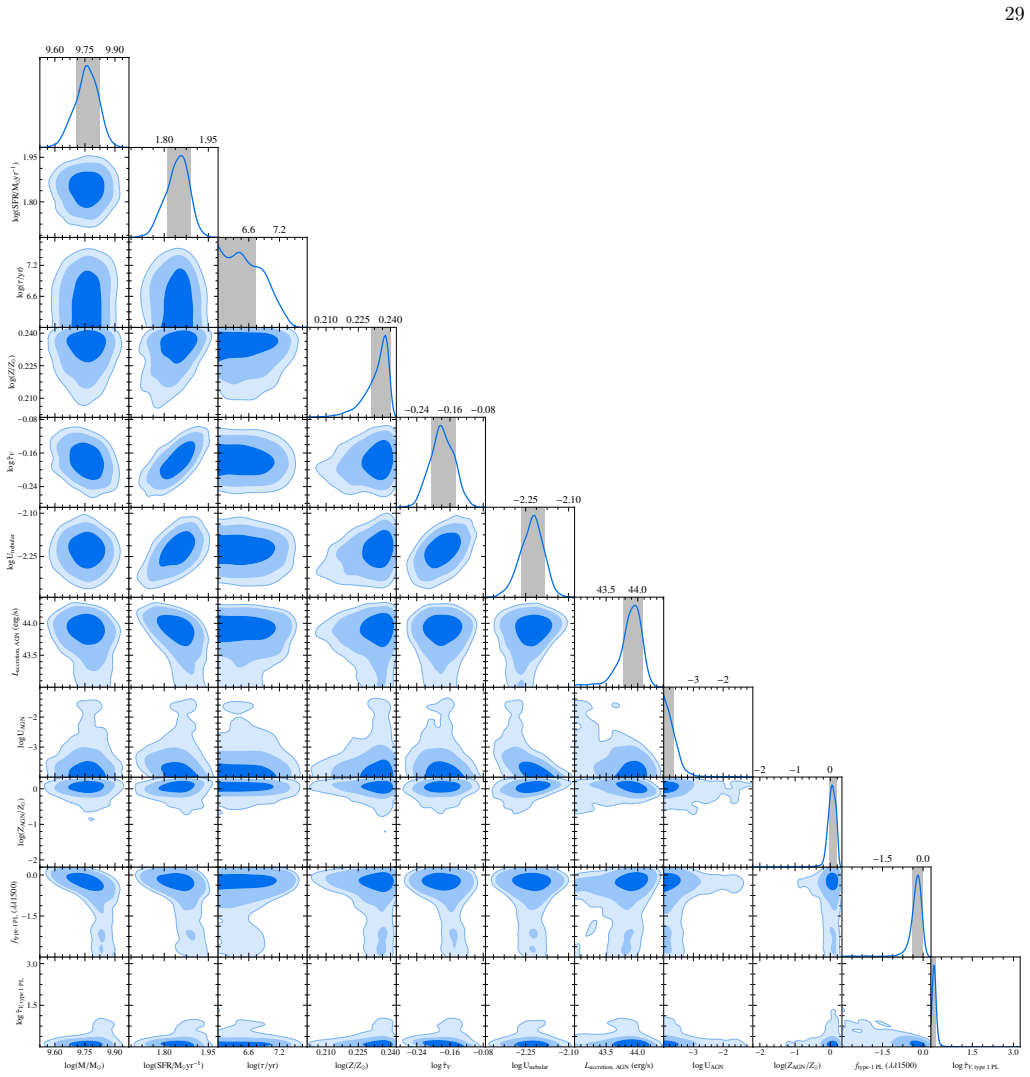
Applying BEAGLE-AGN SED fitting to NIRSpec/PRISM spectra of 39 galaxies at z ~ 3.5-7 selected as broad-line AGN, with kinematic decompositions from NIRSpec/G395M, reveals that non-LRD AGN at z < 3.5 are consistent with the local Mbh/M* relation while those at z > 4.5 display elevated ratios. This transition is driven entirely by changes in M* rather than an evolving Mbh distribution, consistent with models of rapid BH growth at early times followed by swift late-time assembly of host galaxies.
What carries the argument
BEAGLE-AGN SED fitting tool applied after kinematic decomposition of NIRSpec/G395M spectra to separate AGN and host contributions and estimate stellar masses for non-LRD AGN.
If this is right
- Rapid black hole growth produces elevated Mbh/M* ratios at early times.
- Swift late-time assembly of host galaxies returns sources to the local relation at z<4.
- The transition happens over just ~500 Myr and is caused by changes in M* alone.
- Little red dots cannot be modeled reliably with the current BEAGLE-AGN setup, so the trend applies only to non-LRD AGN.
Where Pith is reading between the lines
- If the M* estimates hold, black hole growth must outpace galaxy growth in the first billion years after the Big Bang.
- Larger samples at z~3-5 could test whether the drop in ratio is smooth or tied to specific AGN properties.
- Checking the same objects with SED models that omit AGN narrow-line components would confirm the modest impact on M* reported here.
Load-bearing premise
BEAGLE-AGN models combined with the kinematic decompositions produce unbiased stellar mass estimates for non-LRD AGN, so the observed redshift transition is not produced by systematic modeling errors.
What would settle it
Re-fitting the same sources with an independent SED code that yields substantially higher stellar masses for the z>4.5 non-LRD AGN, enough to bring their Mbh/M* ratios in line with the local relation, would remove the claimed transition.
Figures
read the original abstract
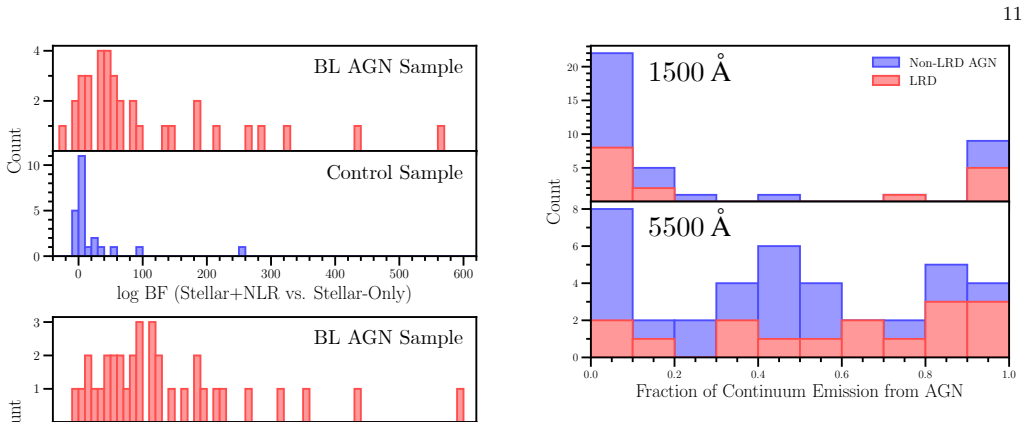
Spectroscopic observations from JWST have uncovered a plethora of active galactic nuclei (AGN) at z > 4 with black hole (BH) mass (Mbh) to stellar mass (M*) ratios significantly above the local relation when using standard virial mass scaling relations. However, M* estimates of AGN may be inaccurate due to limitations in spectral energy distribution (SED) fitting codes, exemplified by a lack of physically-motivated AGN line emission models. Here, we fit NIRSpec/PRISM spectra of 39 galaxies at z ~ 3.5-7 selected as broad-line AGN from the CEERS and RUBIES surveys. Applying kinematic decompositions from NIRSpec/G395M spectra, we fit their continuum and narrow-component line fluxes using the BEAGLE-AGN SED fitting tool. While limitations of BEAGLE-AGN make it difficult to model little red dots (LRDs), we find that M* estimates of non-LRDs are, surprisingly, only modestly impacted by the inclusion or not of AGN narrow-line region (NLR) and continuum emission model components. We further find that non-LRD AGN at z < 3.5 are consistent with the local Mbh/M* relation while those at z > 4.5 display elevated ratios. While we cannot rule out observational biases or systematic uncertainties as partial causes, this transition over just ~500 Myr is driven entirely by changes in M* rather than an evolving Mbh distribution. These findings are consistent with models in which rapid BH growth results in elevated Mbh/M* ratios at early times, with a swift late-time assembly of host galaxies returning sources to the local relation at z < 4.
Editorial analysis
A structured set of objections, weighed in public.
Referee Report
Summary. The manuscript analyzes NIRSpec/PRISM spectra of 39 broad-line AGN at z~3.5-7 from CEERS and RUBIES, applying kinematic decompositions from G395M data and BEAGLE-AGN SED fitting to derive M* estimates. It reports that non-LRD AGN at z<3.5 are consistent with the local Mbh/M* relation while those at z>4.5 show elevated ratios, with the transition over ~500 Myr driven entirely by rising M* at fixed Mbh rather than changes in the Mbh distribution; the paper notes modeling limitations for LRDs but finds modest impact from AGN components on non-LRD M* estimates.
Significance. If the M* estimates prove robust against systematics, the result would indicate rapid early BH growth followed by swift host-galaxy assembly, providing a key observational constraint on models of BH-host co-evolution at high redshift. The direct spectro-photometric fitting approach and explicit test of AGN-component inclusion are strengths that allow falsifiable comparison to local relations.
major comments (2)
- [Abstract and SED-fitting results section] Abstract and the section describing the BEAGLE-AGN fits: the claim that the redshift transition is 'driven entirely by changes in M* rather than an evolving Mbh distribution' rests on the assumption that Mbh values (from virial relations) are unbiased and that the sample selection does not preferentially include lower-M* hosts at lower z; however, no explicit comparison of the Mbh distribution across redshift bins or test of the CEERS/RUBIES selection function is provided to support this.
- [SED-fitting results section] The section on the with/without AGN-component test: showing that NLR/continuum inclusion changes M* only modestly for non-LRDs does not address whether the G395M kinematic decomposition itself varies systematically with redshift (due to S/N, line-profile differences) or whether residual AGN light in the PRISM continuum scales with z, both of which are load-bearing for concluding that the observed drop in Mbh/M* is produced by rising M* at fixed Mbh.
minor comments (2)
- [Abstract] The abstract states 'we cannot rule out observational biases or systematic uncertainties as partial causes' but does not quantify the size of possible biases; adding a brief estimate or upper limit in the discussion would strengthen the presentation.
- [Throughout] Notation for the local Mbh/M* relation and the high-z comparison sample should be defined consistently in the text and figures to avoid ambiguity when stating 'consistent with the local relation'.
Simulated Author's Rebuttal
We thank the referee for the constructive report and positive assessment of the work's potential significance. The comments identify important points regarding the robustness of our interpretation of the Mbh/M* evolution. We address each major comment below and will revise the manuscript accordingly where feasible.
read point-by-point responses
-
Referee: [Abstract and SED-fitting results section] Abstract and the section describing the BEAGLE-AGN fits: the claim that the redshift transition is 'driven entirely by changes in M* rather than an evolving Mbh distribution' rests on the assumption that Mbh values (from virial relations) are unbiased and that the sample selection does not preferentially include lower-M* hosts at lower z; however, no explicit comparison of the Mbh distribution across redshift bins or test of the CEERS/RUBIES selection function is provided to support this.
Authors: We agree that an explicit comparison of the Mbh distributions would strengthen the manuscript. In the revised version we will add a supplementary figure showing the Mbh histograms for the z < 3.5 and z > 4.5 non-LRD subsamples; these distributions overlap substantially with no statistically significant shift, supporting that the change in Mbh/M* ratio is driven by M* rather than Mbh evolution. A full forward-modeling of the CEERS/RUBIES selection function lies beyond the scope of the current analysis given the heterogeneous survey depths and targeting strategies; however, we will expand the discussion section to quantify the uniform broad-line selection criteria applied across redshift and to note the acknowledged possibility of residual selection biases. revision: partial
-
Referee: [SED-fitting results section] The section on the with/without AGN-component test: showing that NLR/continuum inclusion changes M* only modestly for non-LRDs does not address whether the G395M kinematic decomposition itself varies systematically with redshift (due to S/N, line-profile differences) or whether residual AGN light in the PRISM continuum scales with z, both of which are load-bearing for concluding that the observed drop in Mbh/M* is produced by rising M* at fixed Mbh.
Authors: We concur that redshift-dependent systematics in the kinematic decomposition and residual continuum must be explicitly tested. In the revision we will add a new subsection (or supplementary material) that plots the G395M-derived line widths, velocity dispersions, and S/N ratios against redshift for the non-LRD sample, demonstrating the absence of systematic trends within the observed range. We will also perform additional BEAGLE-AGN runs with varying levels of residual AGN continuum to quantify any redshift scaling and its effect on the derived M* values. These tests will be presented to support the conclusion that M* evolution dominates the observed trend. revision: yes
Circularity Check
No circularity; results from direct JWST spectro-photometric fitting
full rationale
The derivation obtains Mbh from standard virial relations and M* from BEAGLE-AGN fits to NIRSpec/PRISM + G395M data for the CEERS/RUBIES sample. No equation reduces a claimed prediction to a fitted input by construction, no load-bearing premise rests on self-citation, and no ansatz or uniqueness claim is smuggled in. The redshift transition is reported as an empirical outcome of the fits, with explicit caveats on possible systematics.
Axiom & Free-Parameter Ledger
axioms (1)
- domain assumption BEAGLE-AGN models accurately capture AGN narrow-line region and continuum contributions for non-LRD sources without introducing large biases in M*.
Forward citations
Cited by 1 Pith paper
-
General Relativistic Shock Wave Solutions with Black Hole Formation: The Singular Isothermal Sphere Case
Derives GR jump conditions and self-similar shock solutions for SIS collapse to BH, showing shocks up to 0.4c, accretion suppressed by factor 5-7, and shock energy release ~10% of enclosed rest mass.
Reference graph
Works this paper leans on
-
[1]
Abdurro’uf, Larson, R. L., Coe, D., et al. 2024, The Astrophysical Journal, 973, 47, doi: 10.3847/1538-4357/ad6001 Abuter, R., Allouche, F., Amorim, A., et al. 2024, Nature, 627, 281, doi: 10.1038/s41586-024-07053-4 20 Akins, H. B., Casey, C. M., Lambrides, E., et al. 2025a, The Astrophysical Journal, 991, doi: 10.3847/1538-4357/ade984 Akins, H. B., Casey...
work page internal anchor Pith review Pith/arXiv arXiv doi:10.3847/1538-4357/ad6001 2024
-
[2]
https://ui.adsabs.harvard.edu/abs/1973A&A....24..337S Shapley, A. E., Sanders, R. L., Topping, M. W., et al. 2025, The Astrophysical Journal, 980, arXiv:2407.00157, doi: 10.3847/1538-4357/adad68 Silcock, M. S., Curtis-Lake, E., Smith, D. J. B., et al. 2025, Monthly Notices of the Royal Astronomical Society, 541, doi: 10.1093/mnras/staf1087 Silverman, J. D...
-
[4]
Source information for the literature BL AGN sample. Source ID R.A. Decl.zlog(M BH/M⊙) log(M ∗/M⊙) LRD Reference COS-6696 150.125824 2.389711 7.037 7.28 +0.27 −0.20 8.49+0.18 −0.17 1 (1) RUBIES-37427 34.504940 -5.257980 6.958 7.42 +0.04 −0.05 8.50+0.20 −0.10 0 (2) JADES-167639 53.091880 -27.880700 5.555 7.70 +0.04 −0.05 8.28+0.04 −0.04 0 (2) CAPERS-52661 ...
discussion (0)
Sign in with ORCID, Apple, or X to comment. Anyone can read and Pith papers without signing in.