REVIEW 4 major objections 4 minor 1 cited by
Beyond the Fundamental Metallicity Relation: galaxy sizes encode the link between inflow and metallicity
T0 review · 4 major / 4 minor · reviewed 2026-08-02 · deepseek-v4-flash
Pith's one-line read Mass–metallicity scatter is set by the gas inside a galaxy's optical radius, with size as a close proxy.
desk verdict A genuinely integrated analysis of the gas-reservoir view of the MZR, but the central ranking rests on a constructed variable that inherits size and SFR signals; worth refereeing with that concern front and center. read the letter →
The pith
A machine-rendered reading of the paper's core claim, the machinery that carries it, and where it could break.
The reading
What carries the argument
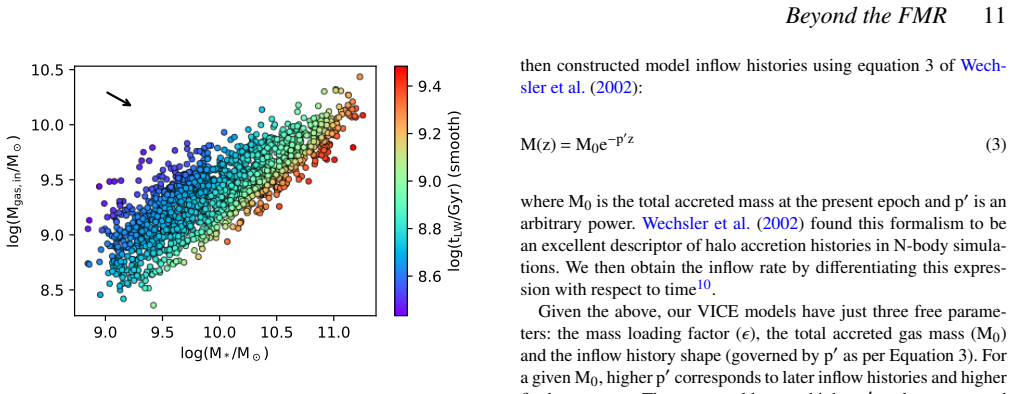
The central object is the inner gas mass, M_gas,in: the atomic hydrogen within the 90% light radius (estimated by integrating a universal HI profile scaled to the galaxy's HI size via the empirical HI mass–size relation) plus the molecular gas mass inferred from the specific star-formation rate through a published scaling relation. The argument rests on this one constructed quantity outranking size, star-formation rate, total gas mass, stellar age, and the concentration parameter Phi_e in both Spearman-based projections and random-forest importance, and on the near-degeneracy between M_gas,in and optical size. Supporting machinery: one-zone chemical evolution models in which the inflow rate
What would settle it
Measure molecular gas masses directly from CO emission for the same galaxies, with resolved neutral-hydrogen maps that give the inner atomic gas mass without any scaling from optical size, and re-run the ranking. If star-formation rate or optical size regains the top predictive slot once the molecular estimate is decoupled from sSFR — or if the direct inner gas mass loses its lead — the paper's central hierarchy collapses.
Extended reading notes
Core claim
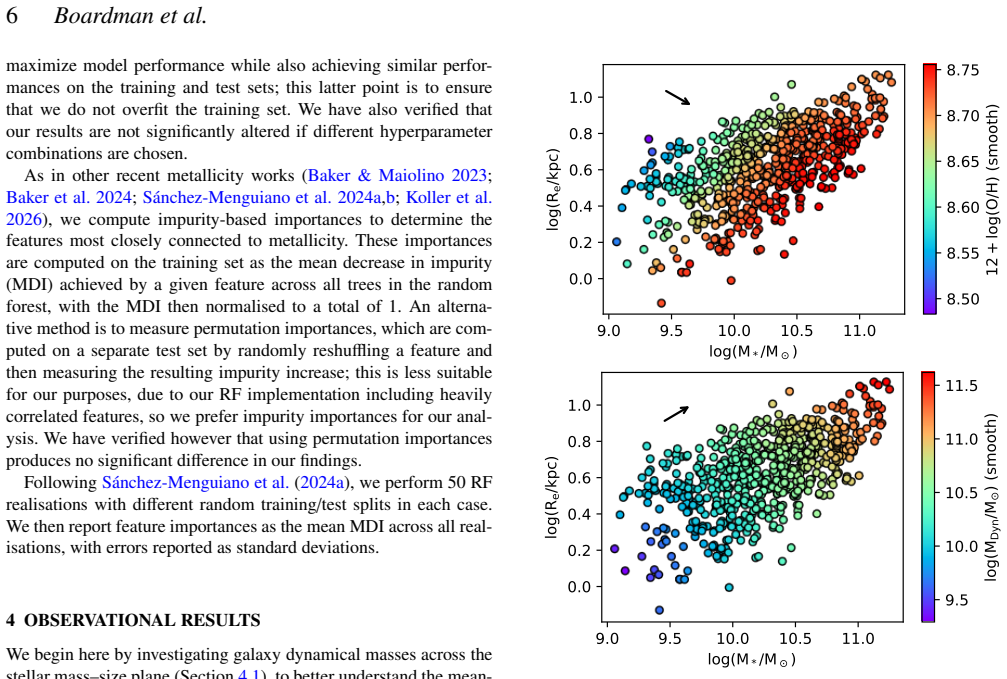
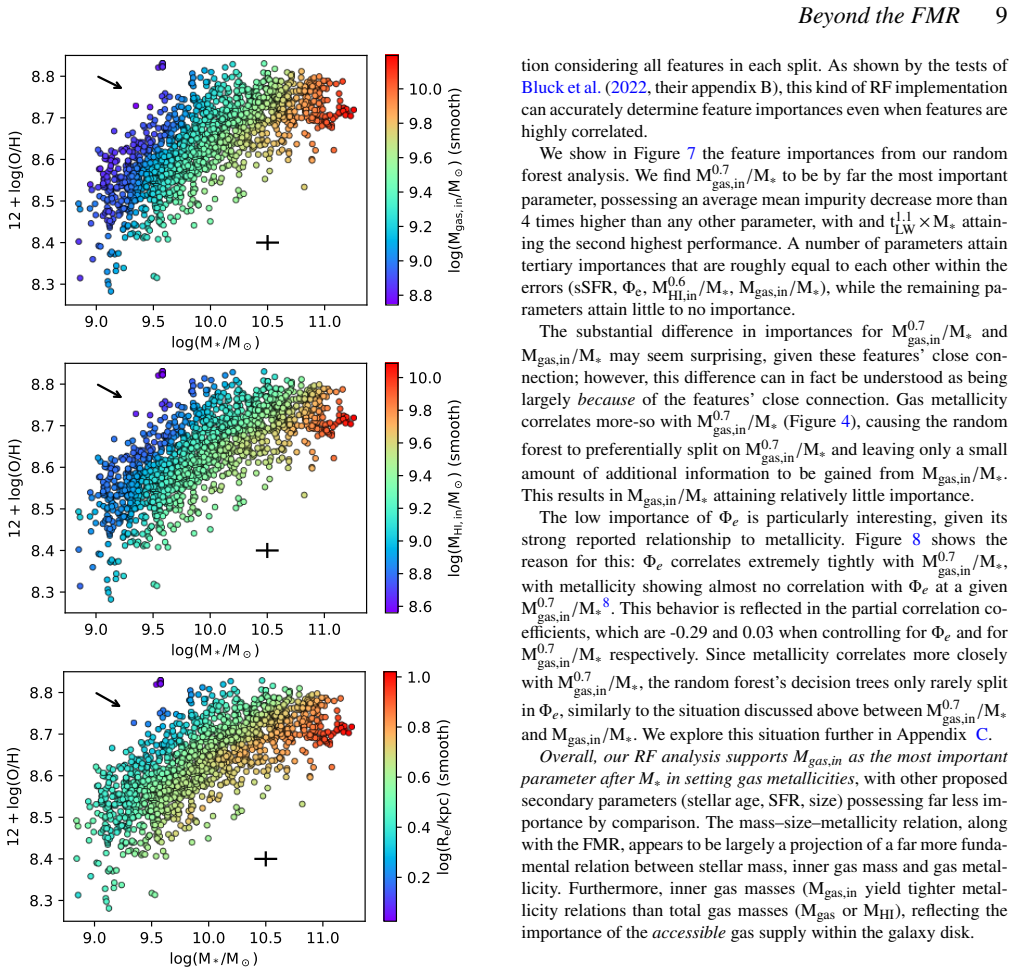
At fixed stellar mass, gas-phase metallicity correlates most tightly with the total gas mass inside the optical radius (atomic hydrogen within the 90% light radius plus molecular gas), more tightly than with star-formation rate, total gas mass, half-light radius, or the concentration parameter Phi_e = M*/R_e. The same ranking holds for nitrogen-to-oxygen ratio and for stellar metallicity, indicating that inner gas mass tracks long-term chemical evolution, not just a snapshot. Because inner HI mass correlates almost one-to-one with galaxy size, the paper concludes that the size–metallicity relation is a projection of the stellar mass–inner gas mass–metallicity relation, and that short-timesca
Load-bearing premise
The results depend on the estimated inner gas masses being physically accurate, but these estimates are built partly from galaxy size (the universal HI profile scaled by the HI size–mass relation) and partly from star-formation rate (molecular gas from sSFR), so the very parameters the paper demotes are baked into its favored predictor.
Editorial extensions
If this is right
- The 'fundamental' metallicity relation should be regarded as a lower-dimensional projection; SFR is a comparatively weak secondary tracer of MZR scatter once inner gas mass is included.
- Published size–metallicity correlations — including the tight Phi_e–metallicity relation — should be re-read as gas-reservoir effects, with Phi_e relabelled as stellar concentration rather than potential depth.
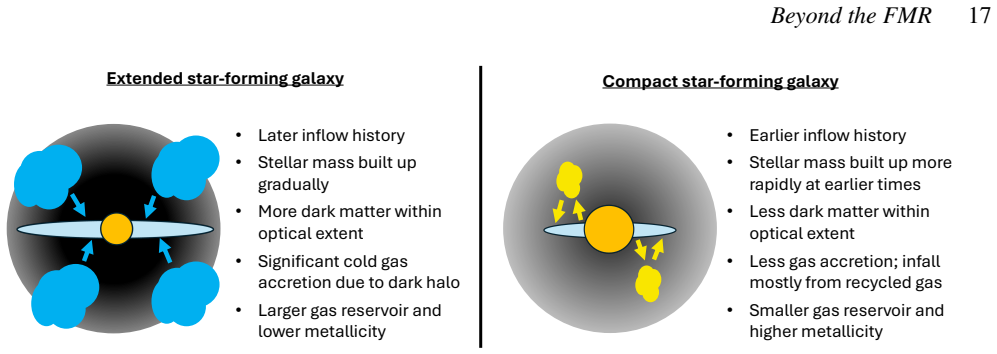
- MZR scatter is set on long (about a gigayear or more) timescales: compact galaxies assembled earlier and are now draining their gas reservoirs, so present-day gas mass and metallicity are coupled through the inflow history, not through short bursts.
- Simulations face new quantitative targets: reproducing the run of dark-matter mass within one effective radius across the mass–size plane and the tight stellar mass–inner gas mass–metallicity relation.
Reading between the lines
- Because molecular gas is estimated from sSFR, M_gas,in inherits SFR information by construction; a direct CO-survey test that breaks this degeneracy would tell whether the SFR-dependence is genuinely subdominant.
- If the scenario holds, high-redshift (z~1) HI stacking should show that compact galaxies' gas reservoirs decline faster over time than extended galaxies', a prediction testable with current and upcoming radio facilities.
- The same logic suggests that at fixed M_gas,in and stellar mass, residual metallicity variations should correlate with proxies of inflow metallicity (e.g., recycled versus pristine gas fraction), linking this work to semi-analytic expectations about enriched inflows.
- One could extend the analysis to resolved scales: within galaxies, if the same causal chain operates, metallicity gradients should be governed by local gas surface density rather than local stellar density.
Editorial analysis
A structured set of objections, weighed in public.
Referee Report
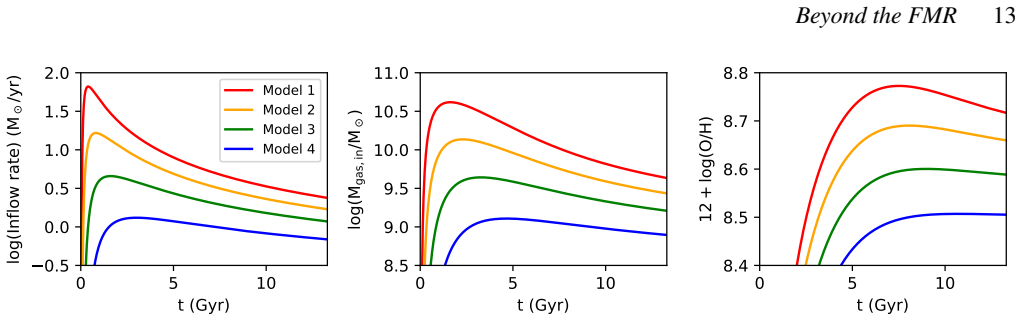
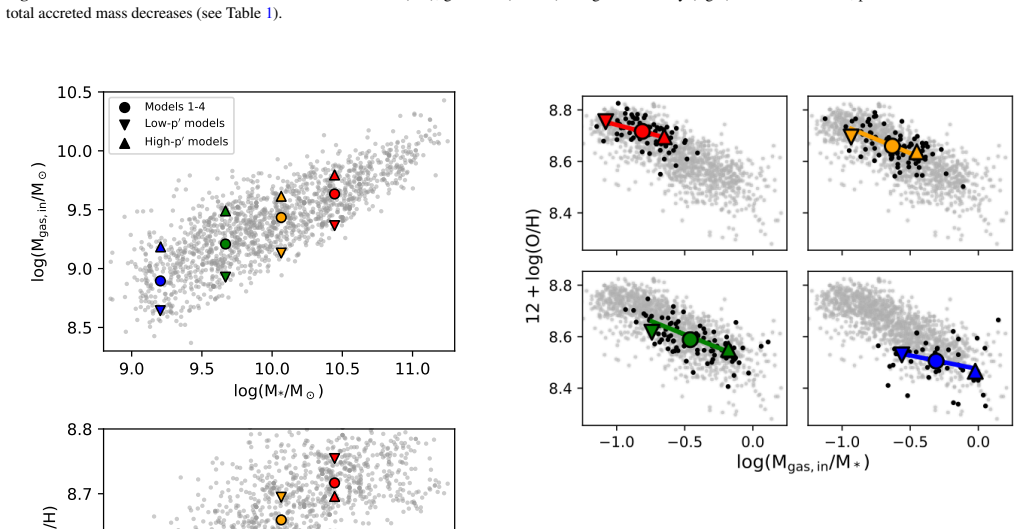
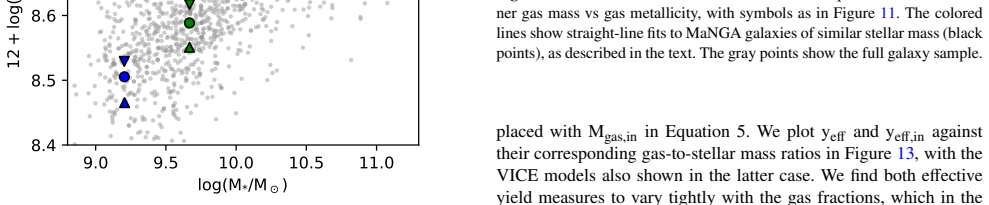
Summary. The paper combines MaNGA optical spectroscopy, HI-MaNGA gas masses, and DynPop dynamical masses for ~1500 star-forming galaxies to identify the galaxy property, after stellar mass, that most fundamentally drives scatter in the mass–metallicity relation (MZR). Using partial Spearman correlations and random forest regression, the authors report that the mass of gas within the optical radius (M_gas,in = M_HI,in + M_mol) is the most important secondary parameter, outranking star-formation rate, half-light radius R_e, and global gas mass. They further show that more compact galaxies have lower dynamical masses at fixed M*, challenging the gravitational-potential interpretation of Phi_e = M*/R_e, and that M_HI,in correlates tightly with R_e. One-zone VICE chemical evolution models with different inflow histories (varying the Wechsler et al. 2002 exponent p') are used to argue that earlier inflow histories produce lower present-day gas masses and higher metallicities, linking galaxy size to long-term inflow history. The central claim is that the size–metallicity relation and the FMR are projections of a more fundamental M*–M_gas,in–metallicity relation.
Significance. If the central claim holds, the paper would unify two previously separate literatures—the FMR/gas-reservoir view and the size–metallicity/Phi_e view—under a single driver (inner gas mass), and would re-interpret Phi_e as stellar concentration rather than potential depth. This is a substantial and interesting claim with consequences for how MZR scatter is interpreted in observations and simulations. The paper has notable strengths: it uses a large MaNGA/HI-matched sample, includes multiple chemical abundance tracers (O/H, N/O, stellar metallicity), checks alternate metallicity calibrators, makes analysis code publicly available, and includes explicit caveats about the constructed nature of M_mol and M_HI,in. The VICE modeling is a useful illustration, though not a rigorous quantitative fit. However, the central ranking of M_gas,in rests on variables that are partly constructed from the very quantities (size and SFR) it claims to supersede, and the feature-selection procedure (optimizing the exponent p on the same data) introduces additional bias. These issues must be addressed before the primary interpretation can be accepted.
major comments (4)
- [Sec. 2.1.2, 2.2, 4.3.4] The central claim that M_gas,in is the most fundamental secondary driver of metallicity is not yet established because M_gas,in is a constructed variable. M_HI,in is obtained by integrating a universal HI profile scaled by the Wang et al. (2020) HI mass–size relation within R90, making it a deterministic function of M_HI and R90, while M_mol is estimated from sSFR via the XCOLD GASS relation, making M_gas,in a function of M*, SFR, R90, and M_HI. The paper acknowledges the size connection (Sec. 4.2) and the SFR dependence of M_mol (footnote 7), but does not quantify how much of the correlation advantage of M_gas,in is inherited from these construction paths. A synthetic control—for example, a variable built as a weighted combination of R_e and SFR alone, or a version of M_gas,in using measured CO gas instead of the sSFR-derived M_mol—is needed to show the ranking is not an artifact.
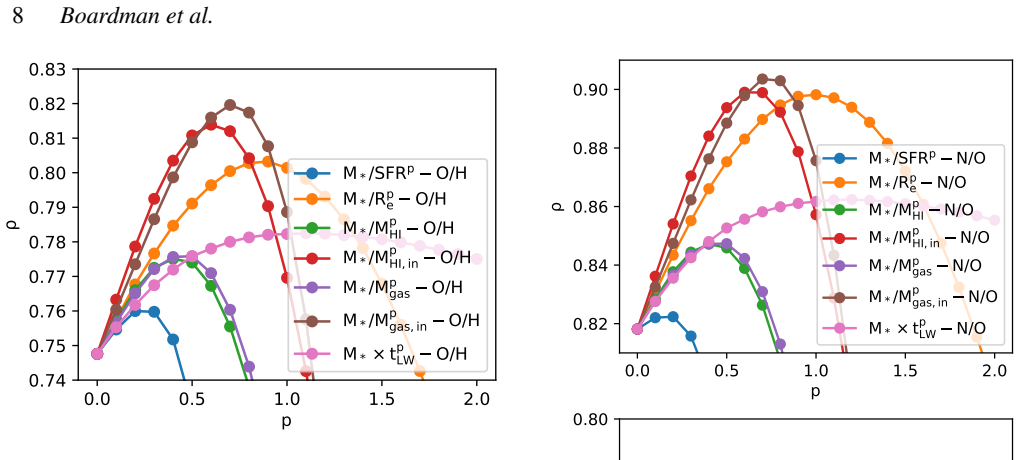
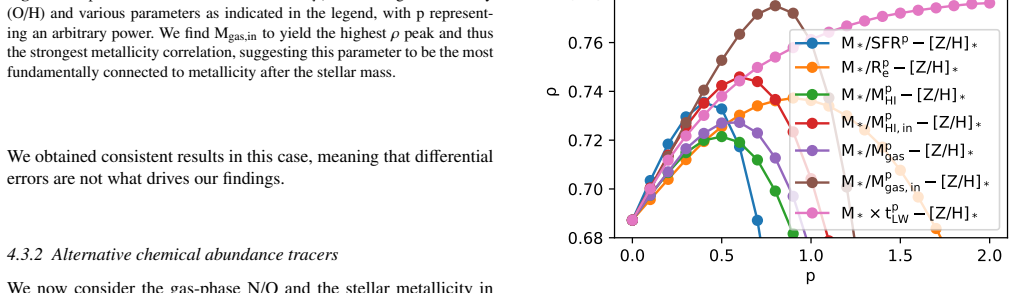
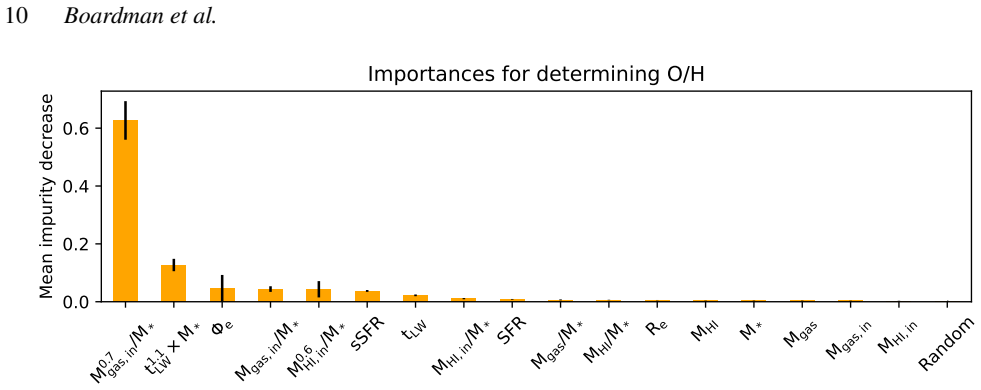
- [Fig. 4, Sec. 4.3.1] The exponent p in M*/X^p is optimized on the same dataset and then the best projection (M^0.7_gas,in/M*) is fed into the random forest as a feature. This is a form of target-dependent feature selection that inflates the apparent importance of the selected feature relative to features that were not optimized (e.g., R_e alone, SFR alone). The paper reports similar train/test RMSE, which guards against overfitting in the predictive sense, but MDI-based feature importance in the presence of correlated features is known to be sensitive to such selection. A nested cross-validation, where p is chosen on the training fold only, would be a straightforward fix. As written, the margin between M^0.7_gas,in/M* and the other features in Fig. 7 cannot be taken at face value.
- [Sec. 4.3.1, Fig. 4] The paper argues that SFR is the weakest secondary parameter and therefore the SFR dependence of M_mol cannot explain the top ranking of M_gas,in. This is not a valid rebuttal: a composite variable can inherit a weaker signal from SFR and a stronger signal from R_e (via M_HI,in) and still outrank each individual variable. The relevant comparison is between M_HI,in and R_e, since M_HI,in is the component that does not directly include SFR. The difference between M_HI,in (rho=0.814 at p=0.6) and R_e (rho~0.78 at p=0.9) is modest, and given that M_HI,in is constructed from R90 (which correlates with R_e at rho=0.95), the paper should demonstrate that this difference is not simply inherited from the construction path. A residual analysis or a partial correlation of O/H with M_HI,in after controlling for R_e and M*—rather than the current RF importance, which is confounded by the optimized fe
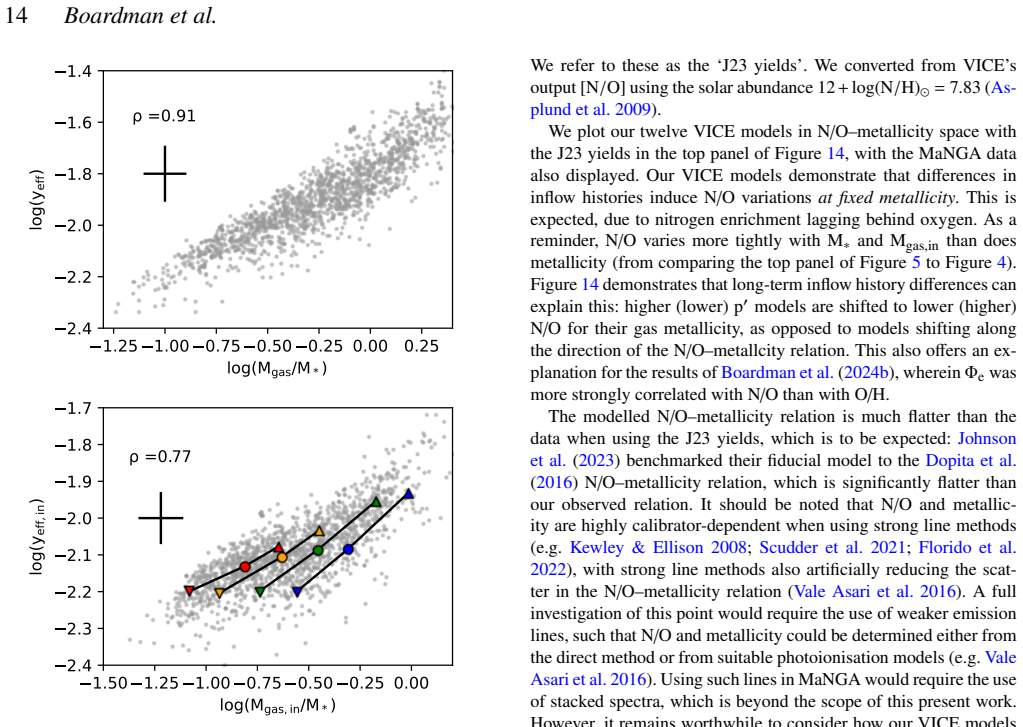
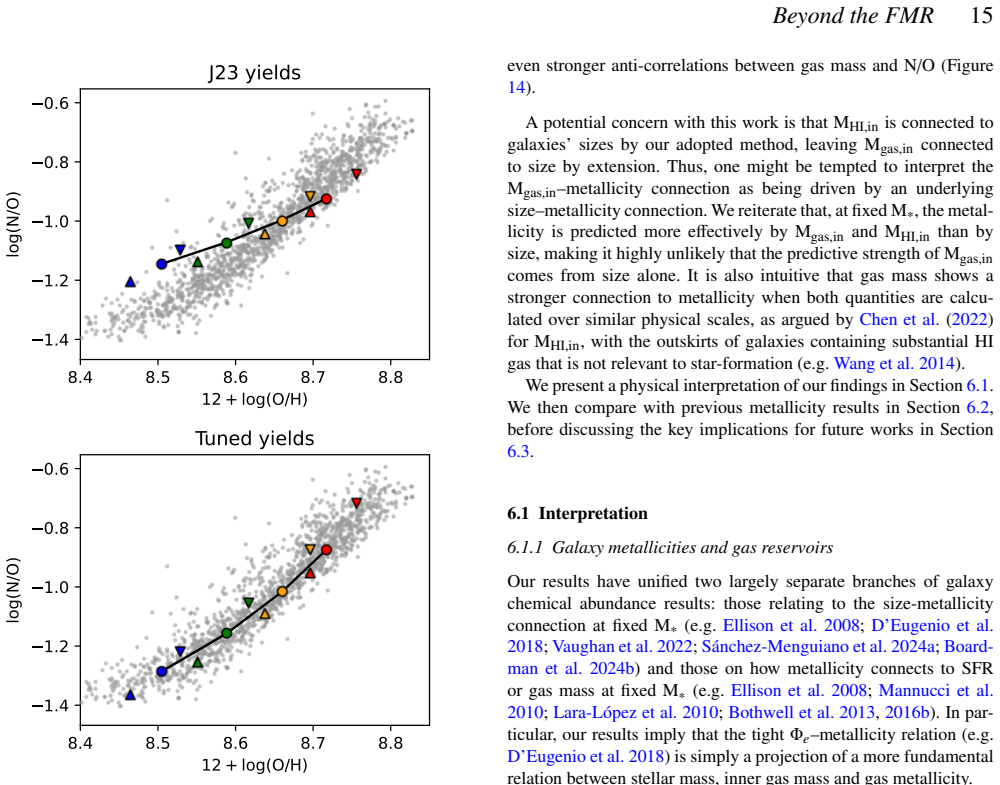
- [Sec. 5, Table 2] The VICE models are used to argue that differences in long-term inflow histories can explain the observed M_gas,in–O/H anti-correlation. The models are only qualitatively consistent with the data, and the paper itself notes that intermediate-mass models under-predict the observed slope and that an additional explanation is needed for high-mass galaxies. This is acceptable for an illustrative model, but the abstract's phrasing ('galaxy sizes encode the link between inflow and metallicity') is stronger than what the models demonstrate. I would recommend softening the interpretive claim or adding a more quantitative assessment, such as fitting the inflow-history parameters directly to the observed M_gas,in–O/H relation rather than tuning them by eye.
minor comments (4)
- [Sec. 4.3.1] Typo: 'correaltion' should be 'correlation' in the bullet point about stellar age.
- [Sec. 2.1.2] The extraction of the average HI profile from a published figure using a web plot digitiser is a potential source of systematic error. Please state the sensitivity of the M_HI,in results to the assumed profile shape, or at least cite the original data source more directly.
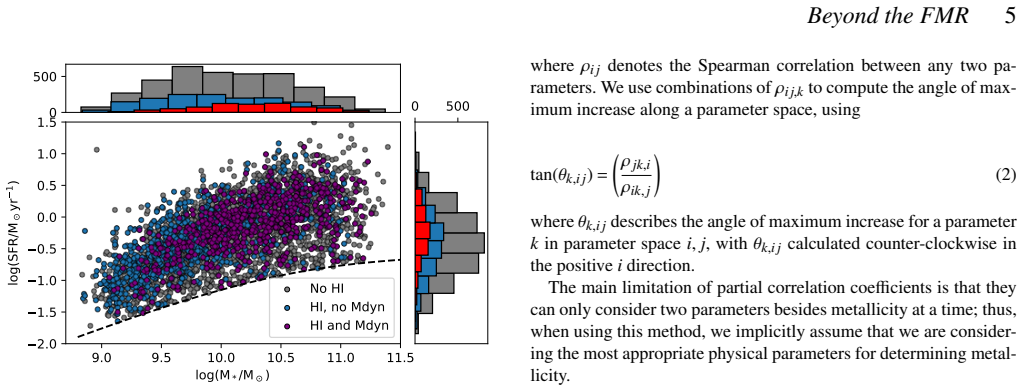
- [Fig. 1] The histogram legend in Fig. 1 refers to 'blue bars' and 'red bars', but the main sample is shown with blue points and the M_Dyn subsample with purple points. Clarify the color coding for clarity.
- [Sec. 4.3.4] The RF implementation considers all features for each split, which is unusual and may increase computation time but is acceptable. However, the paper states that permutation importances produce 'no significant difference' without showing the comparison; it would be helpful to include these results in an appendix or supplement.
Circularity Check
Constructed M_gas,in inherits the size and SFR signals it claims to supersede; RF uses a p-projection optimized on the same data.
-
fitted input called prediction
[Section 2.2; Section 4.3.2, footnote 7]
"We estimate molecular gas masses (M mol) for the galaxies in our sample by employing the tight relationship between specific star-formation rate (sSFR=SFR/M∗) and M mol/M∗ observed in the XCOLD GASS survey. [...] The relatively strong correlation with SFR in the case of stellar metallicity may artificially boost the measured correlation coefficient with M gas,in, due to the use of SFR to compute molecular gas mass. Therefore the actual correlation coefficient with M gas,in may in reality be closer to M HI,in."
M_gas,in is defined as M_HI,in + M_mol, and M_mol is a deterministic function of SFR and M*. Hence the correlation/importance of M_gas,in with O/H, N/O, and [Z/H]* is not an independent comparison against SFR: the SFR signal is embedded in the constructed 'inner gas mass'. The paper's footnote concedes the artificial boost for stellar metallicity; the same construction also enters the gas-metallicity and N/O rankings (Figures 4-5, 7). The claim that M_gas,in supersedes SFR is therefore partly forced by how M_mol was estimated.
-
self definitional
[Section 2.1.2; Section 4.2]
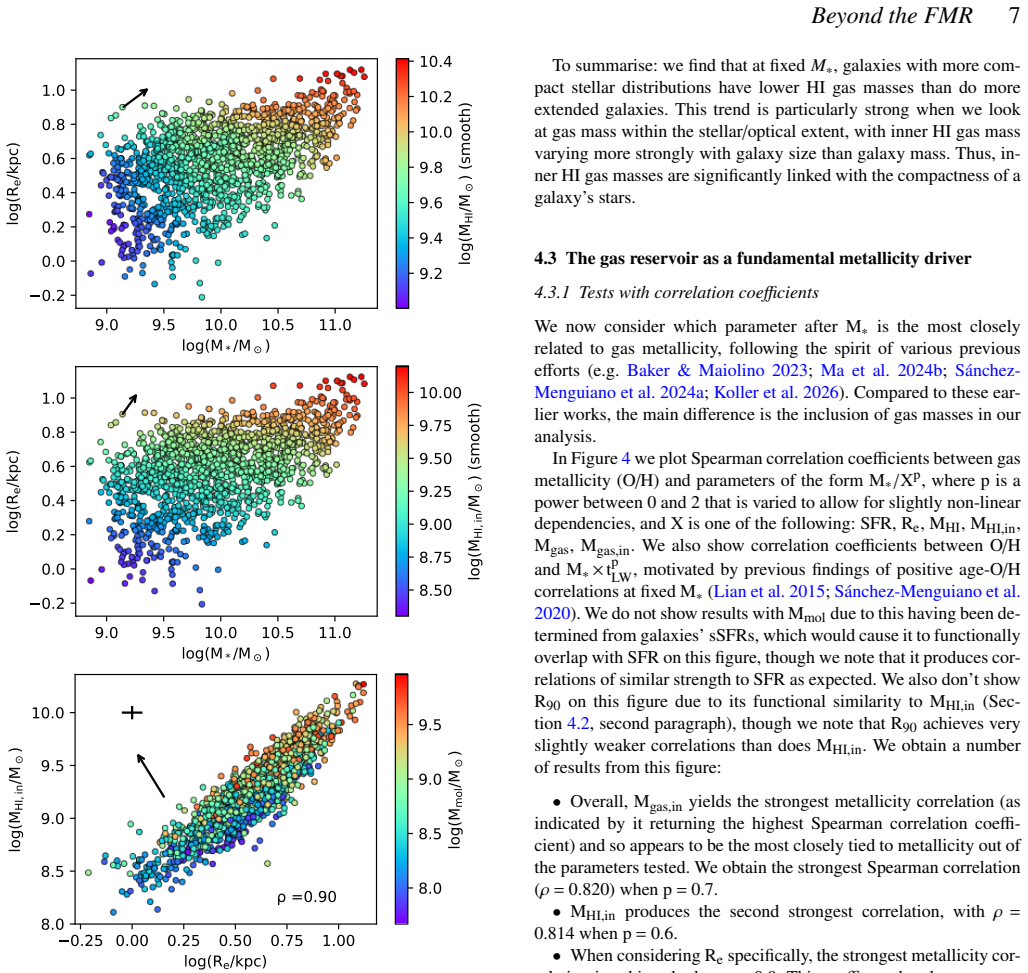
"This behavior is partly by construction: MHI,in is estimated within R90 and correlates tightly with it (ρ=0.96), with Re correlating tightly with R90 in turn (ρ=0.95)."
M_HI,in is defined by integrating a size-scaled universal HI profile inside the NSA R90, and R90 is nearly the same size measure as Re. The reported M_HI,in–Re correlation (ρ=0.90) is therefore substantially a consequence of the definition of M_HI,in, not an independent empirical discovery. The paper uses this correlation to argue that size is a close proxy for the gas reservoir and that short-timescale inflow fluctuations cannot drive MZR residuals, so the argument is partly circular; only the measured M_HI and the external profile normalization provide independent content.
1 more flagged steps
-
fitted input called prediction
[Section 4.3.4]
"We further include M0.7 gas,in/M∗ M0.6 HI,in/M∗ and t1.1 LW×M∗, which we determined in Figure 4 to be the optimal projections for predicting the metallicity with their respective parameter combinations."
The exponents p=0.7 (M_gas,in) and p=0.6 (M_HI,in) were selected by maximizing the Spearman correlation with O/H on the full sample, and the same optimized projections are then entered into the random forest whose importance ranking is presented as confirmation (Figure 7). The RF result is not an independent validation of the features; it partly echoes the Figure 4 p-scan. This is a data-selection circularity rather than a definitional one.
full rationale
The paper is transparent about its constructions and the central ranking is not a pure formal identity: M_HI is measured, and the Wang et al. (2020) profile and XCOLD GASS relation are external calibrations; the VICE modeling is also independent. However, the load-bearing comparison 'inner gas mass is the most important parameter after M*, beyond size and SFR' is partially built into the variables: M_HI,in is constructed from R90/Re and M_mol from SFR, and the RF features include projections optimized on the same target. These issues do not force the O/H result completely, but they materially weaken the claim that the size–metallicity relation and the FMR are projections of an independent M*–M_gas,in–metallicity relation. No load-bearing uniqueness theorem or self-citation chain is present; citations to Boardman et al. and Wang (2026) are supporting rather than definitional. Overall, partial circularity: score 5.
Assumptions & free parameters
free parameters (4)
- Exponent p in M*/X^p and M*×t^p projections =
p≈0.6–1.1 depending on X (e.g., 0.7 for M_gas,in, 0.6 for M_HI,in, 0.9 for R_e, 1.1 for t_LW)
- VICE inflow-history parameters (log M0, epsilon, p') =
log M0=10.09–11.20; epsilon=2.6–3.7; p'=0.20–0.74 plus high/low variants
- Gas consumption timescale t_c =
4.566 Gyr
- Tuned nitrogen yields (y_CC_N, xi, beta) =
3×10^-4, 1×10^-3, 2
assumptions (6)
- domain assumption HI radial surface density profiles are universal when scaled by HI disk size r_HI (Wang et al. 2016).
- domain assumption The Wang et al. (2020) HI mass–size relation applies to the MaNGA sample.
- domain assumption M_HI,in is set equal to M_HI when R90 > 1.5 r_HI.
- domain assumption Molecular gas mass is determined by the XCOLD GASS sSFR–M_mol/M* relation.
- domain assumption VICE one-zone models with pristine inflows, constant t_c, constant mass-loading, and no mergers adequately represent galaxy chemical evolution.
- domain assumption Inflow histories follow the Wechsler et al. (2002) exponential form M(z)=M0 exp(-p'z).
Cite this review
Pith. "Pith review of Beyond the Fundamental Metallicity Relation: galaxy sizes encode the link between inflow and metallicity." pith.science (2026). https://pith.science/paper/CV5A3B4A
@misc{pith2026260613124,
  author       = {Pith},
  title        = {Pith review of: Beyond the Fundamental Metallicity Relation: galaxy sizes encode the link between inflow and metallicity},
  year         = {2026},
  howpublished = {\url{https://pith.science/paper/CV5A3B4A}},
  note         = {Machine review of arXiv:2606.13124}
}
abstract
Gas-phase chemical abundances are key observable consequences of galaxy evolution, being intrinsically tied to galaxy formation histories. Gas metallicity rises with increasing stellar mass ($\mathrm{M_*}$), forming the well-known mass-metallicity relation (MZR). MZR residuals have separately been shown to anti-correlate with star-formation rate (the ``fundamental'' metallicity relation), with gas mass and with optical size, but no single analysis has considered all trends together. We thus perform a combined analysis of all three trends, utilizing optical MaNGA integral field spectroscopy, HI-MaNGA gas masses, and MaNGA DynPop dynamical masses. We estimate inner gas masses for $\sim$1500 star-forming galaxies, finding this to be the most important parameter after $\mathrm{M_*}$ in predicting gas metallicities. We obtain equivalent results for stellar metallicities and gaseous N/O, suggesting that current inner gas masses are intrinsically linked to long-term chemical evolution histories. We show that more compact galaxies have lower dynamical masses, challenging suggestions that deeper gravitational potentials confer higher metallicities. We find a strong correlation between inner gas mass and galaxy size, meaning that short term inflow fluctuations cannot be responsible for the MZR residuals. With chemical evolution models, we show that our results can instead be explained by differences in long-term inflow histories. The earlier inflow histories of compact galaxies lead to lower gas masses and more rapidly declining gas reservoirs at late times, leading to higher metallicities. At fixed stellar mass, galaxy size therefore encodes the link between halo assembly histories, long-term gas inflow histories, current gas reservoirs and metallicity.
Figures
Figures from the paper (12 more)
Forward citations
Cited by 1 Pith paper
-
Inflow-driven galaxy evolution - I. Revealing the physics of the fundamental metallicity relation
A minimal gas flow model shows that galaxy metallicity is a universal function of stellar mass divided by star formation rate, and that a gas-mass-based relation is more fundamental.
Reference graph
Works this paper leans on
-
[1]
H., Martini P., 2013, ApJ, 765, 140 Asplund M., Grevesse N., Sauval A
Abdurro’uf et al., 2022, ApJS, 259, 35 Andrews B. H., Martini P., 2013, ApJ, 765, 140 Asplund M., Grevesse N., Sauval A. J., Scott P., 2009, ARA&A, 47, 481 Ayromlou M., Kauffmann G., Yates R. M., Nelson D., White S. D. M., 2021, MNRAS, 505, 492 Baer M., 2018, findiffSoftware Package,https://github.com/maroba/ findiff Bait O., Barway S., Wadadekar Y ., 201...
arXiv 2022
-
[2]
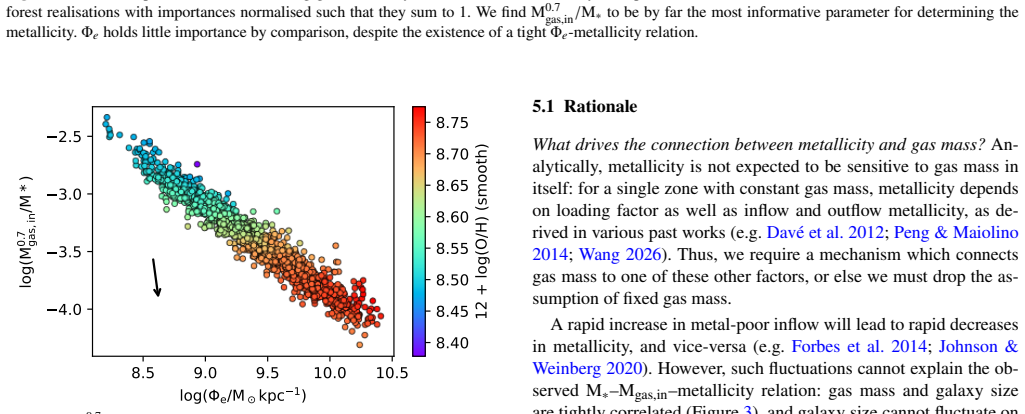
understood as being due toΦ e closely reflecting a galaxy’s posi- tion in M∗–Mgas,in parameter space (see Figure 8 in the main paper text), leading the random forest to highly weightΦ e at the expense of parameters that directly relate to the gas reservoir. That t1.1 LW×M∗ consistently achieves the second-highest importance suggests that this parameter ho...
2026
-
[6]
8.5 9.0 9.5 10.0 10.5 log( e/M kpc
MNRAS000, 1–22 (2026) 24Boardman et al. 8.5 9.0 9.5 10.0 10.5 log( e/M kpc
2026
-
[8]
Finally, we show in Figure B5 galaxies’ light-weighted stellar ages at 1 R e as a combined function of M∗ and Mgas,in, as in Figure 9 APPENDIX C: RANDOM FORESTS ANDΦ E Over the course of our article, we established a strong connec- tion between metallicity and M gas,in at any given stellar mass. Us- ing Spearman correlation coefficients, we then found the...
2026
-
[9]
We report importances as the means across 50 RF realisations, with errors reported as standard deviations
MNRAS000, 1–22 (2026) Beyond the FMR25 M 0.6 HI,in/M* t1.1 LW ×M* e Mgas,in/M* sSFR tLW MHI,in/M* SFR Mgas/M* MHI/M* Re MHI Mgas M* Mgas,in MHI,in Random 0.0 0.2 0.4 0.6Mean impurity decrease Importances for determining O/H Figure C1.Feature importances for determining gas metallicity from a second random forest analysis in which M0.7 gas,in/M∗ was exclud...
2026
Reviewed August 2, 2026 · model on record in the stance chip above.
Discussion (0). Sign in to comment.