Relative variation indexes for multivariate continuous distributions on [0,infty)^k and extensions
Pith reviewed 2026-05-25 17:43 UTC · model grok-4.3
The pith
Ratios of quadratic forms in the mean and covariance define indexes for departure from uncorrelated exponential distributions.
A machine-rendered reading of the paper's core claim, the machinery that carries it, and where it could break.
Core claim
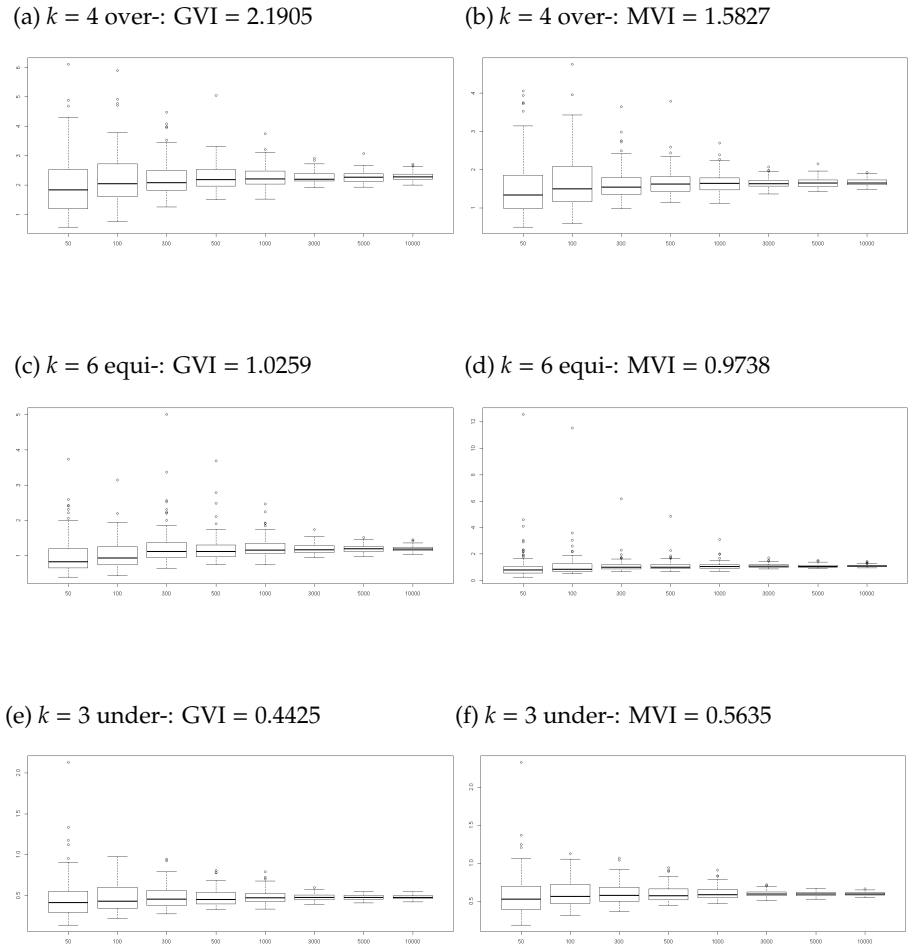
We introduce some new indexes to measure the departure of any multivariate continuous distribution on non-negative orthant from a given reference one such the uncorrelated exponential model, similar to the relative Fisher dispersion indexes of multivariate count models. The proposed multivariate variation indexes are scalar quantities, defined as ratios of two quadratic forms of the mean vector and the covariance matrix.
What carries the argument
The multivariate variation index, a scalar ratio of two quadratic forms of the mean vector and covariance matrix, that quantifies departure from the reference distribution.
If this is right
- These indexes discriminate between continuous positive distributions.
- Generalized and multiple marginal variation indexes with and without correlation structure are defined.
- Asymptotic behavior and other properties are studied.
- Numerical applications lead to appropriate choices of multivariate models.
Where Pith is reading between the lines
- The indexes might apply to model selection tasks involving positive multivariate data in reliability or environmental statistics.
- If first and second moments prove insufficient, versions incorporating higher moments could be developed as direct extensions.
- Similar ratio constructions might connect to other moment-based dispersion tools already used in multivariate analysis.
Load-bearing premise
The departure from the reference distribution can be adequately captured by these ratios of quadratic forms involving only first and second moments for the purpose of discriminating between distributions.
What would settle it
Two distributions sharing identical mean vector and covariance matrix but differing in higher moments receive the same index value while exhibiting visibly different departures from the uncorrelated exponential reference.
Figures
read the original abstract
We introduce some new indexes to measure the departure of any multivariate continuous distribution on non-negative orthant from a given reference one such the uncorrelated exponential model, similar to the relative Fisher dispersion indexes of multivariate count models. The proposed multivariate variation indexes are scalar quantities, defined as ratios of two quadratic forms of the mean vector and the covariance matrix. They can be used to discriminate between continuous positive distributions. Generalized and multiple marginal variation indexes with and without correlation structure, respectively, and their relative extensions are discussed. The asymptotic behavior and other properties are studied. Illustrative examples and numerical applications are analyzed under several scenarios, leading to appropriate choices of multivariate models. Some concluding remarks and possible extensions are made.
Editorial analysis
A structured set of objections, weighed in public.
Referee Report
Summary. The manuscript introduces scalar multivariate variation indexes (generalized, marginal, and relative) defined as ratios of quadratic forms in the mean vector and covariance matrix. These are intended to quantify departure from an uncorrelated exponential reference distribution for continuous multivariate distributions on [0,∞)^k, analogous to relative Fisher dispersion indexes for counts. The paper studies asymptotic behavior and properties, and provides illustrative numerical examples for model discrimination.
Significance. The moment-based construction supplies a simple, explicit scalar measure that can be computed directly from mean and covariance without parameter fitting. The asymptotic analysis and concrete numerical applications under several scenarios constitute a strength, offering a practical tool for comparing distributions that share first and second moments.
major comments (2)
- [Abstract and §1] Abstract and introduction: the claim that the indexes 'can be used to discriminate between continuous positive distributions' is not supported in general. Because every index is a ratio of quadratic forms involving only the mean vector and covariance matrix, the value is identical for any two distributions matching on first and second moments, irrespective of higher-moment or tail differences. This is load-bearing for the discrimination purpose stated in the abstract.
- [Definition of the indexes (presumably §2)] Definition of the indexes: the construction supplies no mechanism by which higher moments or tail behavior can affect the index values. Consequently the indexes cannot distinguish, e.g., a multivariate gamma from a multivariate lognormal that share the same mean and covariance, undermining the claim that they measure departure from the uncorrelated exponential reference in a manner useful for broad model selection.
minor comments (2)
- [Numerical examples] Numerical examples section: state explicitly whether the compared distributions differ only in mean/covariance or also in higher moments, so readers can assess the practical scope of the discrimination.
- [Notation and definitions] Notation for the quadratic forms: ensure the matrix expressions are written with consistent dimensions and that the reference exponential parameters are stated explicitly when the relative indexes are introduced.
Simulated Author's Rebuttal
We thank the referee for the careful reading and constructive comments. We agree that the indexes are defined solely in terms of the mean vector and covariance matrix, and we will revise the abstract and introduction to clarify the scope of their discriminatory power.
read point-by-point responses
-
Referee: [Abstract and §1] Abstract and introduction: the claim that the indexes 'can be used to discriminate between continuous positive distributions' is not supported in general. Because every index is a ratio of quadratic forms involving only the mean vector and covariance matrix, the value is identical for any two distributions matching on first and second moments, irrespective of higher-moment or tail differences. This is load-bearing for the discrimination purpose stated in the abstract.
Authors: We agree with the observation. The indexes are explicitly constructed as functions of the mean vector and covariance matrix only, so they necessarily return identical values for any distributions sharing the same first and second moments. Their utility for discrimination therefore applies to families of models that differ in these moments (as occurs in the numerical examples). We will revise the abstract and §1 to state that the indexes discriminate between continuous positive distributions on the basis of their mean and covariance structures relative to the uncorrelated exponential reference. revision: yes
-
Referee: [Definition of the indexes (presumably §2)] Definition of the indexes: the construction supplies no mechanism by which higher moments or tail behavior can affect the index values. Consequently the indexes cannot distinguish, e.g., a multivariate gamma from a multivariate lognormal that share the same mean and covariance, undermining the claim that they measure departure from the uncorrelated exponential reference in a manner useful for broad model selection.
Authors: The referee is correct that the construction contains no dependence on moments beyond the second order. This is intentional and mirrors the relative Fisher dispersion indexes for multivariate counts, which likewise rely only on mean and variance. In the paper the indexes are applied to compare models whose fitted means and covariances differ; we will add an explicit statement in §2 that the indexes quantify departure from the reference in terms of first- and second-moment structure and are therefore most useful when candidate models are distinguished by these moments. revision: yes
Circularity Check
No circularity: indexes introduced by explicit definition from moments
full rationale
The paper defines its variation indexes directly as ratios of quadratic forms in the mean vector and covariance matrix (see abstract and full text descriptions of generalized, marginal, and relative indexes). No derivation chain exists in which a claimed result or prediction is shown to equal its inputs by construction, no fitted parameters are relabeled as predictions, and no load-bearing self-citations or uniqueness theorems are invoked to justify the central construction. The proposal is self-contained as a definitional tool for comparing first- and second-moment behavior to a reference distribution.
Axiom & Free-Parameter Ledger
axioms (2)
- standard math Existence of mean vector and covariance matrix for the distributions
- domain assumption Uncorrelated exponential as appropriate reference model
invented entities (1)
-
Multivariate variation indexes
no independent evidence
Lean theorems connected to this paper
-
IndisputableMonolith/Cost/FunctionalEquation.leanwashburn_uniqueness_aczel unclear?
unclearRelation between the paper passage and the cited Recognition theorem.
The proposed multivariate variation indexes are scalar quantities, defined as ratios of two quadratic forms of the mean vector and the covariance matrix.
-
IndisputableMonolith/Foundation/RealityFromDistinction.leanreality_from_one_distinction unclear?
unclearRelation between the paper passage and the cited Recognition theorem.
GVI(Y) = EY^T (covY) EY / (EY^T EY)^2
What do these tags mean?
- matches
- The paper's claim is directly supported by a theorem in the formal canon.
- supports
- The theorem supports part of the paper's argument, but the paper may add assumptions or extra steps.
- extends
- The paper goes beyond the formal theorem; the theorem is a base layer rather than the whole result.
- uses
- The paper appears to rely on the theorem as machinery.
- contradicts
- The paper's claim conflicts with a theorem or certificate in the canon.
- unclear
- Pith found a possible connection, but the passage is too broad, indirect, or ambiguous to say the theorem truly supports the claim.
Reference graph
Works this paper leans on
-
[1]
Abid, R., Kokonendji, C.C., Masmoudi, A. (2019a). Geometric disper- sion models with real quadratic v-functions. Statistics and Probability Letters 145, 197-204
-
[2]
Abid, R., Kokonendji, C.C., Masmoudi, A. (2019b). Geometric Tweedie regression models for continuous and semicontinuous data with variation phenomenon. AStA Advances in Statistical Analysis, DOI:10.1007/s10182-019-00350-8
-
[3]
Abid, R., Kokonendji, C.C., Masmoudi, A. (2019c). Poisson- exponential-Tweedie regression models for ultra-overdispersed count data and applications. Submitted for publication
-
[4]
Abramowitz, M., Stegun, I.A. (1972). Handbook of Mathematical Functions with Formulas, Graphs, and Mathematical Tables, Dover Publications, New York
work page 1972
-
[5]
Aerts, S., Haesbroeck, G. (2017). Robust asymptotic tests for the equal- ity of multivariate coefficients of variation, TEST 26, 163–187
work page 2017
-
[6]
Albert, A., Zhang, L. (2010). A novel definition of the multivariate coefficient of variation, Biometrical Journal 52, 667–675. 26
work page 2010
-
[7]
Angelo, C., Brian, R. (2019). Package boot,https://cran.r-project. org/web/packages/boot/
work page 2019
-
[8]
Arnold, B.C., Tony Ng, H.K. (2011). Flexible bivariate beta distribu- tions, Journal of Multivariate Analysis 102, 1194–1202
work page 2011
-
[9]
Balakrishnan, N., Basu, A.P . (1995). The Exponential Distribution: Theory, Models and Applications, Gordon and Breach, Amsterdam
work page 1995
-
[10]
Barlow, R.A., Proschan, F. (1981). Statistical Theory of Reliability and Life Testing: Probability Models, To begin with, Silver Springs, Mary- land
work page 1981
-
[11]
Barndor ff-Nielsen, O.E. (1997). Normal inverse Gaussian distribution and stochastic volatility modelling, Scandinavian Journal of Statistics 24, 1–13
work page 1997
-
[12]
Basu, A.P . (1988). Multivariate exponential distributions and their applications in reliability. In: Handbook of Statistics, vol. 7, Quality Control and Reliability, P .R. Krishnaiah and C.R. Rao (eds), Elsevier, Amsterdam, 467–477
work page 1988
-
[13]
Bonat, W.H., Jørgensen, B. (2016). Multivariate covariance generalized linear models, Journal of the Royal Statistical Society Series C (Appl. Statist.) 65, 649–675
work page 2016
-
[14]
Boubacar Ma ¨ınassara, Y., Kokonendji, C.C. (2014). On normal stable Tweedie models and power-generalized variance functions of only one component. TEST 23, 585-606
work page 2014
-
[15]
Casalis, M. (1996). The 2 d + 4 simple quadratic natural exponential families on Rd, Annal of Statistics 24, 1828–1854
work page 1996
-
[16]
Cram ´er, H. (1974). Mathematical Methods of Statistics, Princeton Uni- versity Press, Princeton
work page 1974
-
[17]
Cuenin, J., Jørgensen, B., Kokonendji, C.C. (2016). Simulations of full multivariate Tweedie with flexible dependence structure, Com- putional Statistics 31, 1477–1492. 27
work page 2016
-
[18]
Dey, A.K., Kundu, D. (2009). Discriminating among the log-normal, Weibull, and generalized exponential distributions, IEEE Transactions on Reliability 58, 416–424
work page 2009
-
[19]
Feltz, C.J., Miller, G.E. (1996). An asymptotic test for the equality of coefficients of variation from k populations, Statistics in Medicine 15, 647–658
work page 1996
-
[20]
Fisher, R.A. (1934). The e ffects of methods of ascertainment upon the estimation of frequencies, Annals of Eugenics 6, 13-25
work page 1934
-
[21]
Hayashi, F. (2000). Econometrics, Princeton University Press, URL: http://fhayashi.fc2web.com/hayashi_econometrics.htm, Chap- ter 10, 665–667
work page 2000
-
[22]
Joe, H. (2014). Dependence Modeling with Copulas, Monographs on Statistics and Applied Probability 134, Chapman & Hall - CRC Press, London
work page 2014
-
[23]
Johnson, R.A., Wichern, D.W. (2007). Applied Multivariate Statistical Analysis, 6th Edition, Pearson Prentice Hall, New Jersey
work page 2007
-
[24]
Jørgensen, B., Kokonendji, C.C. (2016). Discrete dispersion models and their Tweedie asymptotics, AStA Advances in Statistical Analysis 100, 133–153
work page 2016
-
[25]
Kokonendji, C.C. (2014). Over- and underdispersion models. In: N. Balakrishnan (Ed.) The Wiley Encyclopedia of Clinical Trials - Meth- ods and Applications of Statistics in Clinical Trials, Vol. 2 (Chap. 30), Wiley, New York, pp. 506-526
work page 2014
-
[26]
Kokonendji, C.C., Miz `ere, D., Balakrishnan, N. (2008). Connections of the Poisson weight function to overdispersion and underdispersion, Journal of Statistical Planning and Inference 138, 1287–1296
work page 2008
-
[27]
Kokonendji, C.C., Moypemna Sembona, C.C. (2018). Characteriza- tion and classification of multiple stable Tweedie models. Lithuanian Mathematical Journal 58, 441-456
work page 2018
-
[28]
Kokonendji, C.C., Puig, P . (2018). Fisher dispersion index for multi- variate count distributions: A review and a new proposal, Journal of Multivariate Analysis 165, 180–193. 28
work page 2018
-
[29]
Kotz, S., Balakrishnan, N., Johnson, L.N. (2000). Continuous Multi- variate Distributions, Wiley, Chichester
work page 2000
-
[30]
Marshall, A.W., Olkin, I. (1967). A multivariate exponential distribu- tion, Journal of American Statistical Association 62, 30–44
work page 1967
-
[31]
Pearson, K. (1896). Mathematical contributions to the theory of evo- lution. III. Regression, heredity and panmixia, Philosophical Transac- tions of the Royal Society, Series A, 187, 253–318
-
[32]
Python Software Foundation. (2019). Python Language Reference, Version 3.7.3, Available athttp://www.python.org
work page 2019
-
[33]
R Core Team. (2018). R: A Language and Environment for Statistical Computing, R Foundation for Statistical Computing, Vienna. http: //cran.r-project.org/
work page 2018
-
[34]
Serfling, R.J. (1980). Approximation Theorems of Mathematical Statis- tics, Wiley, New York
work page 1980
-
[35]
Su, P . (2015). Generation of Multivariate Data with Arbitrary Marginals: Package, https://cran.r-project.org/web/packages/ NORTARA/
work page 2015
-
[36]
Teimouri, M., Gupta, A.K. (2011). On a bivariate Weibull distribution, Advances and Applications in Statistics 22, 77–106
work page 2011
-
[37]
Tour ´e, A.Y., Dossou-Gb ´et´e, S., Kokonendji, C.C. (2019). Asymptotic normality of the test statistics for relative dispersion and relative vari- ation indexes, Submitted for publication
work page 2019
-
[38]
Tweedie, M.C.K. (1984). An index which distinguishes between some important exponential families. In: Ghosh, J.K., Roy, J. (eds.) Statistics: Applications and New Directions. Proceedings of the Indian Statistical Golden Jubilee International Conference, Calcutta, pp. 579–604. 29
work page 1984
discussion (0)
Sign in with ORCID, Apple, or X to comment. Anyone can read and Pith papers without signing in.