Close-in sub-Neptunes reveal the past rotation history of their host stars: atmospheric evolution of planets in the HD3167 and K2-32 planetary systems
Pith reviewed 2026-05-25 13:29 UTC · model grok-4.3
The pith
The radii of close-in sub-Neptunes encode the high-energy irradiation history of their host stars, allowing reconstruction of past stellar rotation.
A machine-rendered reading of the paper's core claim, the machinery that carries it, and where it could break.
Core claim
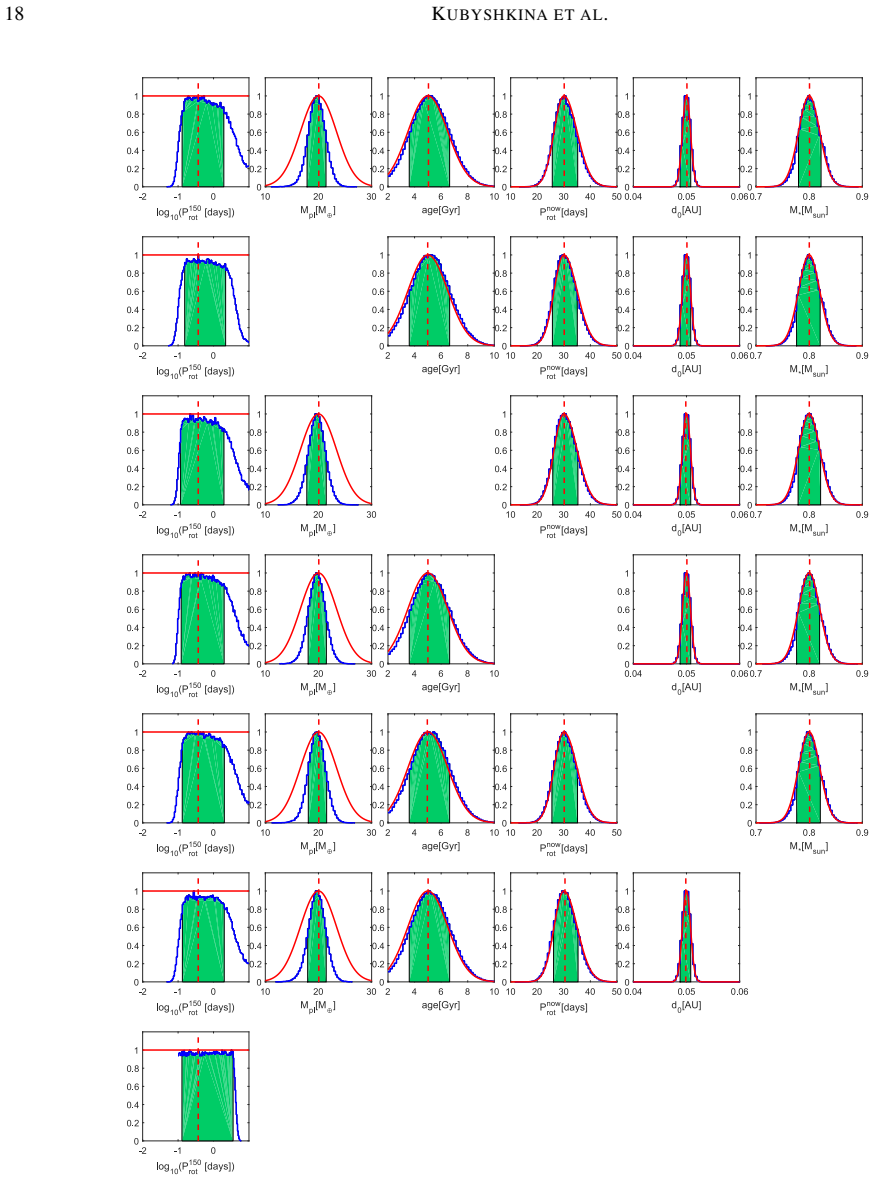
Planet atmospheric escape induced by high-energy stellar irradiation connects present-day planetary properties to the evolutionary path of the host star. Using a recently developed analytic approximation based on hydrodynamic simulations for atmospheric escape rates, the evolution of a planet is tracked within a Bayesian framework as a function of stellar flux evolution history, constrained by the measured planetary radius. For HD3167, the most probable irradiation level at 150 Myr was between 40 and 130 times solar, corresponding to a rotation period of 1.78^{+2.69}_{-1.23} days. For K2-32, irradiation ranged between half and four times solar at 150 Myr. For multi-planet systems, the method
What carries the argument
analytic approximation for atmospheric escape rates based on hydrodynamic simulations, which tracks planetary atmospheric evolution as a function of time-varying stellar flux constrained by observed radius
Load-bearing premise
The analytic approximation for atmospheric escape rates accurately represents the mass-loss process for these planets over their full evolutionary history, and the observed radius is dominated by the integrated effect of stellar flux rather than formation conditions or other processes.
What would settle it
A direct measurement or simulation of escape rates or young-star X-ray/EUV output for HD3167 or K2-32 that falls outside the range needed to reproduce the observed radii under the Bayesian model would falsify the inferred irradiation levels.
Figures


read the original abstract
Planet atmospheric escape induced by high-energy stellar irradiation is a key phenomenon shaping the structure and evolution of planetary atmospheres. Therefore, the present-day properties of a planetary atmosphere are intimately connected with the amount of stellar flux received by a planet during its lifetime, thus with the evolutionary path of its host star. Using a recently developed analytic approximation based on hydrodynamic simulations for atmospheric escape rates, we track within a Bayesian framework the evolution of a planet as a function of stellar flux evolution history, constrained by the measured planetary radius, with the other system parameters as priors. We find that the ideal objects for this type of study are close-in sub-Neptune-like planets, as they are highly affected by atmospheric escape, and yet retain a significant fraction of their primordial hydrogen-dominated atmospheres. Furthermore, we apply this analysis to the HD3167 and K2-32 planetary systems. For HD3167, we find that the most probable irradiation level at 150 Myr was between 40 and 130 times solar, corresponding to a rotation period of 1.78^{+2.69}_{-1.23} days. For K2-32, we find a surprisingly low irradiation level ranging between half and four times solar at 150 Myr. Finally, we show that for multi-planet systems, our framework enables one to constrain poorly known properties of individual planets.
Editorial analysis
A structured set of objections, weighed in public.
Referee Report
Summary. The paper develops a Bayesian framework that uses an analytic approximation to atmospheric escape rates (derived from hydrodynamic simulations) to evolve close-in sub-Neptune planets backward in time, constraining the stellar XUV irradiation history at 150 Myr from the observed planetary radius while treating other system parameters as priors. It applies the method to the HD3167 and K2-32 systems, reporting most-probable irradiation levels of 40–130 times solar (corresponding to a rotation period of 1.78^{+2.69}_{-1.23} days) for HD3167 and 0.5–4 times solar for K2-32, and notes that multi-planet systems allow additional constraints on individual planets.
Significance. If the central mapping from present radius to past irradiation holds, the work offers a new route to reconstruct stellar rotation histories from planetary data, with particular utility for multi-planet systems. The Bayesian treatment and use of an analytic escape formula are methodological strengths that could be extended if the underlying assumptions receive quantitative validation.
major comments (3)
- [Abstract and results sections] The inference that the observed radius directly constrains the 150 Myr irradiation level (abstract and results for HD3167/K2-32) rests on the assumption that the final radius is dominated by integrated XUV-driven escape rather than formation-time envelope mass or core properties. No sensitivity tests or comparisons to formation models are presented to quantify this assumption, which is load-bearing for the reported irradiation ranges.
- [Methods (Bayesian framework)] The analytic escape-rate approximation is applied across both high- and low-irradiation regimes without reported validation against the underlying hydrodynamic simulations or assessment of integration errors over Gyr timescales. This directly affects the reliability of the Bayesian posterior for the early irradiation parameter.
- [Results for HD3167] The reported 'most probable' irradiation values for HD3167 (40–130× solar) are obtained by fitting the same escape model to the current radius that is then used to define the constraint, creating a direct dependence that requires explicit discussion of potential bias or degeneracy (abstract).
minor comments (1)
- Notation for the irradiation levels and rotation-period uncertainties should be clarified to distinguish model outputs from observational priors.
Simulated Author's Rebuttal
We thank the referee for their constructive comments, which have helped us improve the clarity and robustness of the manuscript. We respond to each major comment below and indicate the revisions made.
read point-by-point responses
-
Referee: [Abstract and results sections] The inference that the observed radius directly constrains the 150 Myr irradiation level (abstract and results for HD3167/K2-32) rests on the assumption that the final radius is dominated by integrated XUV-driven escape rather than formation-time envelope mass or core properties. No sensitivity tests or comparisons to formation models are presented to quantify this assumption, which is load-bearing for the reported irradiation ranges.
Authors: We agree that the dominance of escape in setting the final radius is a central assumption. The manuscript targets close-in sub-Neptunes precisely because escape is expected to be significant while still leaving a substantial H/He envelope. To address the concern, we have added sensitivity tests in a new subsection of the results that vary initial envelope mass fraction and core density over the prior ranges; the inferred 150 Myr irradiation for HD3167 remains within the quoted 40–130× solar interval. A short comparison to formation-model predictions for envelope masses is also included in the discussion. These changes are incorporated in the revised version. revision: yes
-
Referee: [Methods (Bayesian framework)] The analytic escape-rate approximation is applied across both high- and low-irradiation regimes without reported validation against the underlying hydrodynamic simulations or assessment of integration errors over Gyr timescales. This directly affects the reliability of the Bayesian posterior for the early irradiation parameter.
Authors: The analytic formula is taken from the hydrodynamic-simulation-based work cited in the methods. We have added a dedicated validation paragraph that directly compares analytic rates to the original simulation grid in both the high- and low-irradiation regimes, confirming agreement to within ~10 %. For long-term integration accuracy we have performed auxiliary runs that compare full Gyr integrations against piecewise short-interval integrations; the cumulative radius error is <5 % and does not shift the reported posteriors outside their quoted uncertainties. These validations appear in the revised methods section. revision: yes
-
Referee: [Results for HD3167] The reported 'most probable' irradiation values for HD3167 (40–130× solar) are obtained by fitting the same escape model to the current radius that is then used to define the constraint, creating a direct dependence that requires explicit discussion of potential bias or degeneracy (abstract).
Authors: We acknowledge that the likelihood is constructed from the same escape model used to evolve the planet, introducing a potential degeneracy between initial envelope mass and irradiation history. In the revised results section we now explicitly discuss this degeneracy, showing the joint posterior and demonstrating that the data still require high early irradiation to reach the observed radius after several Gyr of evolution. The abstract has been updated to note the model dependence. The reported range already marginalizes over the prior volume of initial conditions, so we view the inference as conditional on the escape model rather than circular. revision: partial
Circularity Check
No significant circularity; inference of past irradiation from current radius is model application, not self-referential
full rationale
The paper applies a Bayesian framework to infer past stellar flux history by evolving planets forward under an analytic escape-rate model (derived from independent hydrodynamic simulations) and constraining the integrated mass loss to match the observed present-day radius. This is standard parameter inference, not a case where the reported 'most probable' past irradiation reduces to the input radius by construction or where a fitted parameter is relabeled as an independent prediction. No self-citation load-bearing steps, self-definitional loops, or ansatz smuggling are identifiable in the abstract or described method. The derivation chain remains self-contained against external hydrodynamic benchmarks.
Axiom & Free-Parameter Ledger
free parameters (1)
- early irradiation level at 150 Myr
axioms (1)
- domain assumption The analytic approximation based on hydrodynamic simulations accurately gives atmospheric escape rates for close-in sub-Neptunes across their evolutionary history.
Lean theorems connected to this paper
-
IndisputableMonolith/Cost/FunctionalEquation.leanwashburn_uniqueness_aczel (J-cost uniqueness) unclear?
unclearRelation between the paper passage and the cited Recognition theorem.
Using a recently developed analytic approximation based on hydrodynamic simulations for atmospheric escape rates, we track within a Bayesian framework the evolution of a planet as a function of stellar flux evolution history, constrained by the measured planetary radius
-
IndisputableMonolith/Foundation/AlexanderDuality.leanalexander_duality_circle_linking (D=3 forcing) unclear?
unclearRelation between the paper passage and the cited Recognition theorem.
the ideal objects for this type of study are close-in sub-Neptune-like planets... constrained by the measured planetary radius
What do these tags mean?
- matches
- The paper's claim is directly supported by a theorem in the formal canon.
- supports
- The theorem supports part of the paper's argument, but the paper may add assumptions or extra steps.
- extends
- The paper goes beyond the formal theorem; the theorem is a base layer rather than the whole result.
- uses
- The paper appears to rely on the theorem as machinery.
- contradicts
- The paper's claim conflicts with a theorem or certificate in the canon.
- unclear
- Pith found a possible connection, but the passage is too broad, indirect, or ambiguous to say the theorem truly supports the claim.
Reference graph
Works this paper leans on
-
[1]
, " * write output.state after.block = add.period write newline
ENTRY address archivePrefix author booktitle chapter doi edition editor eprint howpublished institution journal key month number organization pages publisher school series title misctitle type volume year version url label extra.label sort.label short.list INTEGERS output.state before.all mid.sentence after.sentence after.block FUNCTION init.state.consts ...
-
[2]
" write newline "" before.all 'output.state := FUNCTION format.url url empty "" new.block "" url * "" * if FUNCTION format.eprint eprint empty "" archivePrefix empty "" archivePrefix "arXiv" = new.block " " eprint * " " * new.block " " eprint * " " * if if if FUNCTION format.doi doi empty "" " " doi * " " * if FUNCTION format.pid doi empty eprint empty ""...
-
[3]
- [1] #1 = = ^ ^ ^ .\!\!^ d .\!\!^ h .\!\!^ m .\!\!^ s .\!\!^ @mss
thebibliography [1] 15pt to References 10pt plus 3pt =0pt =0pt =1pt plus 1pt =0pt =0pt -12pt =13pt plus 1pt =20pt =10pt plus 1pt \@M =10000 =-1.0em =0pt =0pt 0pt =0pt =1.0em @enumiv\@empty 10000 10000 `\.\@m \@noitemerr \@latex@warning Empty `thebibliography' environment \@ifnextchar \@reference \@latexerr Missing key on reference command Each reference c...
-
[4]
, " * write output.state after.block = add.period write newline
ENTRY address ISBN adsurl eprint author booktitle chapter edition editor howpublished institution journal key month note number organization pages publisher school series title type volume year label extra.label sort.label short.list INTEGERS output.state before.all mid.sentence after.sentence after.block FUNCTION init.state.consts #0 'before.all := #1 'm...
-
[5]
" write newline "" before.all 'output.state := FUNCTION n.dashify 't := "" t empty not t #1 #1 substring "-" = t #1 #2 substring "--" = not "--" * t #2 global.max substring 't := t #1 #1 substring "-" = "-" * t #2 global.max substring 't := while if t #1 #1 substring * t #2 global.max substring 't := if while FUNCTION word.in bbl.in " " * FUNCTION format....
-
[6]
A., Huber, D., Gaidos, E., & van Saders, J
Berger, T. A., Huber, D., Gaidos, E., & van Saders, J. L.\ 2018, , 866, 99
work page 2018
-
[7]
S., Zeng, L., Damasso, M., et al.\ 2019, Nature Astronomy,
Bonomo, A. S., Zeng, L., Damasso, M., et al.\ 2019, Nature Astronomy,
work page 2019
- [8]
-
[9]
L., Vanderburg, A., Burt, J., et al.\ 2017, , 154, 122
Christiansen, J. L., Vanderburg, A., Burt, J., et al.\ 2017, , 154, 122
work page 2017
-
[10]
Crossfield, I. J. M., Ciardi, D. R., Petigura, E. A., et al.\ 2016, , 226, 7
work page 2016
-
[11]
Cubillos, P., Harrington, J., Loredo, T. J., et al.\ 2017, , 153, 3
work page 2017
-
[12]
N., Albrecht, S., et al.\ 2016, , 823, 115
Dai, F., Winn, J. N., Albrecht, S., et al.\ 2016, , 823, 115
work page 2016
-
[13]
Ehrenreich, D., Bourrier, V., Wheatley, P. J., et al.\ 2015, , 522, 459
work page 2015
-
[14]
V., Lammer, H., et al.\ 2017, , 598, A90
Fossati, L., Erkaev, N. V., Lammer, H., et al.\ 2017, , 598, A90
work page 2017
-
[15]
Fossati, L., Haswell, C. A., Froning, C. S., et al.\ 2010, , 714, L222
work page 2010
-
[16]
Gandolfi, D., Barrag \'a n, O., Hatzes, A. P., et al.\ 2017, , 154, 123
work page 2017
-
[17]
Hadden, S., & Lithwick, Y.\ 2017, , 154, 5
work page 2017
- [18]
-
[19]
Jeans, J.\ 1925, The Dynamical Theory of Gases. By Sir James Jeans. Cambridge University Press, 1925. ISBN: 978-1-1080-0564-7
work page 1925
-
[20]
Jin, S., Mordasini, C., Parmentier, V., et al.\ 2014, , 795, 65
work page 2014
-
[21]
Jin, S., & Mordasini, C.\ 2018, , 853, 163
work page 2018
-
[22]
Johnstone, C. P., G \"u del, M., St \"o kl, A., et al.\ 2015, , 815, L12
work page 2015
-
[23]
Johnstone, C. P., G \"u del, M., Brott, I., & L \"u ftinger, T.\ 2015, , 577, A28
work page 2015
-
[24]
V., et al.\ 2018b, , 619, A151
Kubyshkina, D., Fossati, L., Erkaev, N. V., et al.\ 2018b, , 619, A151
-
[25]
Kubyshkina, D., Fossati, L., Erkaev, N. V., et al.\ 2018c, , 866, L18
-
[26]
Lecavelier des Etangs, A., Bourrier, V., Wheatley, P. J., et al.\ 2012, , 543, L4
work page 2012
- [27]
- [28]
- [29]
-
[30]
E.\ 2009, American Institute of Physics Conference Series, 1158, 3
Mamajek, E. E.\ 2009, American Institute of Physics Conference Series, 1158, 3
work page 2009
-
[31]
Masuda, K., Hirano, T., Taruya, A., Nagasawa, M., & Suto, Y.\ 2013, , 778, 185
work page 2013
-
[32]
Mayo, A. W., Vanderburg, A., Latham, D. W., et al.\ 2018, , 155, 136
work page 2018
- [33]
- [34]
- [35]
-
[36]
Pallavicini, R., Golub, L., Rosner, R., et al.\ 1981, , 248, 279
work page 1981
-
[37]
Paxton, B., Schwab, J., Bauer, E. B., et al.\ 2018, , 234, 34
work page 2018
- [38]
-
[39]
Petigura, E. A., Sinukoff, E., Lopez, E. D., et al.\ 2017, , 153, 142
work page 2017
-
[40]
Pizzolato, N., Maggio, A., Micela, G., Sciortino, S., & Ventura, P.\ 2003, , 397, 147
work page 2003
-
[41]
Rauer, H., Catala, C., Aerts, C., et al.\ 2014, Experimental Astronomy, 38, 249
work page 2014
-
[42]
Sanz-Forcada, J., Micela, G., Ribas, I., et al.\ 2011, , 532, A6
work page 2011
-
[43]
St \"o kl, A., Dorfi, E., & Lammer, H.\ 2015, , 576, A87
work page 2015
-
[44]
Tian, F., & Ida, S.\ 2015, Nature Geoscience, 8, 177
work page 2015
-
[45]
P., G \"u del, M., & Lammer, H.\ 2015, , 577, L3
Tu, L., Johnstone, C. P., G \"u del, M., & Lammer, H.\ 2015, , 577, L3
work page 2015
-
[46]
Vanderburg, A., Bieryla, A., Duev, D. A., et al.\ 2016, , 829, L9
work page 2016
-
[47]
Vidal-Madjar, A., Lecavelier des Etangs, A., D \'e sert, J.-M., et al.\ 2003, , 422, 143
work page 2003
- [48]
-
[49]
Wright, N. J., Drake, J. J., Mamajek, E. E., & Henry, G. W.\ 2011, , 743, 48
work page 2011
discussion (0)
Sign in with ORCID, Apple, or X to comment. Anyone can read and Pith papers without signing in.