Improving the Projection of Global Structures in Data through Spanning Trees
Pith reviewed 2026-05-24 22:03 UTC · model grok-4.3
The pith
STAD builds graphs from high-dimensional data by adding edges to a minimum spanning tree to maximize distance correlation.
A machine-rendered reading of the paper's core claim, the machinery that carries it, and where it could break.
Core claim
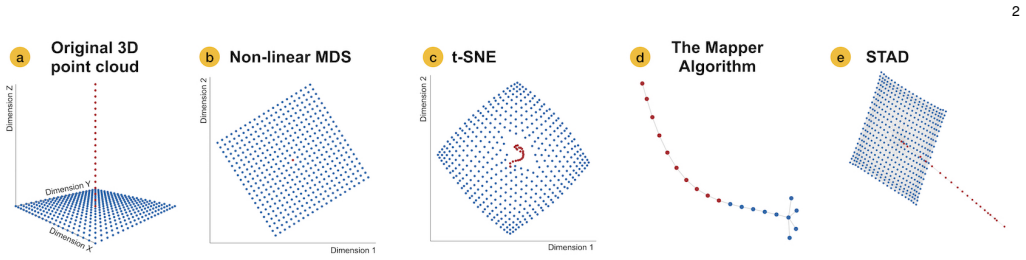
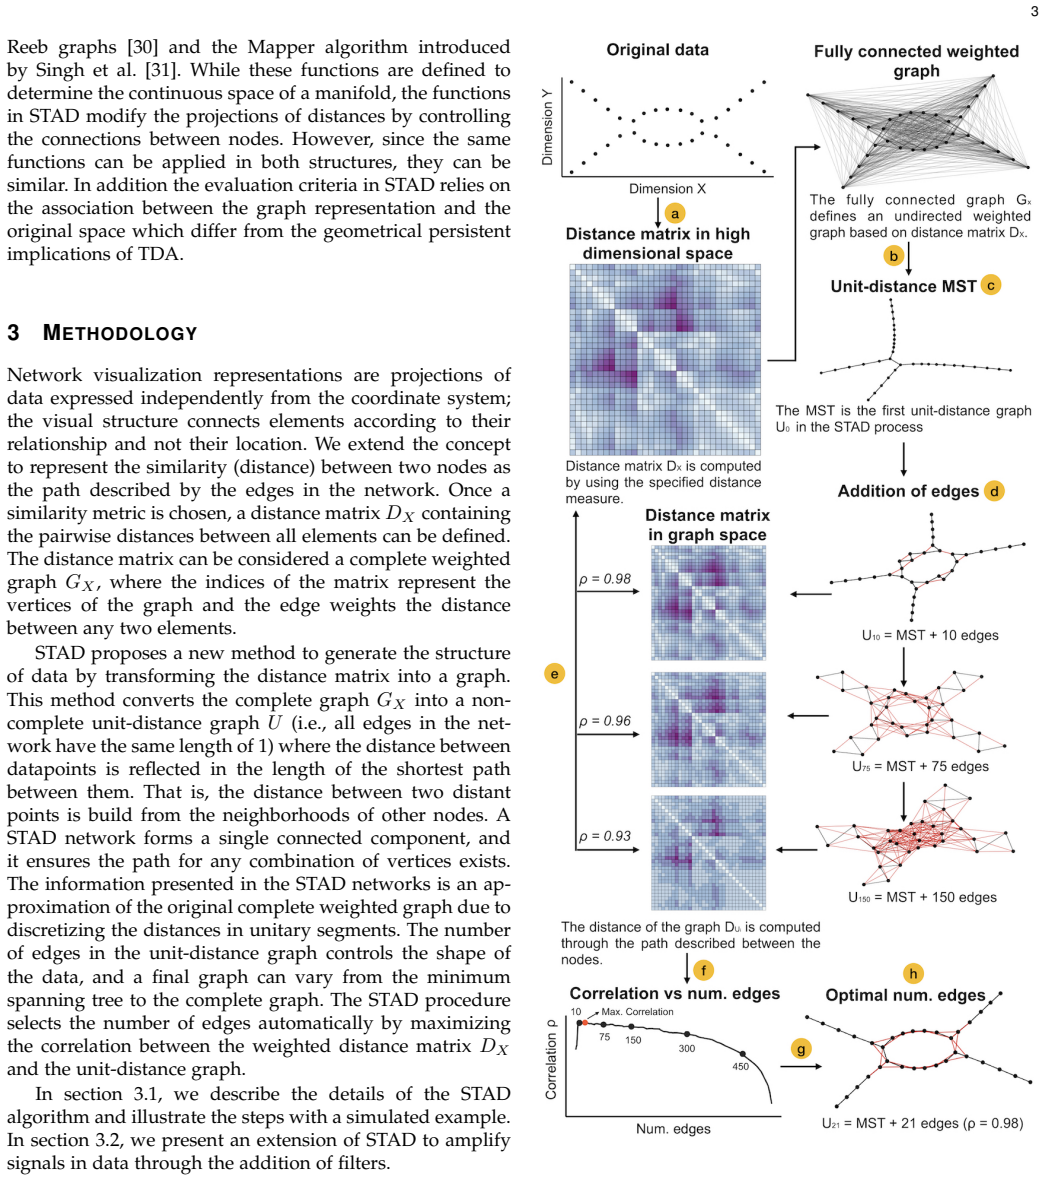
STAD generates an abstract representation of high-dimensional data by giving each data point a location in a graph which preserves the distances in the original high-dimensional space. The STAD graph is built upon the Minimum Spanning Tree (MST) to which new edges are added until the correlation between the distances from the graph and the original dataset is maximized. Additionally, STAD supports the inclusion of additional functions to focus the exploration and allow the analysis of data from new perspectives, emphasizing traits in data which otherwise would remain hidden.
What carries the argument
The augmentation of the minimum spanning tree by adding edges to maximize the correlation between graph shortest-path distances and original high-dimensional distances.
If this is right
- The graph representation allows visualization independent of coordinate systems.
- Additional functions can be added to emphasize specific traits in the data.
- The method can be applied to real-world datasets without prior hypotheses.
- It approximates global structures in data through the optimized graph.
Where Pith is reading between the lines
- This could provide an alternative to scatterplots for seeing global connections in data.
- Testing on synthetic datasets with known structures would verify the distance preservation.
- The approach might integrate with other graph-based analysis techniques for deeper insights.
Load-bearing premise
Maximizing the correlation between the shortest path distances in the graph and the original high-dimensional distances will yield a faithful representation of the data's global structure.
What would settle it
Finding a dataset where the STAD graph exhibits distance relationships that contradict the original high-dimensional distances even after correlation maximization.
Figures
read the original abstract
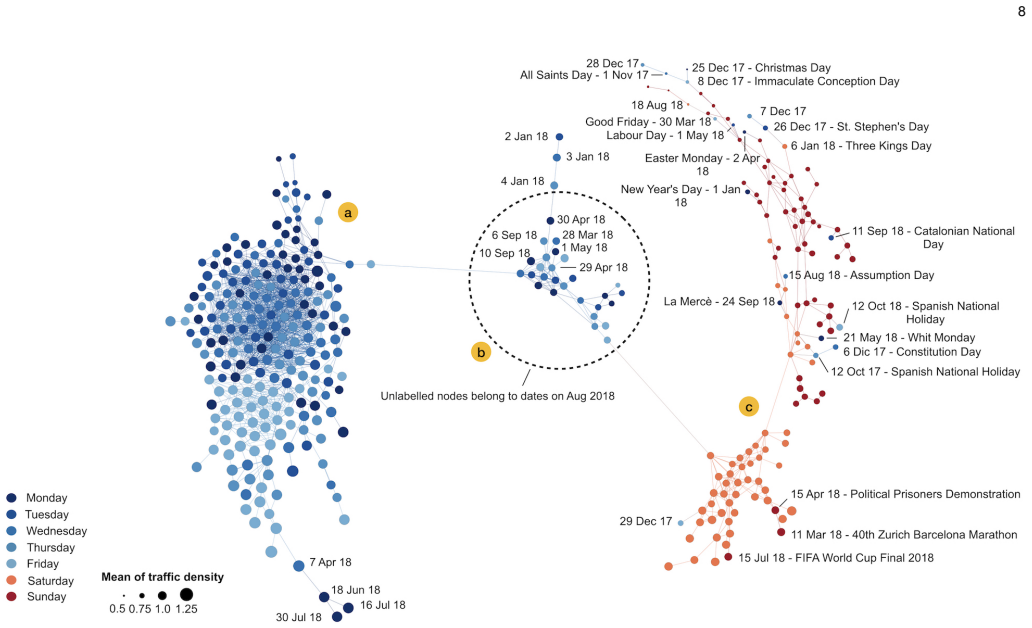
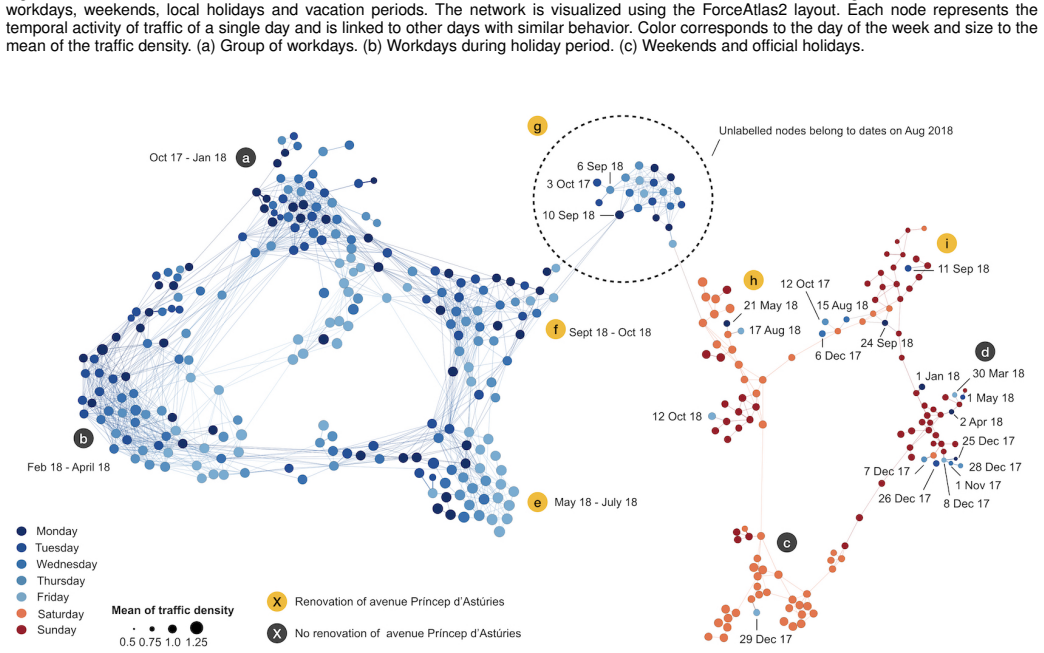
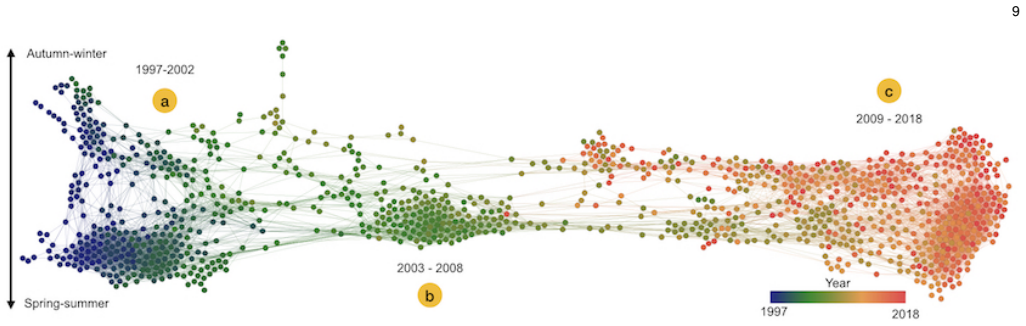
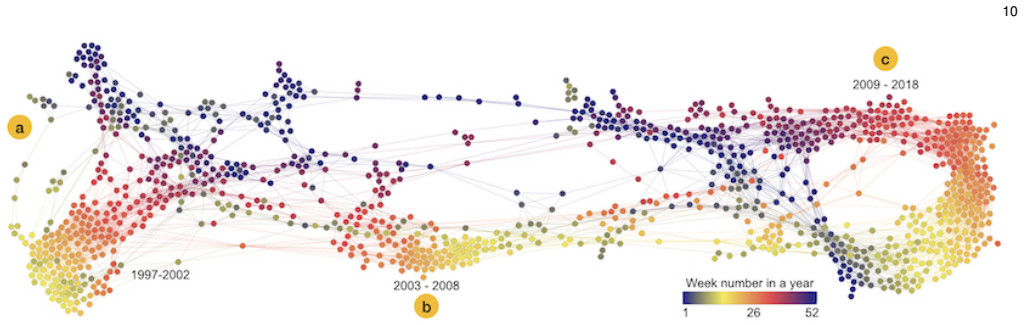
The connection of edges in a graph generates a structure that is independent of a coordinate system. This visual metaphor allows creating a more flexible representation of data than a two-dimensional scatterplot. In this work, we present STAD (Spanning Trees as Approximation of Data), a dimensionality reduction method to approximate the high-dimensional structure into a graph with or without formulating prior hypotheses. STAD generates an abstract representation of high-dimensional data by giving each data point a location in a graph which preserves the distances in the original high-dimensional space. The STAD graph is built upon the Minimum Spanning Tree (MST) to which new edges are added until the correlation between the distances from the graph and the original dataset is maximized. Additionally, STAD supports the inclusion of additional functions to focus the exploration and allow the analysis of data from new perspectives, emphasizing traits in data which otherwise would remain hidden. We demonstrate the effectiveness of our method by applying it to two real-world datasets: traffic density in Barcelona and temporal measurements of air quality in Castile and Le\'on in Spain.
Editorial analysis
A structured set of objections, weighed in public.
Referee Report
Summary. The manuscript introduces STAD (Spanning Trees as Approximation of Data), a dimensionality reduction technique that represents high-dimensional data points as vertices in an undirected graph. The construction begins with the minimum spanning tree (MST) of the data and iteratively adds edges until the Pearson correlation between all-pairs shortest-path distances on the resulting graph and the original high-dimensional distances is maximized. The method optionally incorporates auxiliary functions to emphasize selected data attributes. Effectiveness is illustrated on two real-world datasets (Barcelona traffic density and air-quality time series from Castile and León).
Significance. If the central preservation claim holds, the approach supplies a coordinate-free graph visualization that can capture global structure more flexibly than scatter-plot embeddings while permitting targeted exploration via auxiliary functions. The two real-world case studies provide concrete evidence of applicability in urban and environmental domains. However, the absence of any analysis of the optimization landscape, uniqueness of the resulting graph, or sensitivity to the edge-addition order limits the result's immediate theoretical or practical impact.
major comments (2)
- [abstract and §3 (STAD construction)] The central algorithmic claim (abstract and §3) states that the edge-augmentation procedure that maximizes correlation between graph shortest-path distances and original distances yields a faithful global-structure approximation. No analysis is supplied of the optimization landscape: multiple non-isomorphic graphs can attain near-maximal correlation while differing in connectivity and introducing spurious shortcuts that alter geodesic structure. This directly undermines the preservation guarantee.
- [§3 (algorithm description)] No pseudocode, convergence criterion, or sensitivity study is given for the edge-addition loop (abstract and §3). Consequently it is impossible to determine whether the reported correlation maximum is stable under different heuristics or data perturbations, which is load-bearing for any claim that the output graph reliably approximates the input metric.
minor comments (2)
- [abstract] The abstract asserts that STAD works “with or without formulating prior hypotheses,” yet the text never distinguishes the two regimes or shows how the auxiliary-function mechanism differs from the baseline correlation-maximization procedure.
- [§4–5 (figures)] Figure captions and axis labels in the case-study sections are insufficiently detailed to allow a reader to reproduce the exact correlation values or edge counts shown.
Simulated Author's Rebuttal
We thank the referee for the detailed and constructive feedback. We address each major comment below, indicating where revisions will be made to the manuscript.
read point-by-point responses
-
Referee: [abstract and §3 (STAD construction)] The central algorithmic claim (abstract and §3) states that the edge-augmentation procedure that maximizes correlation between graph shortest-path distances and original distances yields a faithful global-structure approximation. No analysis is supplied of the optimization landscape: multiple non-isomorphic graphs can attain near-maximal correlation while differing in connectivity and introducing spurious shortcuts that alter geodesic structure. This directly undermines the preservation guarantee.
Authors: We agree that the manuscript does not include a formal analysis of the optimization landscape or the uniqueness of the resulting graph. STAD is presented as a heuristic that augments the MST by adding edges to maximize Pearson correlation with the original distances; the claim of faithful approximation rests on this maximization rather than on a proof of uniqueness. While multiple graphs may achieve similar correlation values, the procedure is deterministic given the starting MST and the addition criterion. We will add a discussion section addressing this limitation and its implications for the approximation quality. revision: partial
-
Referee: [§3 (algorithm description)] No pseudocode, convergence criterion, or sensitivity study is given for the edge-addition loop (abstract and §3). Consequently it is impossible to determine whether the reported correlation maximum is stable under different heuristics or data perturbations, which is load-bearing for any claim that the output graph reliably approximates the input metric.
Authors: We accept that the current description lacks pseudocode, an explicit convergence criterion, and sensitivity analysis. The loop adds edges until further additions cease to increase the correlation; we will include pseudocode for the full construction procedure, state the stopping criterion clearly, and add a short sensitivity discussion based on the two real-world datasets already analyzed. revision: yes
Circularity Check
STAD distance preservation achieved by construction through correlation maximization on augmented MST
specific steps
-
fitted input called prediction
[Abstract]
"The STAD graph is built upon the Minimum Spanning Tree (MST) to which new edges are added until the correlation between the distances from the graph and the original dataset is maximized."
The graph is defined by optimizing the correlation between its distances and the original distances; the claimed preservation of distances is therefore enforced by the fitting procedure itself rather than derived or predicted independently.
full rationale
The paper's core construction explicitly selects the graph by maximizing correlation between its shortest-path distances and the input high-dimensional distances. This makes the central claim of distance preservation a direct consequence of the optimization rather than an independent result. The provided text contains no self-citation chains, uniqueness theorems, or other load-bearing reductions; the circularity is isolated to this fitting step.
Axiom & Free-Parameter Ledger
Lean theorems connected to this paper
-
IndisputableMonolith/Cost/FunctionalEquation.leanwashburn_uniqueness_aczel unclear?
unclearRelation between the paper passage and the cited Recognition theorem.
The STAD graph is built upon the Minimum Spanning Tree (MST) to which new edges are added until the correlation between the distances from the graph and the original dataset is maximized.
-
IndisputableMonolith/Foundation/RealityFromDistinction.leanreality_from_one_distinction unclear?
unclearRelation between the paper passage and the cited Recognition theorem.
STAD generates an abstract representation of high-dimensional data by giving each data point a location in a graph which preserves the distances in the original high-dimensional space.
What do these tags mean?
- matches
- The paper's claim is directly supported by a theorem in the formal canon.
- supports
- The theorem supports part of the paper's argument, but the paper may add assumptions or extra steps.
- extends
- The paper goes beyond the formal theorem; the theorem is a base layer rather than the whole result.
- uses
- The paper appears to rely on the theorem as machinery.
- contradicts
- The paper's claim conflicts with a theorem or certificate in the canon.
- unclear
- Pith found a possible connection, but the passage is too broad, indirect, or ambiguous to say the theorem truly supports the claim.
Reference graph
Works this paper leans on
-
[1]
Munzner, Visualization analysis and design
T. Munzner, Visualization analysis and design . AK Peters/CRC Press, 2014
work page 2014
-
[2]
L. v. d. Maaten and G. Hinton, “Visualizing data using t-SNE,” Journal of machine learning research , vol. 9, no. Nov, pp. 2579–2605, 2008
work page 2008
-
[3]
UMAP: Uniform Manifold Approximation and Projection for Dimension Reduction
L. McInnes, J. Healy, and J. Melville, “UMAP: Uniform manifold approximation and projection for dimension reduction,” arXiv preprint arXiv:1802.03426, 2018
work page internal anchor Pith review Pith/arXiv arXiv 2018
-
[4]
Intrinsic t-stochastic neighbor em- bedding for visualization and outlier detection,
E. Schubert and M. Gertz, “Intrinsic t-stochastic neighbor em- bedding for visualization and outlier detection,” in International Conference on Similarity Search and Applications . Springer, 2017, pp. 188–203
work page 2017
-
[5]
Extract- ing insights from the shape of complex data using topology,
P . Y. Lum, G. Singh, A. Lehman, T. Ishkanov, M. Vejdemo- Johansson, M. Alagappan, J. Carlsson, and G. Carlsson, “Extract- ing insights from the shape of complex data using topology,” Scientific reports, vol. 3, p. 1236, 2013
work page 2013
-
[6]
J. L. Nielson, J. Paquette, A. W. Liu, C. F. Guandique, C. A. Tovar, T. Inoue, K.-A. Irvine, J. C. Gensel, J. Kloke, T. C. Petrossian et al., “Topological data analysis for discovery in preclinical spinal cord injury and traumatic brain injury,” Nature communications, vol. 6, p. 8581, 2015
work page 2015
-
[7]
T. Lakshmikanth, A. Olin, Y. Chen, J. Mikes, E. Fredlund, M. Rem- berger, B. Omazic, and P . Brodin, “Mass cytometry and topological data analysis reveal immune parameters associated with com- plications after allogeneic stem cell transplantation,” Cell reports, vol. 20, no. 9, pp. 2238–2250, 2017
work page 2017
-
[8]
Visual- izing high-dimensional data: Advances in the past decade,
S. Liu, D. Maljovec, B. Wang, P .-T. Bremer, and V . Pascucci, “Visual- izing high-dimensional data: Advances in the past decade,” IEEE transactions on visualization and computer graphics, vol. 23, no. 3, pp. 1249–1268, 2017
work page 2017
-
[9]
S. Mukherjee, B. K. Sinha, and A. K. Chattopadhyay, “Multidi- mensional Scaling,” in Statistical Methods in Social Science Research . Springer, 2018, pp. 113–122
work page 2018
- [10]
-
[11]
Nonmetric multidimensional scaling: a numerical method,
J. B. Kruskal, “Nonmetric multidimensional scaling: a numerical method,” Psychometrika, vol. 29, no. 2, pp. 115–129, 1964
work page 1964
-
[12]
A nonlinear mapping for data structure analysis,
J. W. Sammon, “A nonlinear mapping for data structure analysis,” IEEE Transactions on computers, vol. 100, no. 5, pp. 401–409, 1969
work page 1969
-
[13]
A survey on multidimensional scaling,
N. Saeed, H. Nam, M. I. U. Haq, and D. B. Muhammad Saqib, “A survey on multidimensional scaling,” ACM Computing Surveys (CSUR), vol. 51, no. 3, p. 47, 2018
work page 2018
-
[14]
The isomap algorithm and topological stability,
M. Balasubramanian and E. L. Schwartz, “The isomap algorithm and topological stability,” Science, vol. 295, no. 5552, pp. 7–7, 2002
work page 2002
-
[15]
Visualizing large-scale and high-dimensional data,
J. Tang, J. Liu, M. Zhang, and Q. Mei, “Visualizing large-scale and high-dimensional data,” in Proceedings of the 25th international conference on world wide web . International World Wide Web Conferences Steering Committee, 2016, pp. 287–297
work page 2016
-
[16]
invis: Ex- ploring high-dimensional RNA sequences from in vitro selection,
C ¸ . Demiralp, E. Hayden, J. Hammerbacher, and J. Heer, “invis: Ex- ploring high-dimensional RNA sequences from in vitro selection,” in 2013 IEEE Symposium on Biological Data Visualization (BioVis) . IEEE, 2013, pp. 1–8
work page 2013
-
[17]
MCLEAN: Multilevel Clustering Explo- ration As Network,
D. Alcaide and J. Aerts, “MCLEAN: Multilevel Clustering Explo- ration As Network,” PeerJ Computer Science, vol. 4, p. e145, 2018
work page 2018
-
[18]
Estimating the cluster tree of a density by analyzing the minimal spanning tree of a sample,
W. Stuetzle, “Estimating the cluster tree of a density by analyzing the minimal spanning tree of a sample,” Journal of classification , vol. 20, no. 1, pp. 025–047, 2003
work page 2003
-
[19]
Brushing of attribute clouds for the visualization of multivariate data,
H. J ¨anicke, M. B ¨ottinger, and G. Scheuermann, “Brushing of attribute clouds for the visualization of multivariate data,” IEEE Transactions on Visualization and Computer Graphics , vol. 14, no. 6, pp. 1459–1466, 2008
work page 2008
-
[20]
A User’s Guide to Topological Data Analysis
E. Munch, “A User’s Guide to Topological Data Analysis.” Journal of Learning Analytics, vol. 4, no. 2, pp. 47–61, 2017
work page 2017
-
[21]
Fast construction of the Vietoris-Rips complex,
A. Zomorodian, “Fast construction of the Vietoris-Rips complex,” Computers & Graphics, vol. 34, no. 3, pp. 263–271, 2010
work page 2010
-
[22]
V . Kurlin, “A one-dimensional homologically persistent skeleton of an unstructured point cloud in any metric space,” in Computer Graphics Forum , vol. 34, no. 5. Wiley Online Library, 2015, pp. 253–262
work page 2015
-
[23]
Structural analysis of multivariate point clouds using simplicial chains,
B. Rieck and H. Leitte, “Structural analysis of multivariate point clouds using simplicial chains,” in Computer Graphics Forum , vol. 33, no. 8. Wiley Online Library, 2014, pp. 28–37
work page 2014
-
[24]
H. Edelsbrunner and J. Harer, “Persistent homology-a survey,” Contemporary mathematics, vol. 453, pp. 257–282, 2008
work page 2008
-
[25]
L. Wasserman, “Topological data analysis,” Annual Review of Statis- tics and Its Application, vol. 5, pp. 501–532, 2018. 12
work page 2018
-
[26]
Barcodes: the persistent topology of data,
R. Ghrist, “Barcodes: the persistent topology of data,” Bulletin of the American Mathematical Society, vol. 45, no. 1, pp. 61–75, 2008
work page 2008
-
[27]
Visual ex- ploration of high dimensional scalar functions,
S. Gerber, P .-T. Bremer, V . Pascucci, and R. Whitaker, “Visual ex- ploration of high dimensional scalar functions,” IEEE Transactions on Visualization and Computer Graphics, vol. 16, no. 6, pp. 1271–1280, 2010
work page 2010
-
[28]
Parallel computation of 2D Morse-Smale complexes,
N. Shivashankar, M. Senthilnathan, and V . Natarajan, “Parallel computation of 2D Morse-Smale complexes,” IEEE Transactions on Visualization and Computer Graphics, vol. 18, no. 10, pp. 1757–1770, 2012
work page 2012
-
[29]
D. G ¨unther, J. Reininghaus, H. Wagner, and I. Hotz, “Efficient com- putation of 3D Morse–Smale complexes and persistent homology using discrete Morse theory,” The Visual Computer, vol. 28, no. 10, pp. 959–969, 2012
work page 2012
-
[30]
Reeb graphs for shape analysis and applications,
S. Biasotti, D. Giorgi, M. Spagnuolo, and B. Falcidieno, “Reeb graphs for shape analysis and applications,” Theoretical computer science, vol. 392, no. 1-3, pp. 5–22, 2008
work page 2008
-
[31]
Topological methods for the analysis of high dimensional data sets and 3d object recognition
G. Singh, F. M ´emoli, and G. E. Carlsson, “Topological methods for the analysis of high dimensional data sets and 3d object recognition.” in SPBG, 2007, pp. 91–100
work page 2007
-
[32]
P . Erd¨os, F. Harary, and W. T. Tutte, “On the dimension of a graph,” Mathematika, vol. 12, no. 2, pp. 118–122, 1965
work page 1965
-
[33]
Thirteen ways to look at the correlation coefficient,
J. Lee Rodgers and W. A. Nicewander, “Thirteen ways to look at the correlation coefficient,” The American Statistician, vol. 42, no. 1, pp. 59–66, 1988
work page 1988
-
[34]
On the Persistence of Clustering Solutions and True Number of Clusters in a Dataset
A. Srivastava, M. Baranwal, and S. M. Salapaka, “On the Persistence of Clustering Solutions and True Number of Clusters in a Dataset,” CoRR, vol. abs/1811.00102, 2018. [Online]. Available: http://arxiv.org/abs/1811.00102
work page internal anchor Pith review Pith/arXiv arXiv 2018
-
[35]
S. S. Skiena, “Weighted Graph Algorithms,” in The Algorithm Design Manual. Springer, 2012, pp. 191–229
work page 2012
-
[36]
M. Jacomy, T. Venturini, S. Heymann, and M. Bastian, “ForceAt- las2, a continuous graph layout algorithm for handy network visualization designed for the Gephi software,” PloS one , vol. 9, no. 6, p. e98679, 2014
work page 2014
-
[37]
An algorithm for drawing general undirected graphs,
T. Kamada, S. Kawai et al. , “An algorithm for drawing general undirected graphs,” Information processing letters, vol. 31, no. 1, pp. 7–15, 1989
work page 1989
-
[38]
Bourbaki, General Topology: Chapters 1–4
N. Bourbaki, General Topology: Chapters 1–4 . Springer Science & Business Media, 2013, vol. 18
work page 2013
-
[39]
Understanding Deep Neural Networks Using Topological Data Analysis
D. Goldfarb, “Understanding Deep Neural Networks Using Topological Data Analysis,” CoRR, vol. abs/1811.00852, 2018. [Online]. Available: http://arxiv.org/abs/1811.00852
work page internal anchor Pith review Pith/arXiv arXiv 2018
-
[40]
Topological data analysis and machine learning theory,
G. Carlsson, R. Jardine, D. Feichtner-Kozlov, D. Morozov, F. Chazal, V . de Silva, B. Fasy, J. Johnson, M. Kahle, G. Lerman et al., “Topological data analysis and machine learning theory,” in BIRS Workshop, Alberta, 2012
work page 2012
-
[41]
Defining and applying knowledge conversion pro- cesses to a visual analytics system,
X. Wang, D. H. Jeong, W. Dou, S.-w. Lee, W. Ribarsky, and R. Chang, “Defining and applying knowledge conversion pro- cesses to a visual analytics system,” Computers & Graphics, vol. 33, no. 5, pp. 616–623, 2009
work page 2009
- [42]
-
[43]
Computing communities in large net- works using random walks,
P . Pons and M. Latapy, “Computing communities in large net- works using random walks,” in International symposium on com- puter and information sciences. Springer, 2005, pp. 284–293
work page 2005
-
[44]
Graph Layout Performance Comparisons of Force-Directed Algorithms,
J. Hua, M. Huang, and G. Wang, “Graph Layout Performance Comparisons of Force-Directed Algorithms,” International Journal of Performability Engineering, 2018
work page 2018
-
[45]
Traffic state information by sections of the city of Barcelona - Open Data Barcelona
“Traffic state information by sections of the city of Barcelona - Open Data Barcelona.” https://opendata-ajuntament.barcelona. cat/data/en/dataset/trams, accessed: 2019-02-20
work page 2019
-
[46]
Traffic calming in Av. Prncep dAstries
“Traffic calming in Av. Prncep dAstries.” https: //ajuntament.barcelona.cat/guardiaurbana/en/noticia/ traffic-calming-in-av-princep-dasturies 562824, accessed: 2019- 02-20
work page 2019
-
[47]
“Open data Castile and Le ´on,” https://datosabiertos.jcyl.es/ web/es/datos-abiertos-castilla-leon.html, accessed: 2019-02-20
work page 2019
-
[48]
Production of atmospheric nitrous oxide by combustion,
R. Weiss and H. Craig, “Production of atmospheric nitrous oxide by combustion,” Geophysical Research Letters, vol. 3, no. 12, pp. 751– 753, 1976
work page 1976
-
[49]
Achieving low-carbon heating and cooling through electrification,
“Achieving low-carbon heating and cooling through electrification,” hhttps://setis.ec.europa.eu/ setis-reports/setis-magazine/low-carbon-heating-cooling/ achieving-low-carbon-heating-and-cooling, accessed: 2019-02-20
work page 2019
-
[50]
S. Rodrıguez, X. Querol, A. Alastuey, M.-M. Viana, M. Alarcon, E. Mantilla, and C. Ruiz, “Comparative PM10–PM2. 5 source contribution study at rural, urban and industrial sites during PM episodes in Eastern Spain,” Science of the Total Environment , vol. 328, no. 1-3, pp. 95–113, 2004
work page 2004
-
[51]
Diesel passenger car PM emissions: From Euro 1 to Euro 4 with particle filter,
T. Tzamkiozis, L. Ntziachristos, and Z. Samaras, “Diesel passenger car PM emissions: From Euro 1 to Euro 4 with particle filter,” Atmospheric Environment, vol. 44, no. 7, pp. 909–916, 2010
work page 2010
-
[52]
On the spatial distribution and seasonal variation of lower- troposphere ozone over Europe,
H. Scheel, H. Areskoug, H. Geiss, B. Gomiscek, K. Granby, L. Haszpra, L. Klasinc, D. Kley, T. Laurila, A. Lindskog et al. , “On the spatial distribution and seasonal variation of lower- troposphere ozone over Europe,” Journal of Atmospheric Chemistry, vol. 28, no. 1-3, pp. 11–28, 1997
work page 1997
-
[53]
M. Vedrenne, R. Borge, J. Lumbreras, B. Conlan, M. E. Rodr ´ıguez, J. M. de Andr ´es, D. de la Paz, J. P ´erez, and A. Narros, “An inte- grated assessment of two decades of air pollution policy making in Spain: Impacts, costs and improvements,” Science of the Total Environment, vol. 527, pp. 351–361, 2015
work page 2015
-
[54]
Visualizing large knowledge graphs: A performance analysis,
J. G ´omez-Romero, M. Molina-Solana, A. Oehmichen, and Y. Guo, “Visualizing large knowledge graphs: A performance analysis,” Future Generation Computer Systems, vol. 89, pp. 224–238, 2018
work page 2018
-
[55]
Community detection in networks: A user guide,
S. Fortunato and D. Hric, “Community detection in networks: A user guide,” Physics reports, vol. 659, pp. 1–44, 2016
work page 2016
- [56]
-
[57]
Gephi: an open source software for exploring and manipulating networks,
M. Bastian, S. Heymann, and M. Jacomy, “Gephi: an open source software for exploring and manipulating networks,” in Third international AAAI conference on weblogs and social media , 2009
work page 2009
-
[58]
Approximation of Distances and Shortest Paths in the Broadcast Congest Clique
S. Holzer and N. Pinsker, “Approximation of distances and shortest paths in the broadcast congest clique,” arXiv preprint arXiv:1412.3445, 2014
work page internal anchor Pith review Pith/arXiv arXiv 2014
discussion (0)
Sign in with ORCID, Apple, or X to comment. Anyone can read and Pith papers without signing in.