pith. sign in

arxiv: 1907.07475 · v2 · pith:C6GJN2GOnew · submitted 2019-07-17 · 💻 cs.SI · cs.CY· physics.soc-ph

Computational Human Dynamics

Pith reviewed 2026-05-24 20:02 UTC · model grok-4.3

classification 💻 cs.SI cs.CYphysics.soc-ph
keywords network sciencebursty human dynamicstemporal networkscollective social phenomenasocial contagionhuman dynamicscomputational social science
0
0 comments X

The pith

This thesis summarises the author's contributions to bursty human dynamics, temporal networks, and collective social phenomena.

A machine-rendered reading of the paper's core claim, the machinery that carries it, and where it could break.

The thesis compiles scientific contributions across network science, human dynamics, and computational social science. It organises these into sections on heterogeneous timing in human actions, methods for representing and modelling time-varying networks, and data-driven studies of socioeconomic inequalities linked to communication patterns and social contagion. A sympathetic reader would care because the synthesis offers a unified view of how temporal structures shape collective social processes.

Core claim

The thesis summarises contributions to bursty human dynamics that address heterogeneous temporal characters of human actions and interactions, contributions to temporal networks that include representation, characterisation, and modelling of time-varying structures, and works on collective social phenomena that cover static observations of socioeconomic inequalities and their correlations with social-communication networks and linguistic patterns, together with dynamic observations and modelling of social contagion processes.

What carries the argument

The three-chapter organisation that groups contributions on bursty human dynamics, temporal networks, and collective social phenomena.

Load-bearing premise

That the selected prior works are the most interesting and representative advances in the domain and that their synthesis yields a useful field perspective.

What would settle it

A check against the author's full publication record that shows major works on temporal network characterisation are omitted from the summary would indicate the perspective is incomplete.

Figures

Figures reproduced from arXiv: 1907.07475 by M\'arton Karsai.

Figure 2.1
Figure 2.1. Figure 2.1: (a) Sequence of earthquakes with magnitude larger than two at a single location (south of Chishima Island, 8th–9th October 1994). (b) Firing sequence of a single neuron from a rat’s hippocampal. (c) Outgoing mobile phone call sequence of an individual. The shorter the time between the consecutive events are, the darker colour is coded. This figure was published in [177]. Bursty patterns have been found t… view at source ↗
Figure 2.2
Figure 2.2. Figure 2.2: Schematic diagram of an event sequence, where each vertical line indicates the timing of an event. The inter-event time τ is the time interval between two consecutive events. The residual time τr is the time interval from a random moment (e.g., the timing annotated by the vertical arrow) to the next event. This figure was published in [175]. observations of an event sequence always cover a finite period … view at source ↗
Figure 2.3
Figure 2.3. Figure 2.3: The characteristic functions calculated for heterogeneous independent signals. (a) P(τ), A(td) and P(E) functions for α = 1.5. Solid line is a power-law function with the given α exponent value, while dashed line denotes a a power-law function with an effective 0.5 exponent value. (b) A(td) effective autocorrelation functions for various α exponents. Straight lines are denoting power-law functions with α… view at source ↗
Figure 2.4
Figure 2.4. Figure 2.4: Schematic diagram of an event sequence, where each vertical line indicates the timing of the event. For a given time window ∆t, a bursty train is determined by a set of events separated by τ ≤ ∆t, while events in different trains are separated by τ > ∆t. The number of events in each bursty train, i.e., bursty train size, is denoted by E. This figure was published in [175]. the number of events, E, that b… view at source ↗
Figure 2.5
Figure 2.5. Figure 2.5: The bursty train size distribution P∆t(E) with various time windows ∆t (main panels), the inter￾event time distribution P(τ) (left bottom panels), and autocorrelation functions A(td) (right bottom panels) for different human communication datasets such as (a) Mobile phone call dataset: The scale-invariant behaviour was characterised by power-law functions with exponent values γ ' 0.5, β ' 4.1, and α ' 0.… view at source ↗
Figure 2
Figure 2. Figure 2: Distributions P(BT ) of the original and rescaled burstiness of individual users with the same strength (left) and distributions P(1BT ) of the difference in burstiness, defined as 1BT = BT ￾ B0 (right). Individual users with the strengths si = 200 (a), 400 (b), 800 (c) and 1600 (d) are analyzed. The numbers of users are correspondingly 6397, 1746, 196 and 7. si = 3197, the burstiness decays faster as T in… view at source ↗
Figure 3
Figure 3. Figure 3: Burstiness BT as a function of the period T : (a) the average and the standard deviation of BT obtained from the burstiness distribution in figure 2, (b) burstiness from groups with the same strength and (c) burstiness from groups with a broad range of strengths. 2.2. De-seasoning groups of individuals with the same strength Here we analyze the group of individual users with the same strength, i.e. 3s ⌘ {i… view at source ↗
Figure 1
Figure 1. Figure 1: De-seasoning MPC patterns of individual users: the original and the rescaled event rates with a period of T = 1 day (left) and the original and the rescaled inter-event time distributions with various periods of T (right). Individual users with the strength si = 200 (a), 400 (b), 800 (c), 1600 (d) and 3197 (e) are analyzed. The original inter-event time distribution of the whole population is also plotted … view at source ↗
Figure 2.8
Figure 2.8. Figure 2.8: (a) Inter-event time distributions of edge addition (blue squares) and deletion (red circles) events of users. The straight line indicates a power-law function with exponent α = 0.85. (b,c) Distribution of number of events in bursty trains of (b) contact addition and (c) deletion of individuals. Distributions were calculated with time window sizes ∆t = 1, 2, 4, 8, 16 and 32 days. Distributions for random… view at source ↗
Figure 2.9
Figure 2.9. Figure 2.9: Groups of contact addition patterns, where the av￾erage number of ha(tu)ic new contacts added (red), hd(tu)ic connected days (blue), and hs(tu)ic days used Skype-to￾Skype service at the actual month are shown. Left vertical axe is the added contact num￾ber, right axe is in days. This figure was prepared by R. Kikas and published in [185]. So far we have observed that edge addition and deletion events of … view at source ↗
Figure 2.10
Figure 2.10. Figure 2.10: (a) Overall activity of the ego (green) and its neighbours (e1, e2, e3). Darker colour scales with call number per hour. (b,c) In- (red) and outgoing (blue) calls with length of the corresponding calls. (d) P(E) distributions of outgoing calls of nodes towards all the neighbours (solid lines) and to single neighbours (dashed lines) for various ∆t (in second) using the original and inter-event time shuff… view at source ↗
Figure 2.10
Figure 2.10. Figure 2.10: g shows p(E) and p indep(E) for both voice calls and SMS messages. Interestingly, large difference is observed between p(E) and the corresponding p indep(E) measures. It suggests that call trains (red points) are more unbalanced than one would expect from the overall communi￾cation balance of the link, caputured by the independent processes (yellow circles). At the same time for SMS the contrary is true… view at source ↗
Figure 2.11
Figure 2.11. Figure 2.11: Fig.2.11.a, we find that the best fit (red line) offers an excellent agreement with the empirical data [PITH_FULL_IMAGE:figures/full_fig_p044_2_11.png] view at source ↗
Figure 2.11
Figure 2.11. Figure 2.11: Fig.2.11.f), which can be characterised with an exponent [PITH_FULL_IMAGE:figures/full_fig_p046_2_11.png] view at source ↗
Figure 2.12
Figure 2.12. Figure 2.12: (a) Illustrative definition of the communication balance model, simulating events between two nodes A and B. The dynamics and direction of the events are determined by probabilities p(n), pA(n) and pB(n) defined in the text. (b) P(E) distributions of empirical call trains (red circles) with ∆t = 600s on edges with 0.5 ≤ be < 0.55 and in corresponding model trains (black circles). The same functions are … view at source ↗
Figure 3.1
Figure 3.1. Figure 3.1: Dynamics of a mobile call network. Panels (a), and (b) show calls over 3 hours between people in the same town at two different time stamps. Panel (c) presents the backgrounding weighted social network structure, which was recorded by aggregating interactions evolved between people during 6 months. Node size and colours describe the activity of users, while link width and colour represent weight. This fi… view at source ↗
Figure 3
Figure 3. Figure 3: ). Taking interactions as static links between nodes subsequently entails that information [PITH_FULL_IMAGE:figures/full_fig_p050_3.png] view at source ↗
Figure 3.2
Figure 3.2. Figure 3.2: Relative times-scales of network dynamics as compared to the time-scale of observations. and die and social ties are created and broken but all being present for longer periods lasting for several observations. Other examples are the internet, or other infrastructure networks. Once the observation frequency closely matches the temporal scale on which the network is evolving we arrive to temporal networks… view at source ↗
Figure 7
Figure 7. Figure 7: FIG. 7: a) The degree distribution and b) the weight increases with increasing window duration, reaching a maximum at [PITH_FULL_IMAGE:figures/full_fig_p054_7.png] view at source ↗
Figure 3
Figure 3. Figure 3: show that at the early times of the observation, those edges appear mostly which participate 025 [PITH_FULL_IMAGE:figures/full_fig_p055_3.png] view at source ↗
Figure 3.4
Figure 3.4. Figure 3.4: show that at the early times of the observation, those edges appear mostly which participate in triangles in the final aggregated network (coloured in red). These edges are the ones forming communities and clusters. On the other hand, not all intra-community edges are discovered early on; rather, those links that appear early are associated with communities with a high probability. 0 10 20 30 40 50 60 t … view at source ↗
Figure 7
Figure 7. Figure 7: FIG. 7: a) The degree distribution and b) the weight distri mical Social Networks [PITH_FULL_IMAGE:figures/full_fig_p055_7.png] view at source ↗
Figure 6
Figure 6. Figure 6: FIG. 6: Series of aggregated networks with a growing aggre question here i [PITH_FULL_IMAGE:figures/full_fig_p055_6.png] view at source ↗
Figure 3.5
Figure 3.5. Figure 3.5: The dynamical social networks are composed by different dynamically changing groups of interacting agents. In panel (a) we allow only for groups of size one or two as it typically happens in mobile phone communication. In panel (b) we allow for groups of any size as in face-to-face interactions. (c) Mean-field evaluation of the entropy of the dynamical social networks of phone calls communication in a ty… view at source ↗
Figure 3.6
Figure 3.6. Figure 3.6: (a) Fraction of infected nodes hi(t)/Ni as a function of time for the original event sequence and null models. (b) Distribution of full prevalence times P(tf) due to randomness in initial conditions. This figure was published in [170]. effects on spreading speed [265, 92], while a fat-tailed degree distribution has been shown to be an accelerating property [310]. Second, in weighted networks, the relatio… view at source ↗
Figure 3.7
Figure 3.7. Figure 3.7: (a) An example temporal network with event list Et of six events. With ∆t=40 there are two maximal subgraphs, shown in (b). (c) Valid subgraphs contained in the maximal subgraph in (b). In addition to these the maximal subgraph itself and all unit subgraphs are valid subgraphs. (c) Event sets that are contained in (b) but are not valid subgraphs: the upper one because it does not include all consecutive … view at source ↗
Figure 3.8
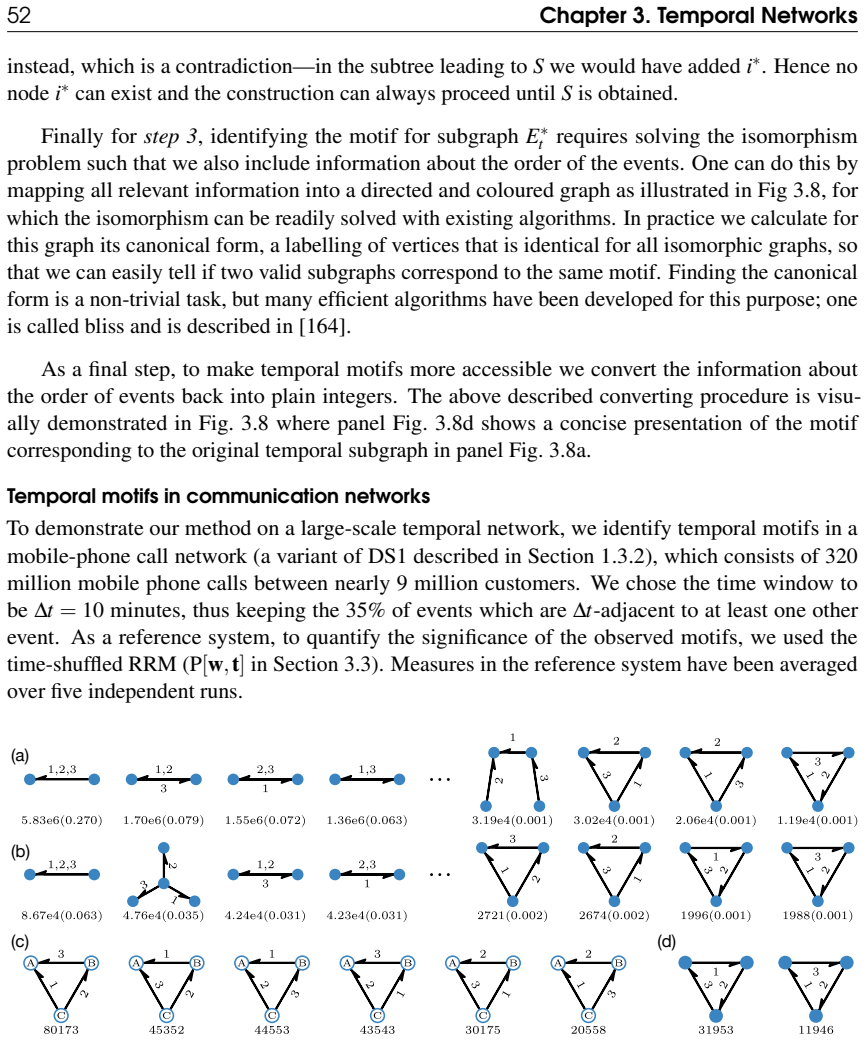
Figure 3.8. Figure 3.8: Illustration of the algorithm for identifying temporal motifs. (a) A valid subgraph E ∗ t with three events. (b) A vertex is created for each event and edges are added to connect them to the corresponding nodes. Colours are used to distinguish between the two types of vertices; the labels of the event vertices are arbitrary. (c) Directed edges are created between event vertices to denote their order. A c… view at source ↗
Figure 3.9
Figure 3.9. Figure 3.9: (a,b)The four most common (on the left) and least common (on the right) motifs in (a) the empirical data, and (b) unbiased time-shuffled random reference model. The values below each motif denote the total count and, in parenthesis, the fraction out of all motifs with three events. (c,d) The two different kinds of directed triangle motifs with three events. Both groups have been ordered by count in the e… view at source ↗
Figure 3.10
Figure 3.10. Figure 3.10: Constructing and thresholding the weighted event graph. a) The time line of a temporal network with four nodes v1 −v4 and five events e1 −e5. b) The weighted event graph representation of the temporal network. c) The thresholded event graph, containing only pairs of events with a maximum time difference of ∆t = 2. This figure was published in [189] and partially prepared by J. Saramäki. Constructing the… view at source ↗
Figure 3.11
Figure 3.11. Figure 3.11: Phase diagrams for the random temporal network model as a function of the average network degree k and the maximum waiting time between events, ∆t. The colour maps show the (ensemble-averaged) relative size ρ∗(k,∆t) of the giant weakly connected components, measured as (a) the number of events in the event graph components SE, (b) the number of temporal-network nodes that the largest event graph compone… view at source ↗
Figure 3.12
Figure 3.12. Figure 3.12: Panels (a), and (d) plot the degree distributions; panels (b), and (e) plot the weight distributions; and panels (c), and (f) plot the activity distributions of the empirical and modelled networks (respectively). Grey symbols are the original while coloured symbols are the corresponding logarithmic binned distributions. In panels (d-f) solid lines assign distributions induced by the reinforced process, … view at source ↗
Figure 3.13
Figure 3.13. Figure 3.13: Emergent structure and rumour spreading processes in (a) ML and (b) RP activity-driven networks. Node colours describe their states as ignorant (blue), spreader (red) and stifler (yellow). Node sizes, colour, and width of edges represent the corresponding degrees and weights. The parameters of the simulations are the same for the two processes: N = 300, T = 900, λ = 1.0, and α = 0.6. The processes were … view at source ↗
Figure 3.14
Figure 3.14. Figure 3.14: The rescaled hn(at)i curves for selected nodes classes belonging to the (a) PRB , (b) PRL, (c) TWT, and (d) MPN datasets. The time of the original data (symbols) is rescaled with the activity value t → at. We also show the fitting curve hn(t)i ∝ t 1/1+β (blue solid lines) and the expected asymptotic behaviour (black dashed lines). In the MPN case (d) we fit using β = βmin = 1.2. (e-h) The degree distrib… view at source ↗
Figure 3.15
Figure 3.15. Figure 3.15: The evolution of (a) the average degree hki(t) and (b) clustering coefficient C as the function of time and deletion probability pd (for exact values, see legend). Panel (c) and (d) depicts the P(k) degree and P(w) weight distributions (respectively) of model networks with varying δ values. Panel (e) shows the dependence of the average local clustering coefficient C on the parameter δ, while emerging we… view at source ↗
Figure 4.1
Figure 4.1. Figure 4.1: (a) The cumulative average monthly purchase (AMP) function CP(f) (blue line) and the schematic demonstration of user partitions into 9 socioeconomic classes. Fraction of individuals belonging to a given class (x axis) have the same sum of AMP (∑u Pu)/n (y axis) for each class. (b) Number of egos (blue), and the average AMP hPi per individual (pink) in different classes. (c) Average age of different class… view at source ↗
Figure 4.2
Figure 4.2. Figure 4.2: Structural correlations in the socioeconomic network (a) Chord diagram of connectedness of socioeconomic classes si , where each segment represents a social class si connected by chords with width proportional to the corresponding inter-class link fraction L˜ si (sj), and using gradient colours matched with opposite ends sj . Note that the L˜ si (sj) = L(si ,sj)/Σsj L(si ,sj) normalised fraction of L(si … view at source ↗
Figure 4.3
Figure 4.3. Figure 4.3: Distributions and correlations of socioeconomic indicators and linguistic variables. (a) Spatial distribution of average income in France with 200m×200m resolution. (b) Pairwise correlations between three SES indicators and three linguistic markers. Columns correspond to SES indicators (resp. S i inc, S i own, S i den), while rows correspond to linguistic variables (resp. Lcn, Lcp and Lvs). On each plot … view at source ↗
Figure 4.4
Figure 4.4. Figure 4.4: Geographical and network variability of linguistic markers. (a) Variability of the rate of correct negation in France. Inset focuses on larger Paris. Plot depicts variability on the department level except the inset which is on the "arrondissements" level. (b-d) Distribution of the |L u ∗ −L v ∗ | absolute difference of linguistic variables ∗ ∈ {cn, cp, vs} (resp. panels (b), (c), and (d)) of user pairs … view at source ↗
Figure 4.5
Figure 4.5. Figure 4.5: Empirical rates and probabilities for Switzerland. (a) Thin curves denote empirical rates of adoption [Ra(t)], termination [Rt(t)], and net adoption [Rn(t)], while symbols are their corresponding binned values. A binned data point in [2T,3T] has been removed due to systematic bias in Rt(t) caused by a major software update during this period. A shaded (white) area indicates the training (predicted) perio… view at source ↗
Figure 4.6
Figure 4.6. Figure 4.6: Structure and dynamics of online service adoption. (a) Yearly maximum relative growth rate (RGR) of cumulative adoption [174] for several online social-communication services [341], including three Skype paid services (s1 - "subscription", s2 - "voicemail", and s3 - "buy credit"). The red bar corresponds to a rapid cascade of adoption suggested by the Watts threshold (WT) model, while the green bar is th… view at source ↗
Figure 4.7
Figure 4.7. Figure 4.7: Schematic summary of compartment models of epidemic spreading. interactions between nodes. Solution in this case was built on a degree decomposition method [263], which introduces classes of statistically equivalent nodes of degree k in the description. This idea lead to the seminal result that degree heterogeneities decrease the critical point of epidemics leading to a vanishing infection threshold in s… view at source ↗
Figure 4.8
Figure 4.8. Figure 4.8: Panels a, b, and c show the phase space of an SIS process under random, targeted, and egocentric control strategy, respectively. Considering N = 104 , m = 3, ε = 10−3 , activity distributed as F(a) ∼ a −2.2 , we plot I∞ as a function of β/µ and p. Red curves represent the critical value pc. Panel d shows the comparison of the stationary state of a SIS model with and without control strategy, I p ∞/I 0 ∞,… view at source ↗
Figure 4.9
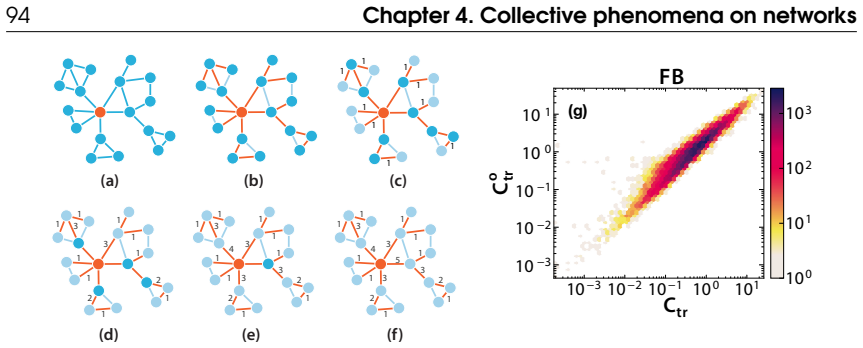
Figure 4.9. Figure 4.9: Calculation of transmission centrality of links. (a) A network with a randomly selected seed node; (b) the branching tree rooted from the initial seed (root and edges in the tree are coloured in red); (c) for each leaf edge in the branching tree increase the counter by 1; (d)-(f) remove leafs and increase the counter of their ascendant by the counter of the removed leafs. (g) Correlation heat-map plot be… view at source ↗
Figure 4.10
Figure 4.10. Figure 4.10: Schematic summary of (non-)adopter types and threshold driven transitions in complex contagion processes. Colours assign states of nodes as white-susceptible, blue-adopter and orange-blocked. While the relevance of the Watts’ model is indisputable [332, 118, 333, 117, 116, 115, 347, 292], its limitations become clear from real social spreading data. The Watts model focuses on the (instantaneous) emergen… view at source ↗
Figure 4
Figure 4. Figure 4: a and b) [PITH_FULL_IMAGE:figures/full_fig_p114_4.png] view at source ↗
Figure 4.11
Figure 4.11. Figure 4.11: (a-b) Surface plot of the normalised fraction of adopters ρ/(1−r) in (φ,z)-space, for r = 0.73 and t = 89. Contour lines signal the parameter values for which 20% of non-immune nodes have adopted, for fixed r and varying time (a), and for fixed time and varying r (b). The continuous contour line and dot indicate parameter values of the last observation of Skype s3. A regime of maximal adoption (ρ ≈ 1−r)… view at source ↗
Figure 4.12
Figure 4.12. Figure 4.12: (a) Average size of the largest (LC) and 2nd largest (LC2nd) components of the model network (‘Net’), adoption network (‘Casc’), stable network (‘Stab’), and induced vulnerable trees (‘Vuln’) as a function of r. Dashed lines show the observed relative size of the real LC of the adopter network in 2011 and the predicted r value. (b) Distribution P(d) of depths of induced vulnerable trees in both data and… view at source ↗
Figure 4.13
Figure 4.13. Figure 4.13: Relative time of threshold driven cascades on weighted networks. (a) Relative time tr of cascade emergence on (σ,φ)-parameter space, simulated over k-regular regular networks (k = 7) with µ = 1, δ = 0.5, p = 2 × 10⁻⁴ , N = 104 and averaged over 25 realisations. (b-c) Selected regions of parameter space in (a), where tr is instead calculated from the numerical solution of the AME systems in Eq. 4.31. Bou… view at source ↗
read the original abstract

This thesis summarises my scientific contributions in the domain of network science, human dynamics and computational social science. These contributions are associated to computer science, physics, statistics, and applied mathematics. The goal of this thesis is twofold, on one hand to write a concise summary of my most interesting scientific contributions, and on the other hand to provide an up-to-date view and perspective about my field. I start my dissertation with an introduction to position the reader on the landscape of my field and to put in perspective my contributions. In the second chapter I concentrate on my works on bursty human dynamics, addressing heterogeneous temporal characters of human actions and interactions. Next, I discuss my contributions to the field of temporal networks and give a synthesises of my works on various methods of the representation, characterisation, and modelling of time-varying structures. Finally, I discuss my works on the data-driven observations and modelling of collective social phenomena. There, I summarise studies on the static observations of emergent patterns of socioeconomic inequalities and their correlations with social-communication networks, and with linguistic patterns. I also discuss dynamic observations and modelling of social contagion processes.

Editorial analysis

A structured set of objections, weighed in public.

Desk editor's note, referee report, simulated authors' rebuttal, and a circularity audit. Tearing a paper down is the easy half of reading it; the pith above is the substance, this is the friction.

Referee Report

0 major / 0 minor

Summary. The manuscript is a thesis that summarises the author's contributions to network science, human dynamics and computational social science. It begins with an introduction positioning the work in the field, followed by a chapter on bursty human dynamics addressing heterogeneous temporal characters of human actions and interactions, a synthesis of contributions to temporal networks covering representation, characterisation and modelling of time-varying structures, and a final chapter on data-driven observations and modelling of collective social phenomena including static patterns of socioeconomic inequalities correlated with social-communication networks and linguistic patterns as well as dynamic social contagion processes.

Significance. If the self-summaries of prior works are accurate, the thesis offers a cohesive retrospective overview and field perspective on computational human dynamics. Its primary value is synthetic rather than deductive, compiling advances across physics, computer science and applied mathematics without introducing new derivations, parameter-free results or falsifiable predictions.

Simulated Author's Rebuttal

1 responses · 0 unresolved

We thank the referee for their assessment of the thesis manuscript. The report correctly identifies the work as a synthetic compilation of prior contributions rather than a source of new derivations or predictions; this aligns with the stated goals in the abstract and introduction. We address the significance comment below. No major comments were enumerated in the report.

read point-by-point responses
  1. Referee: If the self-summaries of prior works are accurate, the thesis offers a cohesive retrospective overview and field perspective on computational human dynamics. Its primary value is synthetic rather than deductive, compiling advances across physics, computer science and applied mathematics without introducing new derivations, parameter-free results or falsifiable predictions.

    Authors: We confirm that the self-summaries accurately reflect the cited prior works. The thesis is intentionally synthetic: its twofold goal, as stated in the abstract, is to concisely summarise the most interesting contributions and to provide an up-to-date perspective on the field. No new derivations or predictions were intended; the value lies in the retrospective synthesis and field positioning. revision: no

Circularity Check

0 steps flagged

No significant circularity in retrospective thesis compilation

full rationale

This document is a doctoral thesis summarizing the author's prior contributions across bursty human dynamics, temporal networks, and collective social phenomena. It contains no new derivations, equations, predictions, or modeling steps whose validity depends on internal fits or self-citations. The text is explicitly positioned as a concise retrospective overview and field perspective, with all technical content deferred to previously published works. No load-bearing assumption or claim reduces by construction to its own inputs, satisfying the criteria for a self-contained compilation without circularity.

Axiom & Free-Parameter Ledger

0 free parameters · 0 axioms · 0 invented entities

No free parameters, axioms, or invented entities are introduced because the document is a retrospective summary of prior work rather than a new theoretical or empirical study.

pith-pipeline@v0.9.0 · 5717 in / 1001 out tokens · 32603 ms · 2026-05-24T20:02:13.265847+00:00 · methodology

discussion (0)

Sign in with ORCID, Apple, or X to comment. Anyone can read and Pith papers without signing in.

Reference graph

Works this paper leans on

300 extracted references · 300 canonical work pages · 5 internal anchors

  1. [1]

    https://www.mturk.com

    Amazon Mechanical Turk. https://www.mturk.com. Accessed: 2018-01-17

  2. [2]

    https://arxiv.org

    arXiv.org. https://arxiv.org. Accessed: 2018-01-17

  3. [3]

    General data protection regulation, regulation 2016/679 by the european comission

  4. [4]

    http://www.kdd.org

    SigKDD. http://www.kdd.org. Accessed: 2018-01-17

  5. [5]

    https://www.surveymonkey.com

    SurveyMonkey. https://www.surveymonkey.com. Accessed: 2018-01-17

  6. [6]

    Accessed: 2013.07.15

    Internet world stats, 2011. Accessed: 2013.07.15

  7. [7]

    Bureau of transportation statistics, 2017

  8. [8]

    Socioeconomic dependencies of linguistic patterns in twitter: A multivariate analysis

    Jacob Levy Abitbol, Márton Karsai, Jean-Philippe Magué, Jean-Pierre Chevrot, and Eric Fleury. Socioeconomic dependencies of linguistic patterns in twitter: A multivariate analysis. In Proceedings of the 2018 World Wide Web Conference on World Wide Web, pages 1125–

  9. [9]

    International World Wide Web Conferences Steering Committee, 2018

  10. [10]

    Introduction to percolation theory

    Amnon Aharony and Dietrich Stauffer. Introduction to percolation theory. Taylor & Francis, 2003

  11. [11]

    Class structure

    T Akhbar-Williams. Class structure. In JC Smith, editor, Encyclopedia of African American Popular Culture. Greenwood, 2010

  12. [12]

    Topology of evolving networks: local events and universality

    Réka Albert and Albert-László Barabási. Topology of evolving networks: local events and universality. Physical review letters, 85(24):5234, 2000

  13. [13]

    Statistical mechanics of complex networks.Reviews of modern physics, 74(1):47, 2002

    Réka Albert and Albert-László Barabási. Statistical mechanics of complex networks.Reviews of modern physics, 74(1):47, 2002

  14. [14]

    Daily rhythms in mobile telephone communication

    Talayeh Aledavood, Eduardo López, Sam GB Roberts, Felix Reed-Tsochas, Esteban Moro, Robin IM Dunbar, and Jari Saramäki. Daily rhythms in mobile telephone communication. PloS one, 10(9):e0138098, 2015. 114 BIBLIOGRAPHY

  15. [15]

    User-based representation of time-resolved multimodal public transportation networks

    Laura Alessandretti, Márton Karsai, and Laetitia Gauvin. User-based representation of time-resolved multimodal public transportation networks. Royal Society open science , 3(7):160156, 2016

  16. [16]

    West, and Paolo Paradisi

    Paolo Allegrini, Danilo Menicucci, Remo Bedini, Leone Fronzoni, Angelo Gemignani, Paolo Grigolini, Bruce J. West, and Paolo Paradisi. Spontaneous brain activity as a source of ideal $1/f$ noise. Phys. Rev. E, 80:061914+, December 2009

  17. [17]

    Altmann, Janet B

    Eduardo G. Altmann, Janet B. Pierrehumbert, and Adilson E. Motter. Beyond word fre- quency: Bursts, lulls, and scaling in the temporal distributions of words. PLoS ONE, 4(11):e7678+, November 2009

  18. [18]

    Entropy measures for networks: Toward an information theory of complex topologies

    Kartik Anand and Ginestra Bianconi. Entropy measures for networks: Toward an information theory of complex topologies. Physical Review E, 80(4):045102, 2009

  19. [19]

    Poissonian bursts in e-mail correspon- dence

    C Anteneodo, R Dean Malmgren, and DR Chialvo. Poissonian bursts in e-mail correspon- dence. The European Physical Journal B, 75(3):389–394, 2010

  20. [20]

    Distinguishing influence-based contagion from homophily-driven diffusion in dynamic networks.Proceedings of the National Academy of Sciences, 106(51):21544–21549, 2009

    Sinan Aral, Lev Muchnik, and Arun Sundararajan. Distinguishing influence-based contagion from homophily-driven diffusion in dynamic networks.Proceedings of the National Academy of Sciences, 106(51):21544–21549, 2009

  21. [21]

    Un nouveau regard sur la chute du ne en français parlé tourangeau: s’ agit-il d’un changement en cours? Journal of French Language Studies, 11(1):1–22, 2001

    William J Ashby. Un nouveau regard sur la chute du ne en français parlé tourangeau: s’ agit-il d’un changement en cours? Journal of French Language Studies, 11(1):1–22, 2001

  22. [22]

    The dissemination of culture: A model with local convergence and global polarization

    Robert Axelrod. The dissemination of culture: A model with local convergence and global polarization. Journal of conflict resolution, 41(2):203–226, 1997

  23. [23]

    D. Ayala. Temporal percolation in the Erdös-Rényi model and the effect of burstiness. PhD thesis, University of Oxford, 2015

  24. [24]

    Effects of temporal correlations on cascades: Threshold models on temporal networks

    Ville-Pekka Backlund, Jari Saramäki, and Raj Kumar Pan. Effects of temporal correlations on cascades: Threshold models on temporal networks. Physical Review E, 89(6):062815, 2014

  25. [25]

    Group formation in large social networks: membership, growth, and evolution

    Lars Backstrom, Dan Huttenlocher, Jon Kleinberg, and Xiangyang Lan. Group formation in large social networks: membership, growth, and evolution. In Proceedings of the 12th ACM SIGKDD international conference on Knowledge discovery and data mining, pages 44–54. ACM, 2006

  26. [26]

    How nature works : the science of self-organized criticality

    Per Bak. How nature works : the science of self-organized criticality. Copernicus, 1996

  27. [27]

    Unified Scaling Law for Earthquakes

    Per Bak, Kim Christensen, Leon Danon, and Tim Scanlon. Unified Scaling Law for Earthquakes. Phys. Rev. Lett., 88:178501, 2002

  28. [28]

    The role of social networks in information diffusion

    Eytan Bakshy, Itamar Rosenn, Cameron Marlow, and Lada Adamic. The role of social networks in information diffusion. In Proceedings of the 21st international conference on World Wide Web, pages 519–528. ACM, 2012

  29. [29]

    The role of hidden influentials in the diffusion of online information cascades

    Raquel A Baños, Javier Borge-Holthoefer, and Yamir Moreno. The role of hidden influentials in the diffusion of online information cascades. EPJ Data Science, 2(1):6, 2013

  30. [30]

    The origin of bursts and heavy tails in human dynamics

    Albert-László Barabási. The origin of bursts and heavy tails in human dynamics. Nature, 435(7039):207–211, 2005. BIBLIOGRAPHY 115

  31. [31]

    Emergence of scaling in random networks

    Albert-László Barabási and Réka Albert. Emergence of scaling in random networks. science, 286(5439):509–512, 1999

  32. [32]

    The Dynamics of Social Contagion

    Vladimir Barash. The Dynamics of Social Contagion. PhD thesis, Cornell University, Ithaca, NY , USA, 2011. AAI3485091

  33. [33]

    The architecture of complex weighted networks

    Alain Barrat, Marc Barthelemy, Romualdo Pastor-Satorras, and Alessandro Vespignani. The architecture of complex weighted networks. Proceedings of the national academy of sciences, 101(11):3747–3752, 2004

  34. [34]

    Dynamical processes on complex networks

    Alain Barrat, Marc Barthelemy, and Alessandro Vespignani. Dynamical processes on complex networks. Cambridge university press, 2008

  35. [35]

    High resolution dynamical mapping of social interactions with active RFID

    Alain Barrat, Ciro Cattuto, Vittoria Colizza, Jean-François Pinton, Wouter Van den Broeck, and Alessandro Vespignani. High resolution dynamical mapping of social interactions with active rfid.arXiv preprint arXiv:0811.4170, 2008

  36. [36]

    Human evolutionary psychology

    Louise Barrett, Robin Dunbar, and John Lycett. Human evolutionary psychology. Princeton University Press, 2002

  37. [37]

    Spatial networks

    Marc Barthélemy. Spatial networks. Physics Reports, 499(1):1–101, 2011

  38. [38]

    A new product growth for model consumer durables

    Frank M Bass. A new product growth for model consumer durables. Management science, 15(5):215–227, 1969

  39. [39]

    Communication patterns in task-oriented groups.The Journal of the Acoustical Society of America, 22(6):725–730, 1950

    Alex Bavelas. Communication patterns in task-oriented groups.The Journal of the Acoustical Society of America, 22(6):725–730, 1950

  40. [40]

    The entropy of randomized network ensembles

    Ginestra Bianconi. The entropy of randomized network ensembles. EPL (Europhysics Letters), 81(2):28005, 2007

  41. [41]

    L’orthographe de tous les jours: enquête sur les pratiques or- thographiques des français, volume 4

    Jacqueline Billiez. L’orthographe de tous les jours: enquête sur les pratiques or- thographiques des français, volume 4. Honoré Champion, 1994

  42. [42]

    A survey of results on mobile phone datasets analysis

    Vincent D Blondel, Adeline Decuyper, and Gautier Krings. A survey of results on mobile phone datasets analysis. EPJ Data Science, 4(1):10, 2015

  43. [43]

    The structure and dynamics of multilayer networks

    Stefano Boccaletti, Ginestra Bianconi, Regino Criado, Charo I Del Genio, Jesús Gómez- Gardenes, Miguel Romance, Irene Sendina-Nadal, Zhen Wang, and Massimiliano Zanin. The structure and dynamics of multilayer networks. Physics Reports, 544(1):1–122, 2014

  44. [44]

    Bollobás and P

    B. Bollobás and P. Erd˝os. Graph theory and combinatorics: proceedings of the Cambridge combinatorial conference in honour of Paul Erdös. Academic Press, Cambridge, 1984

  45. [45]

    S. P. Borgatti. Centrality and network flow. Soc Netw, 27, 2005

  46. [46]

    Cascading behaviour in complex socio-technical networks

    Javier Borge-Holthoefer, Raquel A Baños, Sandra González-Bailón, and Yamir Moreno. Cascading behaviour in complex socio-technical networks. Journal of Complex Networks, 1(1):3–24, 2013

  47. [47]

    Structural and dynamical patterns on online social networks: the spanish may 15th movement as a case study

    Javier Borge-Holthoefer, Alejandro Rivero, Iñigo García, Elisa Cauhé, Alfredo Ferrer, Darío Ferrer, David Francos, David Iniguez, María Pilar Pérez, Gonzalo Ruiz, et al. Structural and dynamical patterns on online social networks: the spanish may 15th movement as a case study. PloS one, 6(8):e23883, 2011. 116 BIBLIOGRAPHY

  48. [48]

    Crises and collective socio-economic phenomena: Simple models and challenges

    Jean-Philippe Bouchaud. Crises and collective socio-economic phenomena: Simple models and challenges. Journal of Statistical Physics, 151(3-4):567–606, 2013

  49. [49]

    Distinction: A social critique of the judgment of taste (r

    Pierre Bourdieu. Distinction: A social critique of the judgment of taste (r. nice, trans.), 1984

  50. [50]

    George E. P. Box, Gwilym M. Jenkins, and Gregory C. Reinsel. Time series analysis : forecasting and control. John Wiley, 4 edition, June 2008

  51. [51]

    Crofoot, and Peter D

    Denis Boyer, Margaret C. Crofoot, and Peter D. Walsh. Non-random walks in monkeys and humans. Journal of The Royal Society Interface, 9(70):842–847, May 2012

  52. [52]

    U. Brandes. A faster algorithm for betweenness centrality. J Math Sociol, 25, 2001

  53. [53]

    Brin and L

    S. Brin and L. Page. The anatomy of a large-scale hypertextual web search engine. Comput Netw ISDN Syst, 30, 1998

  54. [54]

    Social class and status

    Keith Brown. Social class and status. In Keith Brown, editor, Concise encyclopedia of pragmatics. Elsevier, 2009

  55. [55]

    Suppressing cascades of load in interdependent networks

    Charles D Brummitt, Raissa M D’Souza, and Elizabeth A Leicht. Suppressing cascades of load in interdependent networks. Proceedings of the National Academy of Sciences , 109(12):E680–E689, 2012

  56. [56]

    Amazon’s mechanical turk: A new source of inexpensive, yet high-quality, data? Perspectives on psychological science, 6(1):3–5, 2011

    Michael Buhrmester, Tracy Kwang, and Samuel D Gosling. Amazon’s mechanical turk: A new source of inexpensive, yet high-quality, data? Perspectives on psychological science, 6(1):3–5, 2011

  57. [57]

    Decision field theory: a dynamic-cognitive approach to decision making in an uncertain environment

    Jerome R Busemeyer and James T Townsend. Decision field theory: a dynamic-cognitive approach to decision making in an uncertain environment. Psychological review, 100(3):432, 1993

  58. [58]

    Collective response to perturbations in a data-driven fish school model

    Daniel S Calovi, Ugo Lopez, Paul Schuhmacher, Hugues Chaté, Clément Sire, and Guy Theraulaz. Collective response to perturbations in a data-driven fish school model. Journal of The Royal Society Interface, 12(104):20141362, 2015

  59. [59]

    New directions in sociolinguistic cognition

    Kathryn Campbell-Kibler. New directions in sociolinguistic cognition. University of Pennsylvania Working Papers in Linguistics, 15(2):5, 2010

  60. [60]

    Statistical physics of social dynamics

    Claudio Castellano, Santo Fortunato, and Vittorio Loreto. Statistical physics of social dynamics. Reviews of modern physics, 81(2):591, 2009

  61. [61]

    The spread of behavior in an online social network experiment

    Damon Centola. The spread of behavior in an online social network experiment. science, 329(5996):1194–1197, 2010

  62. [62]

    An experimental study of homophily in the adoption of health behavior

    Damon Centola. An experimental study of homophily in the adoption of health behavior. Science, 334(6060):1269–1272, 2011

  63. [63]

    Complex contagions and the weakness of long ties

    Damon Centola and Michael Macy. Complex contagions and the weakness of long ties. American journal of Sociology, 113(3):702–734, 2007

  64. [64]

    Big data: A survey

    Min Chen, Shiwen Mao, and Yunhao Liu. Big data: A survey. Mobile Networks and Applications, 19(2):171–209, 2014

  65. [65]

    Chlebus and W

    E. Chlebus and W. Ludwin. Is handoff traffic really Poissonian? In Proceedings of ICUPC ’95 - 4th IEEE International Conference on Universal Personal Communications , pages 348–353. IEEE, 1995. BIBLIOGRAPHY 117

  66. [66]

    Keras (2015), 2017

    François Chollet et al. Keras (2015), 2017

  67. [67]

    Power-law distributions in empirical data

    Aaron Clauset, Cosma Rohilla Shalizi, and Mark EJ Newman. Power-law distributions in empirical data. SIAM review, 51(4):661–703, 2009

  68. [68]

    Complex networks: structure, robustness and function

    Reuven Cohen and Shlomo Havlin. Complex networks: structure, robustness and function. Cambridge university press, 2010

  69. [69]

    Efficient immunization strategies for computer networks and populations

    Reuven Cohen, Shlomo Havlin, and Daniel Ben-Avraham. Efficient immunization strategies for computer networks and populations. Physical review letters, 91(24):247901, 2003

  70. [70]

    Jolles, Alain Farron, and Kamiar Aminian

    Brian Coley, Brigitte M. Jolles, Alain Farron, and Kamiar Aminian. Arm position during daily activity. Gait & posture, 28(4):581–587, November 2008

  71. [71]

    Detecting rich-club ordering in complex networks

    Vittoria Colizza, Alessandro Flammini, M Angeles Serrano, and Alessandro Vespignani. Detecting rich-club ordering in complex networks. Nature physics, 2(2):110, 2006

  72. [72]

    Reaction–diffusion processes and metapopulation models in heterogeneous networks

    Vittoria Colizza, Romualdo Pastor-Satorras, and Alessandro Vespignani. Reaction–diffusion processes and metapopulation models in heterogeneous networks. Nature Physics, 3(4):276, 2007

  73. [73]

    Invasion threshold in heterogeneous metapopu- lation networks

    Vittoria Colizza and Alessandro Vespignani. Invasion threshold in heterogeneous metapopu- lation networks. Physical review letters, 99(14):148701, 2007

  74. [74]

    Introduction to algorithms

    Thomas H Cormen, Charles E Leiserson, Ronald L Rivest, and Clifford Stein. Introduction to algorithms. MIT press, 2009

  75. [75]

    Long-term clustering, scaling, and universality in the temporal occurrence of earthquakes

    Álvaro Corral. Long-term clustering, scaling, and universality in the temporal occurrence of earthquakes. Physical Review Letters, 92:108501+, March 2004

  76. [76]

    Elements of information theory 2nd edition

    Thomas M Cover and Joy A Thomas. Elements of information theory 2nd edition. Willey- Interscience: NJ, 2006

  77. [77]

    The spread of ideas in a weighted threshold network

    Scott Cox, KJ Horadam, and Asha Rao. The spread of ideas in a weighted threshold network. In International Workshop on Complex Networks and their Applications, pages 437–447. Springer, 2016

  78. [78]

    Epidemic modelling: an introduction, volume 15

    Daryl J Daley and Joe Gani. Epidemic modelling: an introduction, volume 15. Cambridge University Press, 2001

  79. [79]

    Epidemics and rumours

    Daryl J Daley and David G Kendall. Epidemics and rumours. Nature, 204(4963):1118, 1964

  80. [80]

    Earthquake interevent time distribution for induced micro-, nano-, and picoseismicity

    Jörn Davidsen and Grzegorz Kwiatek. Earthquake interevent time distribution for induced micro-, nano-, and picoseismicity. Physical Review Letters, 110:068501+, February 2013

Showing first 80 references.