Statistical multiscale mapping of IDH1, MGMT, and microvascular proliferation in human brain tumors from multiparametric MR and spatially-registered core biopsy
Pith reviewed 2026-05-24 15:37 UTC · model grok-4.3
The pith
Five MR contrasts plus registered biopsies yield full-brain statistical maps of IDH1, MGMT, and microvascular proliferation at 98 percent accuracy.
A machine-rendered reading of the paper's core claim, the machinery that carries it, and where it could break.
Core claim
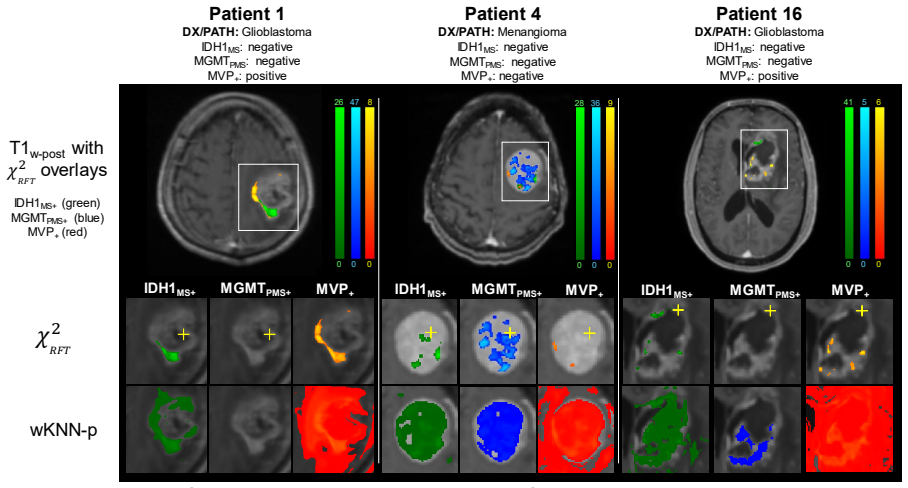
The combination of all five image contrasts correlated with outcome (P < .001) for all four microscopic variables. The probabilistic mapping method using Benjamini-Hochberg generated statistically significant results (P < .05) for IDH1, MGMT, and microvascular proliferation, with an average classification accuracy of 0.984 +/- 0.02 and an average classification sensitivity of 1.567% +/- 0.967. Images corrected by random field theory demonstrated improved classification accuracy (0.989 +/- 0.008) and classification sensitivity (5.967% +/- 2.857).
What carries the argument
Probabilistic mapping that converts leave-one-out classifier probabilities to chi-square statistics, then applies family-wise error correction via Benjamini-Hochberg or Gaussian random field theory to produce whole-brain parametric maps.
If this is right
- All five MR contrasts together supply statistically significant predictive power for IDH1, MGMT, microvascular proliferation, and the fourth microscopic variable.
- Benjamini-Hochberg corrected maps reach 98.4 percent average accuracy for the three significant markers.
- Random field theory correction raises average accuracy to 98.9 percent and raises sensitivity roughly fourfold.
- Microscopic and molecular tumor properties become assessable across the entire brain volume from a single minimally invasive mp-MR exam.
Where Pith is reading between the lines
- The maps could be used to select the safest or most informative biopsy targets before surgery.
- Heterogeneity revealed by the maps might guide spatially targeted therapies such as focused radiation or drug delivery.
- Extending the same registration-plus-classifier pipeline to longitudinal scans could track treatment response at the molecular level without repeated biopsies.
Load-bearing premise
Stereotactic bitmaps acquired during surgery register biopsy core locations to pre-surgical MR voxels with enough spatial precision to serve as ground truth for the voxel-wise feature matrices.
What would settle it
Acquire new biopsies at brain locations whose maps predict high versus low probability for a given marker and test whether the observed pathology matches the predicted class at rates above chance.
Figures


read the original abstract
We propose a statistical multiscale mapping approach to identify microscopic and molecular heterogeneity across a tumor microenvironment using multiparametric MR (mp-MR). Twenty-nine patients underwent pre-surgical mp-MR followed by MR-guided stereotactic core biopsy. The locations of the biopsy cores were identified in the pre-surgical images using stereotactic bitmaps acquired during surgery. Feature matrices mapped the multiparametric voxel values in the vicinity of the biopsy cores to the pathologic outcome variables for each patient and logistic regression tested the individual and collective predictive power of the MR contrasts. A non-parametric weighted k-nearest neighbor classifier evaluated the feature matrices in a leave-one-out cross validation design across patients. Resulting class membership probabilities were converted to chi-square statistics to develop full-brain parametric maps, implementing Gaussian random field theory to estimate inter-voxel dependencies. Corrections for family-wise error rates were performed using Benjamini-Hochberg and random field theory, and the resulting accuracies were compared. The combination of all five image contrasts correlated with outcome (P<.001) for all four microscopic variables. The probabilistic mapping method using Benjamini-Hochberg generated statistically significant results (P<.05) for three of the four dependent variables: 1) IDH1, 2) MGMT, and 3) microvascular proliferation, with an average classification accuracy of 0.984 +/- 0.02 and an average classification sensitivity of 1.567% +/- 0.967. The images corrected by random field theory demonstrated improved classification accuracy (0.989 +/- 0.008) and classification sensitivity (5.967% +/- 2.857) compared with Benjamini-Hochberg. Microscopic and molecular tumor properties can be assessed with statistical confidence across the brain from minimally-invasive, mp-MR.
Editorial analysis
A structured set of objections, weighed in public.
Referee Report
Summary. The manuscript proposes a statistical multiscale mapping pipeline that registers stereotactic biopsy cores to pre-surgical multiparametric MR voxels in 29 patients, constructs feature matrices from the five MR contrasts, applies logistic regression to test collective predictive power, and uses weighted kNN in leave-one-out cross-validation to generate full-brain parametric maps of IDH1 mutation, MGMT methylation, and microvascular proliferation. Class-membership probabilities are converted to chi-square statistics, corrected for multiple comparisons via Benjamini-Hochberg or random-field theory, and the resulting maps are claimed to achieve P < .05 significance for three of four microscopic variables with mean classification accuracy 0.984 ± 0.02.
Significance. If the registration accuracy and statistical controls hold, the approach would constitute a rare attempt to produce voxel-wise, statistically thresholded maps of molecular and histologic tumor features directly from routine mp-MR, potentially reducing the need for invasive sampling and enabling spatially resolved treatment planning. The leave-one-out design across patients and the explicit comparison of two multiple-testing corrections are positive methodological choices; however, the extremely low reported sensitivities (1.567 % and 5.967 %) alongside near-perfect accuracies point to severe class imbalance that must be addressed before clinical utility can be assessed.
major comments (3)
- [Methods, biopsy registration] Methods (biopsy registration paragraph): the claim that stereotactic bitmaps provide ground-truth voxel labels rests on an unvalidated assumption of sub-voxel registration precision; no quantitative measure of alignment error, no correction for brain shift between pre-op MR and intra-operative sampling, and no sensitivity analysis on label noise are reported. If mean registration error exceeds the 1–2 mm voxel size, the feature matrices are spatially mislabeled and all downstream P-values and accuracies become uninterpretable.
- [Abstract; Results] Abstract and Results: the reported average classification sensitivity of 1.567 % ± 0.967 % (BH) and 5.967 % ± 2.857 % (RFT) is orders of magnitude below the stated accuracy (0.984), which is only possible under extreme class imbalance; the manuscript provides no description of how class imbalance was handled, how the positive class was defined, or the exact formula used for the chi-square statistic derived from class probabilities.
- [Methods, statistical analysis] Statistical methods: feature selection procedure, neighborhood size for the feature matrix, and the precise definition of the weighted kNN distance metric are not specified, yet these choices directly affect the leave-one-out performance and the subsequent parametric maps; the post-hoc comparison of Benjamini-Hochberg versus random-field-theory corrections without a pre-specified primary analysis further weakens the statistical claims.
minor comments (2)
- [Abstract] The abstract states that “the combination of all five image contrasts correlated with outcome (P < .001) for all four microscopic variables,” yet only three variables reach significance after correction; clarify whether the fourth variable (presumably the remaining microscopic feature) was tested and why it is omitted from the significance statement.
- [Methods] Notation for the chi-square conversion step and the exact implementation of Gaussian random-field theory for inter-voxel dependence should be given explicitly, preferably with an equation or pseudocode.
Simulated Author's Rebuttal
We thank the referee for the detailed and constructive review. We address each major comment below, indicating revisions where appropriate.
read point-by-point responses
-
Referee: [Methods, biopsy registration] Methods (biopsy registration paragraph): the claim that stereotactic bitmaps provide ground-truth voxel labels rests on an unvalidated assumption of sub-voxel registration precision; no quantitative measure of alignment error, no correction for brain shift between pre-op MR and intra-operative sampling, and no sensitivity analysis on label noise are reported. If mean registration error exceeds the 1–2 mm voxel size, the feature matrices are spatially mislabeled and all downstream P-values and accuracies become uninterpretable.
Authors: We agree this is a limitation. The manuscript relies on stereotactic bitmaps for localization without reporting quantitative alignment error or performing sensitivity analysis for brain shift. In the revised manuscript we will add an explicit limitations paragraph on this point and include a sensitivity analysis that perturbs biopsy labels within a 1–2 mm radius to quantify impact on downstream accuracies and P-values. revision: yes
-
Referee: [Abstract; Results] Abstract and Results: the reported average classification sensitivity of 1.567 % ± 0.967 % (BH) and 5.967 % ± 2.857 % (RFT) is orders of magnitude below the stated accuracy (0.984), which is only possible under extreme class imbalance; the manuscript provides no description of how class imbalance was handled, how the positive class was defined, or the exact formula used for the chi-square statistic derived from class probabilities.
Authors: The low sensitivity relative to accuracy is a direct result of extreme class imbalance (positive voxels for IDH1 mutation, MGMT methylation, and microvascular proliferation are rare). No resampling or weighting was applied; models were trained on the observed distribution. The positive class is defined by the binary pathologic label from each biopsy core. Class probabilities from weighted kNN were converted to chi-square statistics for voxel-wise inference, but the precise conversion formula was omitted. We will add prevalence statistics, the positive-class definition, and the exact chi-square formula (derived from the complement of the class probability) to the methods section. revision: yes
-
Referee: [Methods, statistical analysis] Statistical methods: feature selection procedure, neighborhood size for the feature matrix, and the precise definition of the weighted kNN distance metric are not specified, yet these choices directly affect the leave-one-out performance and the subsequent parametric maps; the post-hoc comparison of Benjamini-Hochberg versus random-field-theory corrections without a pre-specified primary analysis further weakens the statistical claims.
Authors: We will specify these details in revision: no feature selection was performed (all five contrasts entered the matrix); neighborhood size was a 3-voxel radius; weighted kNN used Euclidean distance in feature space with inverse-distance weighting. The comparison of correction methods was exploratory. We will designate random-field theory as the primary analysis and present Benjamini-Hochberg as a secondary comparator, with this pre-specification stated in the revised statistical methods. revision: yes
Circularity Check
No significant circularity in the statistical mapping pipeline
full rationale
The paper's central results derive from logistic regression and kNN models trained on mp-MR voxel features paired with pathologic labels from 29 stereotactic biopsy cores, evaluated via leave-one-out cross-validation across patients. Class probabilities are then mapped to full-brain chi-square statistics with Gaussian random field corrections and Benjamini-Hochberg adjustment. No equations, self-citations, or ansatzes reduce the reported correlations (P<.001), accuracies (0.984), or significance maps directly to the input data by construction; the LOOCV design supplies an out-of-sample performance estimate, and the mapping step applies the fitted models rather than re-deriving them. The registration assumption is a methodological limitation but does not create definitional or fitted-input circularity.
Axiom & Free-Parameter Ledger
free parameters (2)
- k in weighted k-nearest neighbor
- feature matrix neighborhood size
axioms (2)
- domain assumption Stereotactic bitmaps provide accurate voxel-wise correspondence between biopsy locations and pre-surgical mp-MR images
- domain assumption Gaussian random field theory adequately models inter-voxel dependencies in the chi-square maps
Lean theorems connected to this paper
-
IndisputableMonolith/Cost/FunctionalEquation.leanwashburn_uniqueness_aczel unclear?
unclearRelation between the paper passage and the cited Recognition theorem.
The combination of all five image contrasts correlated with outcome (P<.001) for all four microscopic variables. The probabilistic mapping method using Benjamini-Hochberg generated statistically significant results (P<.05) for IDH1, MGMT, and microvascular proliferation, with average classification accuracy 0.984 +/- 0.02.
-
IndisputableMonolith/Foundation/AbsoluteFloorClosure.leanabsolute_floor_iff_bare_distinguishability unclear?
unclearRelation between the paper passage and the cited Recognition theorem.
The locations of the biopsy cores were identified in the pre-surgical images using stereotactic bitmaps acquired during surgery.
What do these tags mean?
- matches
- The paper's claim is directly supported by a theorem in the formal canon.
- supports
- The theorem supports part of the paper's argument, but the paper may add assumptions or extra steps.
- extends
- The paper goes beyond the formal theorem; the theorem is a base layer rather than the whole result.
- uses
- The paper appears to rely on the theorem as machinery.
- contradicts
- The paper's claim conflicts with a theorem or certificate in the canon.
- unclear
- Pith found a possible connection, but the passage is too broad, indirect, or ambiguous to say the theorem truly supports the claim.
Reference graph
Works this paper leans on
-
[1]
The role of targeted therapies in the management of progressive glioblastoma,
J. J. Olsen, L. Nayak, D. R. Ormond, P. Y. Wen, S. N. Kalkanis and T. C. Ryken, "The role of targeted therapies in the management of progressive glioblastoma," J Neurooncol, vol. 118, pp. 557-99, 2014
work page 2014
-
[2]
lntratumoral Histologic Heterogeneity of Gliomas: A Quantitative Study,
W. Paulus and J. Peiffer, "lntratumoral Histologic Heterogeneity of Gliomas: A Quantitative Study," Cancer, vol. 64, pp. 442-7, 1989
work page 1989
-
[3]
Intratumor Heterogeneity: Seeing the Wood for the Trees,
T. A. Yap, M. Gerlinger, P. A. Futreal, L. Pusztai and C. Swanton, "Intratumor Heterogeneity: Seeing the Wood for the Trees," Sci Transl Med, vol. 4, no. 127, p. 127ps10, 2012
work page 2012
-
[4]
Radiomics: Images are more than pictures, they are data,
R. J. Gilles, P. E. Kinahan and H. Hricak, "Radiomics: Images are more than pictures, they are data," Radiology, vol. 278, no. 2, pp. 563-77, 2016
work page 2016
-
[5]
Imaging and genomics: is there a synergy?,
C. C. Jaffe, "Imaging and genomics: is there a synergy?," Radiology, vol. 264, no. 2, pp. 329-31, 2012. 12
work page 2012
-
[6]
Radiogenomic mapping of edema/cellular invasion MRI-phenotypes in glioblastoma multiforme,
P. O. Zinn, B. Majadan, P. Sathyan, S. K. Singh, S. Majumder, F. A. Jolesz and R. R. Colen, "Radiogenomic mapping of edema/cellular invasion MRI-phenotypes in glioblastoma multiforme," PLoS one, vol. 6, no. 10, p. e25451, 2011
work page 2011
-
[7]
Identification of noninvasive imaging surrogates for brain tumor gene- expression modules,
M. Diehn, C. Nardini, D. S. Wang, S. McGovern, M. Jayaraman, Y. Liang, K. Aldape, S. Cha and M. D. Kuo, "Identification of noninvasive imaging surrogates for brain tumor gene- expression modules," Proc Natl Acad Sci USA, vol. 105, no. 13, pp. 5213-8, 2008
work page 2008
-
[8]
Relationship between Glioblastoma Heterogeneity and Survival Time: An MR Imaging Texture Analysis,
Y. Liu, X. Xu, L. Yin, X. Zhang, L. Li and H. Lu, "Relationship between Glioblastoma Heterogeneity and Survival Time: An MR Imaging Texture Analysis," Am. J. Neuroradiology, vol. 38, no. 9, pp. 1695-1701, 2017
work page 2017
-
[9]
LS Hu, S Ning, JM Eschbacher, N Gaw, AC Dueck, et al., "Multi-Parametric MRI and Texture Analysis to Visualize Spatial Histologic Heterogeneity and Tumor Extent in Glioblastoma," PLOS ONE, vol. 10, no. 11, p. e0141506, 2015
work page 2015
-
[10]
Assessment of tumor heterogeneity: an emerging imaging tool for clinical practice?,
F Davnall, CSP Yip, G Ljungqvist, M Selmi, F Ng, B Sanghera, B Ganeshan, KA Miles, GJ Cook, V Goh, "Assessment of tumor heterogeneity: an emerging imaging tool for clinical practice?," Insights into Imaging, vol. 3, no. 6, pp. 573-589, 2012
work page 2012
-
[11]
Whole-brain spectroscopic MRI biomarkers identify infiltrating margins in glioblastoma patients,
JS Cordova, HKG Shu, Z Liang, SS Gurbani, LAD Cooper, CA Holder, JJ Olson, B Kairdolf, E Schreibmann, SG Neill, CG Hadjipanayis, H Shim, "Whole-brain spectroscopic MRI biomarkers identify infiltrating margins in glioblastoma patients," Neuro-Oncology, vol. 18, no. 8, pp. 1180-89, 2016
work page 2016
-
[12]
C Choi, SK Ganji, RJ DeBerardinis, KJ Hatanpaa, D Rakheja, Z Kovacs, et al., "2- hydroxyglutarate detection by magnetic resonance spectroscopy in IDH-mutated patients with gliomas," Nature Medicine, vol. 18, pp. 624-29, 2012
work page 2012
-
[13]
I Park, S Hu, R Bok, et al., " Evaluation of heterogeneous metabolic profile in an orthotopic human glioblastoma xenograft model using compressed sensing hyperpolarized 3D 13C magnetic resonance spectroscopic imaging," Magn Reson Med, vol. 70, pp. 33-39, 2013
work page 2013
-
[14]
Magnetic Resonance Fingerprinting of Adult Brain Tumors: Initial Experience,
C Badve, A Yu, S Dastmalchian, M Rogers, D Ma, Y Jiang, et al., "Magnetic Resonance Fingerprinting of Adult Brain Tumors: Initial Experience," Amer J Neuroradiology, vol. 38, no. 3, pp. 492-99, 2017
work page 2017
-
[15]
PD Chang, H.R. Malone, X S.G. Bowden, X D.S. Chow, X B.J.A. Gill, X T.H. Ung, X J. Samanamud, X Z.K. Englander, et al. "A Multiparametric Model for Mapping Cellularity in Glioblastoma Using Radiographically Localized Biopsies," Am J Neurorad, 38(5), pp. 890- 98, 2017
work page 2017
-
[16]
Validation of functional diffusion maps (fDMs) as a biomarker for human glioma cellularity,
BM Ellingson, MG Malkin, SD Rand, JM Connelly, C Quinsey, PS LaViolette, DP Bedekar, KM Schmainda, “Validation of functional diffusion maps (fDMs) as a biomarker for human glioma cellularity,” J Magn Reson Imaging, vol 31(3), pp538-48, 2010
work page 2010
-
[17]
Magnetic resonance fingerprinting,
D Ma, V Gulani, N Seiberlich, K Liu, JL Sunshine, JL Duerk, MA Griswold, "Magnetic resonance fingerprinting," Nature, vol. 495, pp. 187-92, 2013
work page 2013
-
[18]
T Christen, N Pannetier, W Ni, D Qiu, M Moseley, N Schuff, G Zaharchuk, " MR Vascular Fingerprinting: A New Approach to Compute Cerebral Blood Volume, Mean Vessel Radius, and Oxygenation Maps in the Human Brain," NeuroImage, vol. 89, pp. 262-70, 2014
work page 2014
-
[19]
M Jenkinson, P Bannister, JM Brady, SM Smith, "Improved Optimisation for the Robust and Accurate Linear Registration and Motion Correction of Brain Images.," NeuroImage, vol. 17, no. 2, pp. 825-41, 2002
work page 2002
-
[20]
Accurate and robust brain image alignment using boundary-based registration,
B. F. DN Greve, "Accurate and robust brain image alignment using boundary-based registration," NeuroImage, vol. 48, no. 1, pp. 63-72, 2009. 13
work page 2009
-
[21]
Stata 14 Base Reference Manual.,
S. Corp., "Stata 14 Base Reference Manual.," College Station, 2015
work page 2015
-
[22]
Regression Models for Categorical Dependent Variables Using Stata,
J. Freese and J. S. Long, "Regression Models for Categorical Dependent Variables Using Stata," Stata Press, College Station, 2006
work page 2006
-
[23]
The Distance-Weighted k-Nearest-Neighbor Rule,
S. Dudani, "The Distance-Weighted k-Nearest-Neighbor Rule," IEEE Transactions on Systems, Man, and Cybernetics, vol. 6, no. 4, pp. 325-7, 1976
work page 1976
-
[24]
K. Pearson, "On the criterion that a given system of deviations from the probable in the case of a correlated system of variables is such that it can be reasonably supposed to have arisen from random sampling," vol. 50, no. 302, 1900
work page 1900
-
[25]
Controlling the false discovery rate: a practical and powerful approach to multiple testing,
Y. H. Y Benjamini, "Controlling the false discovery rate: a practical and powerful approach to multiple testing," Journal of the Royal Statistical Society, Series B, vol. 57, no. 1, pp. 289-300, 1995
work page 1995
-
[26]
Ch. 14 - An Introduction to Random Field Theory,
M Brett, W Penny, M Kiebel, "Ch. 14 - An Introduction to Random Field Theory," in Human Brain Function, 2nd Edition, Academic Press, 2003
work page 2003
-
[27]
Local maxima and the expected Euler characteristic of excursion sets of χ2, F and t fields,
K. Worsley, "Local maxima and the expected Euler characteristic of excursion sets of χ2, F and t fields," Adv. Appl. Probab., vol. 26, pp. 13-42, 1994
work page 1994
-
[28]
A unified statistical approach for determining significant signals in images of cerebral activation,
KJ Worsley, S Marrett, P Neelin, AC Vandal, KJ Friston, AC Evans, "A unified statistical approach for determining significant signals in images of cerebral activation," Hum. Brain Mapp., vol. 4, pp. 58-73, 1996
work page 1996
-
[29]
Bayesian analysis of neuroimaging data in FSL,
MW Woolrich, S Jbabdi, B Patenaude, M Chappell, S Makni, T Behrens, C Beckmann, M Jenkinson, SM Smith, "Bayesian analysis of neuroimaging data in FSL," NeuroImage, vol. 45, pp. 176-86, 2009
work page 2009
-
[30]
M Jenkinson, CF Beckmann, TE Behrens, MW Woolrich, SM Smith, "FSL," NeuroImage, vol. 62, pp. 782-90, 2012
work page 2012
-
[31]
N. R. Parker, A. L. Hudson, P. Khong, J. F. Parkinson, T. Dwight, R. J. Ikin, Y. Zhu, Z. J. Cheng, F. Vafaee, J. Chen, H. R. Wheeler and V. M. Howell, "Intratumoral heterogeneity identified at the epigenetic, genetic and transcriptional level in glioblastoma," vol. 6, no. 2247, 2016
work page 2016
-
[32]
MGMT Gene Silencing and Benefit from Temozolomide in Glioblastoma,
M. E. Hegi, A. C. Diserens, T. Gorlia, M. F. Hamou, N. d. Tribolet, M. Weller, J. M. Kros, J. A. Hainfellner, W. Mason, L. Mariani, J. E. Bromberg and P. Hau, "MGMT Gene Silencing and Benefit from Temozolomide in Glioblastoma," vol. 352, pp. 997-1003, 2005
work page 2005
-
[33]
Personalized treatment strategies in glioblastoma: MGMT promoter methylation status,
N. Thon, S. Kreth and F. W. Kreth, "Personalized treatment strategies in glioblastoma: MGMT promoter methylation status," Onco Targets Ther, vol. 6, pp. 1363-72, 2013
work page 2013
-
[34]
Vulnerabilities of radiomic signature development: The need for safeguards,
M. L. Welch, C. McIntosh, B. Haibe-Kains, M. F. Milosevic, L. Wee, A. Dekker, S. H. Huang, T. G. Purdie, B. O'sullivan, H. J. Aerts and D. A. Jaffray, "Vulnerabilities of radiomic signature development: The need for safeguards," vol. 130, pp. 2-9, 2019
work page 2019
-
[35]
Test-Retest Data for Radiomics Feature Stability Analysis: Generalizable or Study-Specific?,
J. E. van Timmeren, R. T. Leijenaar, W. van Elmpt, J. Wang, Z. Zhang, A. Dekker and P. Lambin, "Test-Retest Data for Radiomics Feature Stability Analysis: Generalizable or Study-Specific?," Tomography, vol. 2, no. 4, pp. 361-5, 2016. 14 Supplementary Materials Supplemental Table I. Mean ± standard deviation of sequence parameters across the 5 image contra...
work page 2016
discussion (0)
Sign in with ORCID, Apple, or X to comment. Anyone can read and Pith papers without signing in.