Micro-architectural Analysis of OLAP: Limitations and Opportunities
Pith reviewed 2026-05-24 16:20 UTC · model grok-4.3
The pith
High-performance OLAP engines spend 25 to 82 percent of CPU cycles on stalls and underutilize multi-core CPUs and memory bandwidth due to mismatched compute and memory demands.
A machine-rendered reading of the paper's core claim, the machinery that carries it, and where it could break.
Core claim
Traditional commercial OLAP systems exhibit large instruction footprints that slow response times yet do not suffer instruction cache misses. High-performance OLAP engines run tight instruction streams but still spend 25 to 82 percent of CPU cycles on stalls across both sequential- and random-access workloads. These same engines underutilize multi-core CPU resources and memory bandwidth because their compute and memory demands remain disproportional.
What carries the argument
Hardware performance counter measurements of CPU cycle breakdown, stall sources, and memory bandwidth utilization across multiple OLAP systems and query patterns.
If this is right
- Analytical engines must deliberately balance compute and memory resource assignment to achieve efficient multi-core utilization.
- Reducing stall cycles remains necessary even for engines that already use compact instruction streams.
- Workload access pattern (sequential versus random) does not alter the high stall percentage observed.
- Large instruction footprints in commercial OLAP systems continue to limit response times despite the absence of cache misses.
Where Pith is reading between the lines
- Designers of future column stores could explore tighter integration of compute and memory scheduling to close the observed utilization gap.
- The same measurement approach could be applied to emerging hardware such as persistent memory or accelerators to check whether the stall and bandwidth patterns persist.
- Query optimizers might incorporate stall and bandwidth models as cost factors once the disproportional demand pattern is confirmed across more systems.
Load-bearing premise
The specific OLAP systems, queries, and data sets measured are representative of production analytical workloads and the performance counters accurately reflect dominant bottlenecks.
What would settle it
Repeating the measurements on additional production OLAP engines or workloads that consistently show stall fractions below 25 percent or near-full memory bandwidth utilization would falsify the central claim.
Figures


read the original abstract
Understanding micro-architectural behavior is profound in efficiently using hardware resources. Recent work has shown that, despite being aggressively optimized for modern hardware, in-memory online transaction processing (OLTP) systems severely underutilize their core micro-architecture resources [25]. Online analytical processing (OLAP) workloads, on the other hand, exhibit a completely different computing pattern. OLAP workloads are read-only, bandwidth-intensive and include various data access patterns including both sequential and random data accesses. In addition, with the rise of column-stores, they run on high performance engines that are tightly optimized for the efficient use of modern hardware. Hence, the micro-architectural behavior of modern OLAP systems remains unclear. This work presents the micro-architectural analysis of a breadth of OLAP systems. We examine CPU cycles and memory bandwidth utilization. The results show that, unlike the traditional, commercial OLTP systems, traditional, commercial OLAP systems do not suffer from instruction cache misses. Nevertheless, they suffer from their large instruction footprint resulting in slow response times. High performance OLAP engines execute tight instruction streams; however, they spend 25 to 82% of the CPU cycles on stalls regardless of the workload being sequential- or random-access-heavy. In addition, high performance OLAP engines underutilize the multi-core CPU or memory bandwidth resources due to their disproportional compute and memory demands. Hence, analytical processing engines should carefully assign their compute and memory resources for efficient multi-core micro-architectural utilization.
Editorial analysis
A structured set of objections, weighed in public.
Referee Report
Summary. The paper presents an empirical micro-architectural analysis of multiple OLAP systems using hardware performance counters to measure CPU cycle stalls and memory bandwidth utilization. It claims that, unlike OLTP systems, OLAP engines do not suffer from instruction cache misses but incur slow response times from large instruction footprints; high-performance OLAP engines spend 25-82% of CPU cycles on stalls irrespective of sequential or random access patterns and underutilize multi-core CPUs and memory bandwidth due to disproportional compute and memory demands, recommending careful resource assignment for analytical engines.
Significance. If the measurements generalize, the work supplies concrete quantitative evidence of substantial resource underutilization in modern column-store OLAP engines, identifying opportunities for hardware-software co-design improvements in bandwidth-intensive analytical workloads. The direct use of hardware counters yields falsifiable stall-fraction observations that could guide future engine optimizations.
major comments (2)
- [Experimental Setup / Workload Selection] The central claim of a 25-82% stall range 'regardless of the workload being sequential- or random-access-heavy' (abstract) rests on the representativeness of the chosen OLAP engines, queries, and datasets. The experimental corpus must be shown to capture production instruction footprints, cache behavior, and bandwidth/compute balance; otherwise the attribution to 'disproportional compute and memory demands' does not necessarily extend beyond the measured instances.
- [Results / Quantitative Observations] No error bars, standard deviations, raw counter values, or repeated-run statistics accompany the reported stall fractions and utilization numbers (abstract and results). This absence prevents verification that the observed ranges are robust to measurement overhead, configuration artifacts, or post-hoc workload selection.
minor comments (2)
- [Abstract and Introduction] Clarify the distinction between 'traditional, commercial OLAP systems' and 'high performance OLAP engines' throughout the text to avoid ambiguity in the contrast with OLTP.
- [Methodology] Provide explicit definitions or references for the hardware performance counter events used to classify stalls and bandwidth utilization.
Simulated Author's Rebuttal
We thank the referee for the constructive feedback on our empirical analysis of OLAP micro-architectural behavior. We address each major comment below, indicating planned revisions where appropriate.
read point-by-point responses
-
Referee: [Experimental Setup / Workload Selection] The central claim of a 25-82% stall range 'regardless of the workload being sequential- or random-access-heavy' (abstract) rests on the representativeness of the chosen OLAP engines, queries, and datasets. The experimental corpus must be shown to capture production instruction footprints, cache behavior, and bandwidth/compute balance; otherwise the attribution to 'disproportional compute and memory demands' does not necessarily extend beyond the measured instances.
Authors: Our experiments cover multiple OLAP engines (both traditional row-stores and high-performance column-stores) and standard analytical benchmarks (TPC-H and Star Schema Benchmark) chosen specifically to include both sequential scan-heavy and random access patterns. These benchmarks are widely accepted as representative of production analytical workloads in the database literature. We will revise the manuscript to add an expanded discussion of workload selection criteria, including how the chosen queries exercise instruction footprints and cache behavior observed in the measured stall ranges. Direct reproduction of proprietary production traces is not possible, but the observed 25-82% stall range holds consistently across the selected corpus. revision: partial
-
Referee: [Results / Quantitative Observations] No error bars, standard deviations, raw counter values, or repeated-run statistics accompany the reported stall fractions and utilization numbers (abstract and results). This absence prevents verification that the observed ranges are robust to measurement overhead, configuration artifacts, or post-hoc workload selection.
Authors: We agree that the absence of statistical measures limits verifiability. Hardware counter readings were collected over repeated executions with stable system configurations to mitigate measurement artifacts, yet variance was not reported. In the revised version we will add error bars, standard deviations from multiple runs, and representative raw counter values for the key stall and bandwidth metrics to demonstrate robustness of the reported ranges. revision: yes
Circularity Check
Empirical measurement study; no derivation chain or self-referential reduction
full rationale
The paper reports direct hardware-counter observations (stall fractions 25-82%, bandwidth/CPU underutilization) on chosen OLAP engines and workloads. No equations, fitted parameters, or predictions are defined in terms of the reported quantities. The single citation to prior OLTP work [25] is external contrast, not load-bearing for the OLAP measurements. The work is self-contained against external benchmarks (hardware counters on specific systems) and does not reduce any result to its own inputs by construction.
Axiom & Free-Parameter Ledger
Reference graph
Works this paper leans on
-
[1]
Micro-architectural Analysis of OLAP: Limitations and Opportunities
INTRODUCTION Online analytical processing (OLAP) is an ever-growing, multi-billion dollar industry. Many industrial and commu- nity organizations rely on fast and efficient analytical pro- cessing to extract valuable information from their data. Un- derstanding micro-architectural behavior of OLAP systems, on the other hand, is profound in providing high pe...
work page internal anchor Pith review Pith/arXiv arXiv 1908
-
[2]
Benchmarks: We use micro-benchmarks and a subset of TPC-H queries [31]
SETUP & METHODOLOGY This section presents our experimental setup and method- ology. Benchmarks: We use micro-benchmarks and a subset of TPC-H queries [31]. We use projection, selection and join micro-benchmarks as they constitute the basic SQL opera- tors. All the systems use hash join algorithm when running the join micro-benchmark. We also performed a g...
work page 2018
-
[3]
VTune’s general- exploration provide full CPU cycles breakdown [26, 32]
analysis type for CPU cycles breakdown. VTune’s general- exploration provide full CPU cycles breakdown [26, 32]. We examine CPU cycles at two-levels. We firstly break down the CPU cycles into Retiring and Stall cycles. Retiring cy- cles represent the percentage of the useful cycles spent on retiring instructions. Stall cycles represent the percentage of th...
-
[4]
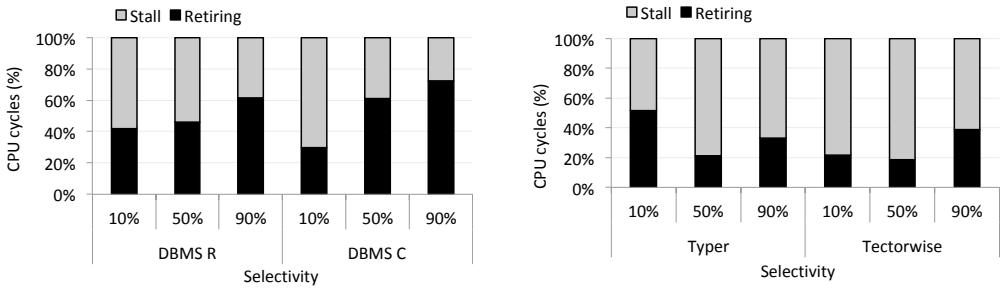
Our goal is to observe how the micro-architectural behavior changes as the projec- tivity increases
PROJECTION This section presents the micro-architectural analysis of the projection micro-benchmark. Our goal is to observe how the micro-architectural behavior changes as the projec- tivity increases. Figure 1 shows the CPU cycles breakdown for DBMS R and C. The figure shows that while DBMS R spends about half of the CPU cycles for Retiring, DBMS C spends...
-
[5]
SELECTION Having examined the projection, we now move to examin- ing the selection micro-benchmark. Our goal is to examine how influential the branch mispredictions stalls are on the micro-architectural behavior. Figure 7 shows the CPU cy- cles breakdown for DBMS R and C. We observe that the Re- tiring cycles ratio increases as the selectivity increases bo...
-
[6]
We force all the systems to use hash join algorithm
JOIN In this section, we examine the join micro-benchmark. We force all the systems to use hash join algorithm. Unlike the selection and projection micro-benchmarks with a sequential data access pattern, hash join includes many random data accesses. Our goal is to understand the effect of random data accesses in the overall micro-architectural behavior. Fi...
work page 2000
-
[7]
TPC-H Up to now, we have examined simple micro-benchmarks. In this section, we analyze four TPC-H queries: Q1, Q6 and Q9, Q18, each of which represents a particular class of queres: (i) Q1 is a low-cardinality group by (4 groups), (ii) Q6 is a highly selective filter, (iii) Q9 is a join-intensive query and (iv) Q18 is a high-cardinality group by (1.5 mil- ...
-
[8]
PREDICA TION In this section, we examine the predication optimization. Predication is used to eliminate branches. Its idea is to con- vert control dependencies to data dependencies by comput- ing the predicate as an arithmetic expression, and using it to increment the index/aggregation. The trade-off is doing more computation but avoid branches. Our goal i...
-
[9]
SIMD The second optimization we examine is SIMD. SIMD in- structions are used to reduce the number of instructions re- quired to perform arithmetic operations. We test Tector- wise when running the projection, selection and join micro- benchmarks with and without using the SIMD instructions. As our Broadwell server does not support AVX-512 instruc- tions,...
-
[10]
PREFETCHERS Section 3 and 7 have shown that the projection and pred- icated selection queries suffer from Dcache stalls. Both the projection and predicated selection queries are essentially sequential scans of the relevant columns with a highly pre- dictable data access pattern. Despite that, large Dcache stalls raise the question how useful hardware prefe...
-
[11]
Most OLAP operations scale well across multi- cores
MULTI-CORE EXECUTION We lastly examine the hardware utilization for multi-core execution. Most OLAP operations scale well across multi- cores. As a result, we do not expect a big difference in the micro-architectural behavior of the multi-core execu- tion compared to the single-core execution. We use the four TPC-H queries as they are more complex than the...
-
[12]
RELA TED WORK There is a large body of work on the micro-architectural analysis of database workloads. Ailamaki et al. [2] and Hardavellas et al. [7] present database workload charac- terization both for analytical and transactional workloads. Tozun et al. [29, 30] presents micro-architectural analysis of disk-based OLTP systems. Sirin et al. [25] present...
work page 2018
-
[13]
We examine CPU cycles and memory bandwidth utilizations
CONCLUSIONS In this work, we evaluate the micro-architectural behav- ior of a breadth of OLAP systems from different categories of systems and execution models. We examine CPU cycles and memory bandwidth utilizations. The results show that, unlike traditional, commercial OLTP systems, traditional, commercial OLAP systems do not suffer from instruction cache...
- [14]
-
[15]
A. Ailamaki, D. J. DeWitt, M. D. Hill, and D. A. Wood. DBMSs on a Modern Processor: Where Does Time Go? VLDB, pages 266–277, 1999
work page 1999
-
[16]
A. J. Awan, M. Brorsson, V. Vlassov, and E. Ayguade. Performance Characterization of 12 UNDER SUBMISSION In-Memory Data Analytics on a Modern Cloud Server. BDCloud, pages 1–8, 2015
work page 2015
-
[17]
A. J. Awan, M. Brorsson, V. Vlassov, and E. Ayguade. Micro-Architectural Characterization of Apache Spark on Batch and Stream Processing Workloads. BDCloud, pages 59–66, 2016
work page 2016
- [18]
-
[19]
M. Ferdman, A. Adileh, O. Kocberber, S. Volos, M. Alisafaee, D. Jevdjic, C. Kaynak, A. D. Popescu, A. Ailamaki, and B. Falsafi. Clearing the Clouds: A Study of Emerging Scale-out Workloads on Modern Hardware. ASPLOS, pages 37–48, 2012
work page 2012
-
[20]
N. Hardavellas, I. Pandis, R. Johnson, N. Mancheril, A. Ailamaki, and B. Falsafi. Database Servers on Chip Multiprocessors: Limitations and Opportunities. CIDR, pages 79–87, 2007
work page 2007
- [21]
-
[22]
Disclosure of Hardware Prefetcher Control on Some Intel Processors
Intel. Disclosure of Hardware Prefetcher Control on Some Intel Processors. https://software.intel.com/en-us/articles/disclosure- of-hw-prefetcher-control-on-some-intel-processors
-
[23]
Intel. Intel Memory Latency Checker. https://software.intel.com/en-us/articles/intelr- memory-latency-checker
-
[24]
Understanding How General Exploration Works in Intel VTune Amplifier, 2018
Intel. Understanding How General Exploration Works in Intel VTune Amplifier, 2018. https://software.intel.com/en- us/articles/understanding-how-general-exploration- works-in-intel-vtune-amplifier-xe
work page 2018
-
[25]
Intel(R) 64 and IA-32 Architectures Optimization Reference Manual, 2019
Intel. Intel(R) 64 and IA-32 Architectures Optimization Reference Manual, 2019
work page 2019
-
[26]
C. Jonathan, U. F. Minhas, J. Hunter, J. Levandoski, and G. Nishanov. Exploiting Coroutines to Attack the ”Killer Nanoseconds”. Proc. VLDB Endow. , 11(11):1702–1714, July 2018
work page 2018
- [27]
-
[28]
M. Karpathiotakis, I. Alagiannis, and A. Ailamaki. Fast Queries over Heterogeneous Data Through Engine Customization. Proc. VLDB Endow. , 9(12):972–983, Aug. 2016
work page 2016
-
[29]
A. Kemper and T. Neumann. Hyper: A hybrid oltp olap main memory database system based on virtual memory snapshots. ICDE, pages 195–206, 2011
work page 2011
-
[30]
T. Kersten, V. Leis, A. Kemper, T. Neumann, A. Pavlo, and P. Boncz. Everything You Always Wanted to Know About Compiled and Vectorized Queries but Were Afraid to Ask. Proc. VLDB Endow. , 11(13):2209–2222, Sept. 2018
work page 2018
-
[31]
T. Lahiri, S. Chavan, M. Colgan, D. Das, A. Ganesh, M. Gleeson, S. Hase, A. Holloway, J. Kamp, T. Lee, J. Loaiza, N. Macnaughton, V. Marwah, N. Mukherjee, A. Mullick, S. Muthulingam, V. Raja, M. Roth, E. Soylemez, and M. Zait. Oracle Database In-Memory: A Dual Format In-memory Database. ICDE, pages 1253–1258, 2015
work page 2015
- [32]
-
[33]
S. Manegold, P. A. Boncz, and M. L. Kersten. Optimizing Main-Memory Join on Modern Hardware. IEEE Trans. Knowl. Data Eng. , 14(4):709–730, 2002
work page 2002
-
[34]
G. Psaropoulos, T. Legler, N. May, and A. Ailamaki. Interleaving with Coroutines: A Practical Approach for Robust Index Joins. PVLDB, 11(2):230–242, 2017
work page 2017
-
[35]
G. Psaropoulos, T. Legler, N. May, and A. Ailamaki. Interleaving with Coroutines: A Systematic and Practical Approach to Hide Memory Latency in Index Joins. The VLDB Journal , Dec 2018
work page 2018
-
[36]
G. Psaropoulos, I. Oukid, T. Legler, N. May, and A. Ailamaki. Bridging the Latency Gap between NVM and DRAM for Latency-bound Operations. pages 13:1–13:8, 2019
work page 2019
-
[37]
V. Raman, G. Attaluri, R. Barber, N. Chainani, D. Kalmuk, V. KulandaiSamy, J. Leenstra, S. Lightstone, S. Liu, G. M. Lohman, T. Malkemus, R. Mueller, I. Pandis, B. Schiefer, D. Sharpe, R. Sidle, A. Storm, and L. Zhang. DB2 with BLU Acceleration: So Much More Than Just a Column Store. Proc. VLDB Endow. , 6(11):1080–1091, Aug. 2013
work page 2013
- [38]
- [39]
-
[40]
J. Sompolski, M. Zukowski, and P. A. Boncz. Vectorization vs. Compilation in Query Execution. Damon, pages 33–40, 2011
work page 2011
-
[41]
S. Sridharan and J. M. Patel. Profiling R on a Contemporary Processor. Proc. VLDB Endow. , 8(2):173–184, Oct. 2014
work page 2014
-
[42]
P. T¨ oz¨ un, B. Gold, and A. Ailamaki. OLTP in wonderland: Where do cache misses come from in major OLTP components? Damon, page 8, 2013
work page 2013
-
[43]
P. T¨ oz¨ un, I. Pandis, C. Kaynak, D. Jevdjic, and A. Ailamaki. From A to E: Analyzing TPC’s OLTP Benchmarks: The Obsolete, The Ubiquitous, The Unexplored. EDBT, pages 17–28, 2013
work page 2013
-
[44]
Transcation Processing Performance Council
TPC. Transcation Processing Performance Council. http://www.tpc.org/
-
[45]
A. Yasin. A Top-Down Method for Performance Analysis and Counters Architecture. ISPASS, pages 35–44, 2014
work page 2014
- [46]
discussion (0)
Sign in with ORCID, Apple, or X to comment. Anyone can read and Pith papers without signing in.