REVIEW 2 major objections 5 minor 1 cited by
A statistical study of lopsided galaxies using random forest
T0 review · 2 major / 5 minor · reviewed 2026-08-12 · deepseek-v4-flash
Pith's one-line read A random forest trained only on internal galaxy properties can pre-classify lopsided versus symmetric disk galaxies with 81% balanced accuracy, supporting the view that lopsidedness is mainly a tracer of internal structure.
desk verdict A useful random-forest preselection tool for lopsided galaxies, but the accuracy numbers are inflated by snapshot leakage and the physical conclusion overreaches without an environment baseline. read the letter →
The pith
A machine-rendered reading of the paper's core claim, the machinery that carries it, and where it could break.
The reading
What carries the argument
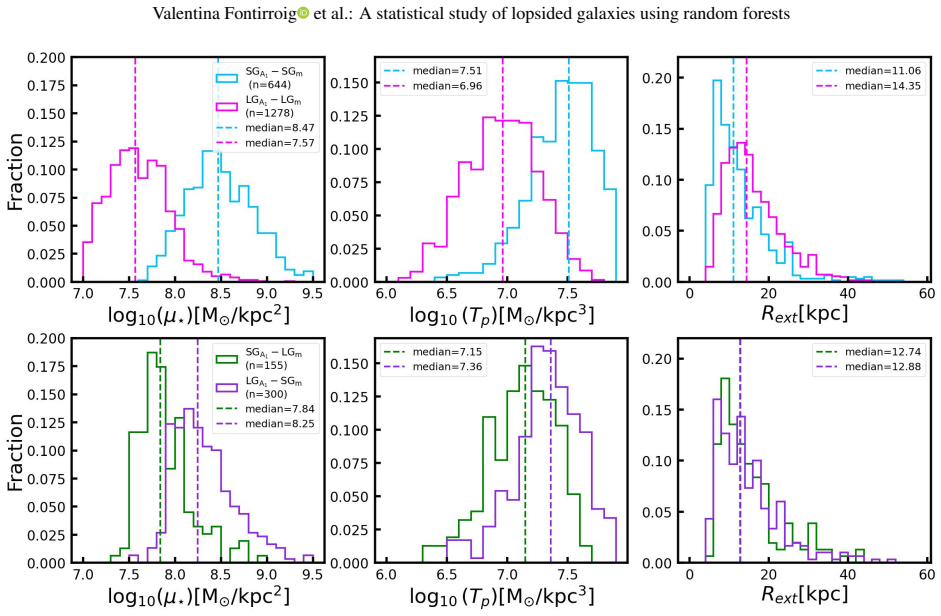
The load-bearing object is A1, the radially averaged amplitude of the m=1 mode of the stellar mass surface density, computed within a cylinder of width 1.4R90 and height 2h90 and averaged over the radial interval R50–1.4R90; galaxies with A1>0.1 are labeled lopsided. This Fourier label is the ground truth. The classifier is a random forest ensemble, with SMOTE oversampling used to balance the minority symmetric class, trained on ten internal parameters; permutation importance shows that central stellar mass density μ*, tidal parameter TP, and star formation rate carry most of the predictive signal, with μ* dominant. In the observable-feature variant, M50 is replaced by r-band luminosity within R50 and only R50, Rext, c/a, and SFR remain as inputs, while the training pipeline stays the same.
What would settle it
Retrain the identical SMOTE+RF pipeline using a galaxy-grouped split that keeps all snapshots of the same galaxy in the same fold, and measure balanced accuracy on held-out galaxies. If the grouped-split accuracy drops well below 0.81 (toward 0.5–0.6), the reported generalization is inflated by snapshot overlap. A complementary check is to run the trained classifier on an independent observed sample of disk galaxies whose A1 values are measured from imaging and to compare predicted versus actual labels.
Extended reading notes
Core claim
The paper's central claim is that the m=1 Fourier asymmetry A1, averaged over the radial interval R50–1.4R90 and thresholded at 0.1, can be predicted from a small set of internal galaxy parameters. On a held-out 30% of the TNG50 sample, the SMOTE+RF classifier reaches balanced accuracy 0.813±0.010, and substituting r-band luminosity and other photometric proxies for the mass-based features leaves the performance almost unchanged at 0.799±0.009. The authors interpret this as evidence that lopsidedness is primarily an internal-structure phenomenon, not a direct map of present-day environment. They also find that the model's errors cluster near the A1=0.1 threshold and are physically intelligible: some misclassifications have symmetric interiors with a recently tidally disturbed outer disk, while others have lopsided-prone interiors that are merely unperturbed at the current snapshot.
Load-bearing premise
The key load-bearing assumption is that randomly splitting the simulated galaxy snapshots into training and test sets gives independent samples, even though each galaxy reappears at multiple snapshots between z=0 and z=0.5; if later snapshots of a galaxy resemble the earlier ones used for training, the ~81% balanced accuracy could partly reflect memorization of individual systems rather than generalization to unseen galaxies.
Editorial extensions
If this is right
- Large multiband surveys can use the classifier as a fast preselection step, flagging lopsided candidates and limiting expensive Fourier decomposition or visual inspection to a smaller subset.
- The high accuracy with no environment features supports treating lopsidedness as a structural indicator, which simplifies theoretical interpretation of survey samples.
- The observable-feature version at ~80% balanced accuracy suggests the method transfers to photometric catalogs without stellar population or dynamical modeling of each galaxy.
- The misclassification structure implies the pre-selected sample will still be clean enough for statistical studies as long as borderline A1 cases are treated as a separate, low-confidence category.
Reading between the lines
- Because the paper's split is over snapshots, not over unique galaxies, and each TNG50 galaxy appears at several redshifts, a galaxy-grouped cross-validation is the natural next test; I would expect the true generalization accuracy for never-seen galaxies to be lower than the reported 0.813.
- The authors' own misclassification analysis suggests lopsidedness is partly a transient state: a galaxy can be structurally prone to lopsidedness but currently symmetric, or internally symmetric but temporarily lopsided after an interaction. Pushing this further, a single snapshot label mixes at least three physically distinct populations, so evolutionary conclusions drawn from pre-selected sample
- A testable extension would be to train the same pipeline separately on the three subsets defined by the misclassification analysis (recently perturbed, structurally prone, borderline) and check whether their feature distributions are separable; if they are, a three-class or regression formulation would be more informative than a binary preselector.
- For real photometric surveys, the simulation-trained model will face redshift-dependent surface brightness dimming, PSF dilution, and differences between simulated and observed SFR proxies; re-calibrating on a labeled observed subsample would be necessary before the reported ~80% accuracy is trusted on survey data.
Signed reviews
Editorial analysis
A structured set of objections, weighed in public.
Referee Report
Summary. The paper trains random forest classifiers on 7,919 late-type galaxy snapshots from TNG50, labeling each snapshot as lopsided or symmetric using the radial average of the m=1 Fourier amplitude A1 over the interval R50–1.4R90 with a threshold of 0.1. The authors compare two imbalance-handling approaches, SMOTE+RF and Balanced Random Forest, and report a balanced accuracy of 0.813±0.010 (Table 3), with similar performance (~0.799±0.009, Table 5) when using photometrically observable features (R50, Rext, c/a, SFR, L50). They interpret the high accuracy as evidence that lopsidedness is mainly a tracer of internal galaxy structure, and propose the classifier as a fast preselection tool for large multiband surveys. The paper also includes a feature-importance analysis, a study of misclassified galaxies with illustrative snapshots and interaction histories, and a discussion of the physical meaning of borderline A1 classifications.
Significance. If the reported accuracy reflects generalization to unseen galaxies, this would be a useful practical contribution: a fast, automated preselector for lopsided galaxies, with a clearly described pipeline and careful treatment of class imbalance (SMOTE and BRF, balanced accuracy as primary metric). The case studies of misclassified galaxies in Section 4.3 are informative and provide physical insight into the borderline nature of the A1-based label. However, the two concerns below—train/test leakage from repeated snapshots of the same galaxies and the self-predictive relationship between features and label—mean that the headline accuracies cannot currently be taken at face value, and the physical interpretation in Section 5 is stronger than the evidence supports. The analysis is reproducible in principle, though no code is provided.
major comments (2)
- [Sections 2.2 and 3.2; Tables 3 and 5] The sample consists of galaxy snapshots over z=0–0.5; Section 2.2 explicitly states that a given galaxy 'will be present at different snapshots of the simulation' and 'will serve as input for the training process.' The train/test split in Section 3.2 uses StratifiedShuffleSplit on the 7,919 rows without grouping by subhalo ID. Because the structural features (µ*, TP, R50, Rext, M50, SFR) and the A1 label are strongly autocorrelated across lookback times up to ~5 Gyr, later snapshots of a galaxy used in training can appear in the test set, allowing the random forest to exploit per-galaxy identity rather than a general rule. The balanced accuracies in Tables 3 and 5 are therefore estimates of performance on partially seen galaxies, not on independent galaxies, and do not yet support the survey preselection claim. The authors should redo the split at the galaxy level (e.g., GroupShuffleSplit or GroupKFold on subhalo ID) and report metrics for galaxies whose entire evolutionary tracks were excluded from training.
- [Sections 3.1, 2.2 (Table 1), and 5] The label A1 is the radially averaged m=1 Fourier amplitude of the stellar mass distribution over R50–1.4R90, while the top-ranked features in Table 4—µ*, TP, M50, and also R50 and Rext—are integrals or moments of the same simulated stellar mass distribution. The classifier is thus mapping one set of summary statistics of a density field onto another summary statistic of the same field. The high accuracy therefore does not by itself test whether lopsidedness is 'mainly a tracer of galaxies internal structures' rather than of environment, since no environment-based features are included for comparison. The authors should either temper this interpretation (noting that the result is partly a self-consistency check of the mass distribution), or add a control experiment that includes environment features (e.g., host halo mass, local density, distance to nearest neighbor) and compares accuracies or feature importances, to directly address the environment hypothesis.
minor comments (5)
- [Abstract and Section 2.2] The abstract states '≈ 8000 late-type galaxies' while Section 2.2 gives 7,919; please harmonize the numbers.
- [Table 3] The BRF TNR row reports the uncertainty as 0.00; if this is a rounding artifact, please give at least two significant digits.
- [Section 4.4] The text states that the observational-feature model produces 535 misclassifications, 'a 15% increase' relative to the 455 misclassifications of the full-feature model; the increase is actually 17.6%, and the wording should clarify that this is an increase in errors.
- [Section 4.2] Permutation importance is computed on the test set only; this is nonstandard because the test set is meant to be used once. Consider computing permutation importance on a validation split or on the training set to avoid optimistic feature-importance estimates.
- [Throughout] Minor typographical issues include 'stellar participles' in Section 3.1 and 'Richter & Sacisi 1994' in the references (should be 'Sancisi'); also, the numbers quoted for correct/incorrect classifications in Fig. 5 are slightly inconsistent with the reported TPR/TNR values, so the rounding should be checked.
Circularity Check
Repeated snapshots of the same TNG50 galaxies enter both the training and test sets, so the reported balanced accuracies (0.813 and 0.799) reflect partly within-galaxy memorization rather than generalization to unseen galaxies.
-
fitted input called prediction
[Section 2.2 (selection criteria) and Section 3.2 (train/test split); reported in Tables 3 and 5]
"Note that, even though a given galaxy will be present at different snapshots of the simulation, their detailed structure will evolve (see e.g., Varela-Lavin et al. 2023) and, thus, it will serve as input for the training process. ... we partitioned the dataset into a training set and a testing set comprising 70% and 30% of the total sample, respectively. To do so, we employed stratifiedshufflesplit from scikit-learn."
The sample consists of 7,919 rows that are snapshots of the same TNG50 subhalos across z = 0 to z = 0.5, not 7,919 independent galaxies. The row-level StratifiedShuffleSplit does not group by subhalo ID, so early snapshots of a galaxy can appear in the training set while later snapshots of the same galaxy are placed in the test set. Because structural features and the A1 label are strongly autocorrelated over the roughly 5 Gyr spanned, the classifier can effectively recognize the individual galaxy rather than learn a general internal-property rule. The headline balanced accuracies (0.813 +/- 0.010 and 0.799 +/- 0.009) are therefore not estimates of performance on unseen galaxies, which is exactly the quantity required for the survey preselection claim.
full rationale
The paper's derivation chain is otherwise self-contained: A1 is computed by Fourier decomposition, the features are tabulated in Table 1, and the classifier is a standard SMOTE+RF/BRF pipeline with no imported uniqueness theorem and no load-bearing self-citation chain. The central flaw is statistical rather than algebraic: the train/test split is performed on snapshot rows rather than on unique galaxies, and Section 2.2 explicitly notes that the same galaxy appears at multiple snapshots and will serve as input for the training process. Because no grouping by subhalo ID is described, the same galaxy can appear in both training and test, so the reported accuracies partly reflect memorization of individual systems. This falls under fitted-input-called-prediction: the test prediction is not genuinely out-of-sample. The further interpretive claim that high classifier accuracy strongly supports an internal origin of lopsidedness is an overreach, since lopsidedness is itself an internal structural property and the model never tests the environmental alternative; however, that is an inference issue rather than a circular derivation. No other circular steps were found.
Assumptions & free parameters
free parameters (3)
- A1 lopsidedness threshold =
0.1
- Radial interval for A1 =
R50 to 1.4R90
- SMOTE+RF hyperparameters =
n_trees=1500, max_depth=75, etc.
assumptions (4)
- domain assumption TNG50 simulation faithfully represents real galaxy structure and lopsidedness
- domain assumption Fourier m=1 amplitude A1 averaged over R50-1.4R90 correctly measures lopsidedness
- domain assumption Galaxy snapshots at different redshifts can be treated as independent samples
- ad hoc to paper Selected structural features can be measured without reference to the same A1 label
Cite this review
Pith. "Pith review of A statistical study of lopsided galaxies using random forest." pith.science (2026). https://pith.science/paper/TQEHTO5W
@misc{pith2026241119723,
  author       = {Pith},
  title        = {Pith review of: A statistical study of lopsided galaxies using random forest},
  year         = {2026},
  howpublished = {\url{https://pith.science/paper/TQEHTO5W}},
  note         = {Machine review of arXiv:2411.19723}
}
read the original abstract
Lopsided galaxies are late-type galaxies with a non-axisymmetric disk due to an uneven distribution of their stellar mass. Despite being a relatively common perturbation, several questions regarding its origin and the information that can be extracted from them about the evolutionary history of late-type galaxies. The advent of several large multi-band photometric surveys will allow us to statistically analyze this perturbation, with information that was not previously available. Given the strong correlation between lopsidedness and the structural properties of the galaxies, this paper aims to develop a method to automatically classify late-type galaxies between lopsided and symmetric. We seek to explore if an accurate classification can be obtain by only considering their internal properties, without additional information about the environment. We select 8000 late-type galaxies from TNG50. A Fourier decomposition of their stellar mass surface density is used to label galaxies as lopsided and symmetric. We trained a Random Forest classifier to rapidly and automatically identify this type of perturbations, exclusively using galaxies internal properties. We test different algorithms to deal with the imbalance of our data and select the most suitable approach based on the considered metrics. We show that our trained algorithm can provide a very accurate and rapid classification of lopsided galaxies. The excellent results obtained by our classifier strongly supports the hypothesis that lopsidedness is mainly a tracer of galaxies internal structures. We show that similar results can be obtained using observable quantities, readily obtainable from multi-bad photometric surveys. Our results show it allows a rapid and accurate classification of lopsided galaxies, allowing us to explore whether lopsidedness in present-day disk galaxies is connected to galaxies specific evolutionary histories.
Figures


Figures from the paper (8 more)




Forward citations
Cited by 1 Pith paper
-
Galaxy Morphology Classification: Are Stellar Circularities Enough?
Using IllustrisTNG circularity catalogs, the authors show that a disk fraction threshold of Fdisk=0.25 separates early- and late-type galaxies well enough to recover the morphology-density relation at z=0.
Reference graph
Works this paper leans on
- [1]
-
[2]
Appleby, S., Davé, R., Sorini, D., Lovell, C. C., & Lo, K. 2023, MNRAS, 525, 1167
work page 2023
-
[3]
Aumer, M., White, S. D. M., Naab, T., & Scannapieco, C. 2013, MNRAS, 434, 3142
work page 2013
-
[4]
E., Lynden-Bell, D., & Sancisi, R
Baldwin, J. E., Lynden-Bell, D., & Sancisi, R. 1980, MNRAS, 193, 313
1980
-
[5]
M., Loveday, J., Fukugita, M., et al
Ball, N. M., Loveday, J., Fukugita, M., et al. 2004, MNRAS, 348, 1038
work page 2004
- [6]
- [7]
-
[8]
Bournaud, F., Combes, F., Jog, C. J., & Puerari, I. 2005, A&A, 438, 507 Article number, page 14 of 15 Valentina Fontirroig et al.: A statistical study of lopsided galaxies using random forests
work page 2005
Show all 66 references
-
[9]
W., Chawla, N
Bowyer, K. W., Chawla, N. V ., Hall, L. O., & Kegelmeyer, W. P. 2011, CoRR, abs/1106.1813 [1106.1813]
2011 arXiv
-
[10]
1996, Machine Learning, 24, 123
Breiman, L. 1996, Machine Learning, 24, 123
1996
-
[11]
2001, Machine Learning, 45, 5
Breiman, L. 2001, Machine Learning, 45, 5
2001
-
[12]
Carliles, S., Budavári, T., Heinis, S., Priebe, C., & Szalay, A. S. 2010, ApJ, 712, 511
2010
-
[13]
J., Moles, M., Cristóbal-Hornillos, D., et al
Cenarro, A. J., Moles, M., Cristóbal-Hornillos, D., et al. 2019, A&A, 622, A176
2019
-
[14]
& Breiman, L
Chen, C. & Breiman, L. 2004, University of California, Berkeley
2004
-
[15]
Conselice, C. J. 2014, ARA&A, 52, 291
2014
-
[16]
J., Bershady, M
Conselice, C. J., Bershady, M. A., & Jangren, A. 2000, ApJ, 529, 886
2000
-
[17]
& Hart, P
Cover, T. & Hart, P. 1967, IEEE Transactions on Information Theory, 13, 21
1967
-
[18]
W., & Dambre, J
Dieleman, S., Willett, K. W., & Dambre, J. 2015, MNRAS, 450, 1441
2015
-
[19]
A., Monachesi, A., et al
Dolfi, A., Gómez, F. A., Monachesi, A., et al. 2023, MNRAS, 526, 567
2023
-
[20]
2019, MNRAS, 489, 3553
Erwin, P. 2019, MNRAS, 489, 3553
2019
-
[21]
2020, Astron- omy and Computing, 33, 100420
Farias, H., Ortiz, D., Damke, G., Jaque Arancibia, M., & Solar, M. 2020, Astron- omy and Computing, 33, 100420
2020
-
[22]
Friedman, J. H. 2001, Annals of statistics, 1189
2001
-
[23]
2009, Research in Astronomy and Astro- physics, 9, 220
Gao, D., Zhang, Y .-X., & Zhao, Y .-H. 2009, Research in Astronomy and Astro- physics, 9, 220
2009
-
[24]
2014, MNRAS, 445, 175
Genel, S., V ogelsberger, M., Springel, V ., et al. 2014, MNRAS, 445, 175
2014
-
[25]
& Walkowicz, L
Giles, D. & Walkowicz, L. 2019, MNRAS, 484, 834 Gómez, F. A., White, S. D. M., Marinacci, F., et al. 2016, MNRAS, 456, 2779
2019
-
[26]
2000, Information Systems, 25, 345 Guzmán-Ortega, A., Rodriguez-Gomez, V ., Snyder, G
Guha, S., Rastogi, R., & Shim, K. 2000, Information Systems, 25, 345 Guzmán-Ortega, A., Rodriguez-Gomez, V ., Snyder, G. F., Chamberlain, K., &
2000
-
[27]
2023, MNRAS, 519, 4920
Hernquist, L. 2023, MNRAS, 519, 4920
2023
-
[28]
E., Sun, Y ., & Davey, N
Hocking, A., Geach, J. E., Sun, Y ., & Davey, N. 2018, MNRAS, 473, 1108
2018
-
[29]
2015, ApJS, 221, 8 Ivezi´c, Ž., Kahn, S
Huertas-Company, M., Gravet, R., Cabrera-Vives, G., et al. 2015, ApJS, 221, 8 Ivezi´c, Ž., Kahn, S. M., Tyson, J. A., et al. 2019, ApJ, 873, 111
2015
-
[30]
Jog, C. J. 1997, ApJ, 488, 642
1997
-
[31]
Jog, C. J. 1999, ApJ, 522, 661
1999
-
[32]
Jog, C. J. 2000, ApJ, 542, 216
2000
-
[33]
Jog, C. J. 2002, A&A, 391, 471
2002
-
[34]
Jog, C. J. & Combes, F. 2009, Phys. Rep., 471, 75
2009
-
[35]
Jolliffe, I. T. 2002, Principal Component Analysis, 2nd edn. (Springer)
2002
-
[36]
D., Pillepich, A., Nelson, D., et al
Joshi, G. D., Pillepich, A., Nelson, D., et al. 2020, MNRAS, 496, 2673
2020
-
[37]
M., White, S
Kauffmann, G., Heckman, T. M., White, S. D. M., et al. 2003, MNRAS, 341, 33
2003
-
[38]
1998, ARA&A, 36, 189
Kennicutt, Robert C., J. 1998, ARA&A, 36, 189
1998
-
[39]
F., Blanc, G
Kollmeier, J., Anderson, S. F., Blanc, G. A., et al. 2019, in Bulletin of the Amer- ican Astronomical Society, V ol. 51, 274
2019
-
[40]
Lagos, C. d. P., Theuns, T., Stevens, A. R. H., et al. 2017, MNRAS, 464, 3850
2017
-
[41]
& Shin, M.-S
Lee, J. & Shin, M.-S. 2021, AJ, 162, 297
2021
-
[42]
1982, IEEE Transactions on Information Theory, 28, 129 Łokas, E
Lloyd, S. 1982, IEEE Transactions on Information Theory, 28, 129 Łokas, E. L. 2022, A&A, 662, A53 Mendes de Oliveira, C., Ribeiro, T., Schoenell, W., et al. 2019, MNRAS, 489, 241
1982
-
[43]
2024, A&A, 691, A106
Monsalves, N., Jaque Arancibia, M., Bayo, A., et al. 2024, A&A, 691, A106
2024
-
[44]
G., Palmese, A., et al
Mucesh, S., Hartley, W. G., Palmese, A., et al. 2021, MNRAS, 502, 2770
2021
-
[45]
2015, Astronomy and Computing, 13, 12
Nelson, D., Pillepich, A., Genel, S., et al. 2015, Astronomy and Computing, 13, 12
2015
-
[46]
2018, MNRAS, 475, 624
Nelson, D., Pillepich, A., Springel, V ., et al. 2018, MNRAS, 475, 624
2018
-
[47]
S., & Levine, S
Noordermeer, E., Sparke, L. S., & Levine, S. E. 2001, MNRAS, 328, 1064 O’Shea, K. & Nash, R. 2015, arXiv e-prints, arXiv:1511.08458
2001 arXiv
-
[48]
N., & Mundy, L
Phookun, B., V ogel, S. N., & Mundy, L. G. 1993, ApJ, 418, 113
1993
-
[49]
2018, MNRAS, 473, 4077 Planck Collaboration, Ade, P
Pillepich, A., Springel, V ., Nelson, D., et al. 2018, MNRAS, 473, 4077 Planck Collaboration, Ade, P. A. R., Aghanim, N., et al. 2016, A&A, 594, A13
2018
-
[50]
A., Heckman, T
Reichard, T. A., Heckman, T. M., Rudnick, G., Brinchmann, J., & Kau ffmann, G. 2008, ApJ, 677, 186
2008
-
[51]
A., Heckman, T
Reichard, T. A., Heckman, T. M., Rudnick, G., et al. 2009, ApJ, 691, 1005
2009
-
[52]
& Sacisi, R
Richter, O. & Sacisi, R. 1994, Astronomy & Astrophysics, 290, L9
1994
-
[53]
& Rix, H.-W
Rudnick, G. & Rix, H.-W. 1998, AJ, 116, 1163
1998
-
[54]
2000, ApJ, 538, 569
Rudnick, G., Rix, H.-W., & Kennicutt, Robert C., J. 2000, ApJ, 538, 569
2000
-
[55]
Rumelhart, D. E. & McClelland, J. L. 1987, Learning Internal Representations by Error Propagation (MIT Press), 318–362 Sánchez-Sáez, P., Reyes, I., Valenzuela, C., et al. 2021, AJ, 161, 141
1987
-
[56]
2022, MNRAS, 510, 6022
Sarkar, J., Bhatia, K., Saha, S., Safonova, M., & Sarkar, S. 2022, MNRAS, 510, 6022
2022
-
[57]
Sellwood, J. A. 2013, in Planets, Stars and Stellar Systems. V olume 5: Galactic Structure and Stellar Populations, ed. T. D. Oswalt & G. Gilmore, V ol. 5, 923
2013
-
[58]
2010, MNRAS, 401, 791 van Eymeren, J., Jütte, E., Jog, C
Springel, V . 2010, MNRAS, 401, 791 van Eymeren, J., Jütte, E., Jog, C. J., Stein, Y ., & Dettmar, R. J. 2011, A&A, 530, A30
2010
-
[59]
A., Tissera, P
Varela-Lavin, S., Gómez, F. A., Tissera, P. B., et al. 2023, MNRAS, 523, 5853 V ogelsberger, M., Genel, S., Springel, V ., et al. 2014, Nature, 509, 177
2023
-
[60]
R., Mihos, J
Walker, I. R., Mihos, J. C., & Hernquist, L. 1996, ApJ, 460, 121
1996
-
[61]
Wang, K., Guo, P., & Luo, A. L. 2017, MNRAS, 465, 4311
2017
-
[62]
Weinberg, M. D. 1994, ApJ, 421, 481
1994
-
[63]
& Rix, H.-W
Zaritsky, D. & Rix, H.-W. 1997, ApJ, 477, 118
1997
-
[64]
2013, ApJ, 772, 135
Zaritsky, D., Salo, H., Laurikainen, E., et al. 2013, ApJ, 772, 135
2013
-
[65]
2013, The Astronomical Journal, 146, 22
Zhang, Y ., Ma, H., Peng, N., Zhao, Y ., & bing Wu, X. 2013, The Astronomical Journal, 146, 22
2013
-
[66]
& Zhang, Y
Zheng, H. & Zhang, Y . 2008, Advances in Space Research, 41, 1960 Article number, page 15 of 15
2008
Reviewed August 12, 2026 · model on record in the stance chip above.
Discussion (0). Continue with ORCID to comment.