REVIEW 3 major objections 4 minor 1 cited by
CuXASNet: Rapid and Accurate Prediction of Copper L-edge X-Ray Absorption Spectra Using Machine Learning
T0 review · 3 major / 4 minor · reviewed 2026-08-11 · deepseek-v4-flash
Pith's one-line read A neural network predicts Cu L-edge X-ray absorption spectra from atomic structure at FEFF9 accuracy.
desk verdict Useful FEFF9 surrogate for Cu L-edge XAS with solid internal validation, but the 14-spectrum experimental equivalence claim is undercut by an unstated energy-alignment protocol. read the letter →
The pith
A machine-rendered reading of the paper's core claim, the machinery that carries it, and where it could break.
The reading
What carries the argument
The load-bearing object is the M3GNet-derived 64-dimensional site vector: for each symmetrically unique Cu absorber, M3GNet's graph representation of the unit cell is evaluated before its readout layer, and the resulting node features are the sole input to CuXASNet. The spectral branch is a pair of fully connected networks with hidden layers of 120, 240 and 480 units and ReLU activations, a softmax output layer spanning 312 energy points, and separate weights for the L3 and L2 edges. FEFF9 provides the training signal at the multiple-scattering level of theory; the interpolated 0.2 eV grid and fixed energy windows standardize the output. What the machinery does is compress the structure-spectrum relationship into a learned map from a local-environment embedding to a normalized intensity profile.
What would settle it
A decisive test: find two distinct Cu coordination environments that receive exactly the same 64-dimensional M3GNet embedding but produce measurably different FEFF9 L3 spectra; because CuXASNet is a deterministic function of that vector, it would be unable to distinguish them, falsifying the claim that the embedding contains the spectral information. A practical approximation is to train the same network from an alternative local-environment descriptor on the same split and show a significantly lower test MAE, which would disprove the sufficiency of the M3GNet featurization.
Extended reading notes
Core claim
The central claim of the paper is that the Cu L-edge X-ray absorption spectrum is, for practical purposes, a function of a short vector encoding the absorbing site's local atomic environment: specifically, the 64-dimensional node embedding produced by M3GNet. Trained on 4,123 of 5,497 site-specific FEFF9 multiple-scattering spectra, two dense networks (one for L3, one for L2) predict the full 312-point spectrum on a 0.2 eV grid. The paper reports median test-set MAE of 0.0391, edge-onset errors that are exact or within a grid step for most spectra, and, in the experimental validation, aggregate errors indistinguishable from FEFF9's own. The authors present this as establishing CuXASNet as a drop-in replacement for FEFF9 in screening candidate structures against measured spectra, including structures outside its crystalline training distribution.
Load-bearing premise
The claim collapses if M3GNet's 64-dimensional embedding of a Cu site does not contain enough information about the local atomic environment to determine the L-edge spectrum; the paper takes this representation as fixed and does not ablate or compare it against alternative featurizations.
Editorial extensions
If this is right
- CuXASNet can generate thousands of Cu L3/L2 spectra per minute, so most Cu-containing Materials Project structures without L-edge spectra could be populated at FEFF9-equivalent quality without running FEFF9.
- Experimental analysis can use CuXASNet as a fast filter: candidate structural models of an unknown Cu material are screened against a measured spectrum before expensive FEFF9 refinement, since the ML-versus-experiment error is statistically the same as FEFF9-versus-experiment.
- The data-scaling result, accuracy plateauing after roughly 500 training spectra, indicates that the same architecture can be retrained on more expensive levels of theory with a computationally feasible dataset.
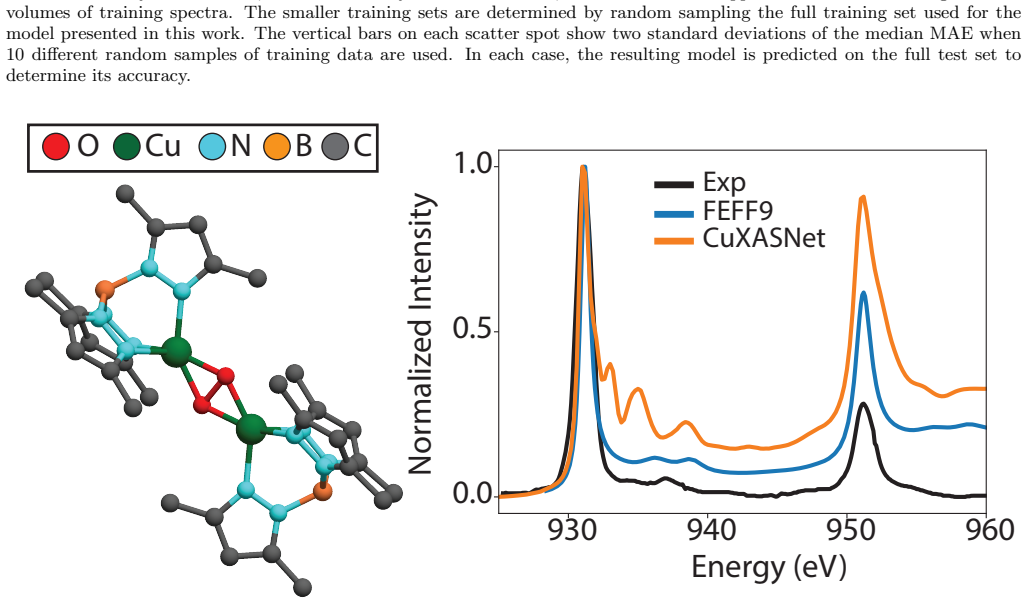
- The successful prediction for a peroxo-Cu(II) organometallic complex implies the embedding generalizes beyond crystalline periodic structures, extending the model's use to molecular Cu sites.
- Because the two worst outliers are antiperovskites with unusual FEFF9 spectra, the model's reliability is chemistry-dependent and its limits cluster around rare coordination motifs rather than being uniform.
Reading between the lines
- Since CuXASNet only learns to imitate FEFF9, its agreement with experiment is capped by FEFF9's own systematic errors: any level-of-theory deficiency in the multiple-scattering method will be inherited by the network, so the model cannot be expected to improve on FEFF9 for elements such as Ti or Fe where FEFF9 is known to be weaker.
- The absence of a featurizer ablation leaves open that a cheaper or more physically interpretable descriptor could match or beat the M3GNet embedding; a head-to-head comparison against SOAP or atom-centered symmetry functions on the same 5,497 labels would settle where the accuracy resides.
- The model's speed invites an inverse-design loop not implemented in the paper: search over structures or dopant configurations to match a target experimental spectrum, then validate the top hits with full simulation.
- Extension to other 3d transition-metal L-edges will require new training labels but, if the data-scaling trend holds, would need only a few thousand spectra per element, a modest simulation budget relative to database-scale studies.
Signed reviews
Editorial analysis
A structured set of objections, weighed in public.
Referee Report
Summary. The paper introduces CuXASNet, a dense neural network that predicts Cu L3- and L2-edge X-ray absorption spectra from a 64-dimensional M3GNet embedding of the absorbing Cu site. The model is trained on 5497 FEFF9 multiple-scattering spectra of Cu-containing materials, and the authors report median test-set MAE of 0.0391, accurate edge-onset prediction to within 0.2 eV for roughly half of the test set, and agreement with FEFF9 across oxidation states, coordination numbers, and neighbor types. The external validation uses 14 experimental spectra digitized from the literature, for which the authors report an average MAE of 0.125 and Spearman correlation of 0.891, comparable to the FEFF9 values of 0.131 and 0.898. The authors also demonstrate a molecular example outside the crystalline training distribution and analyze how model accuracy scales with training-set size.
Significance. If the claims hold, CuXASNet would be a useful, fast surrogate for FEFF9 L-edge simulations, enabling structure screening and rapid generation of reference spectra for Cu systems. The internal validation against FEFF9 is strong and clearly presented: the test-set MAE distributions, edge-location histograms, and error breakdown by chemical environment give a convincing picture of surrogate accuracy. The experimental comparison is potentially valuable evidence that the model is not systematically worse than FEFF9, but its current lack of methodological detail limits the strength of the external claim. The paper also provides useful scaling data on training-set size and an honest discussion of outlier classes such as antiperovskites.
major comments (3)
- [Sections II.D and III.D] The manuscript does not state whether the simulated energy axes were aligned to the experimental axes before computing MAE and Spearman correlation. Section III.G explicitly mentions manually aligning the L3 peak for the molecular comparison, which is standard practice for FEFF9 L-edge calculations because their absolute energy scale is not directly transferable to experiment. If no such alignment was applied to the 14 literature spectra, a uniform energy offset could substantially change both metrics, and the claimed equivalence between CuXASNet and FEFF9 might reflect a shared systematic offset rather than true spectral accuracy. Please specify the alignment procedure used for all 14 spectra, report any alignment shifts, and provide metrics both with and without alignment.
- [Section III.D] The external validation is summarized only by averages over 14 spectra, with no per-spectrum table and no uncertainty estimates. Figure 5(d) shows the distribution of MAE values, but the reader cannot tell which systems drive the average, whether any single spectrum is an outlier, or whether the FEFF9 and CuXASNet values are statistically distinguishable. Provide a table with per-spectrum MAE and Spearman correlation for both methods, together with the experimental energy range used for each system and the corresponding digitization source.
- [Sections II.C and III.B] The train/test split is not described. The paper reports that the test set contains 1375 spectra but does not state how the split was constructed (e.g., random by spectrum, random by material, stratified by oxidation state) or whether test structures can share near-duplicate local environments with training structures. This detail is load-bearing for the central claim that CuXASNet generalizes to new atomic structures, and it should be stated explicitly.
minor comments (4)
- [Throughout] Several typos should be cleaned up: 'igure S4' is missing the capital F, 'epocs' should be 'epochs', 'principle component' should be 'principal component', and 'For for biological' has a duplicated word.
- [Section III.C and Figure 4] The text refers to bar plots in Figure 4(a-b) and two-dimensional histograms in Figure 4(c-d), but the figure caption and the actual panel arrangement appear to place the two-dimensional histograms in (a-b) and the bar plots in (c-d). Please correct the subplot references so the text matches the figure.
- [Section V] The data and code repository is described as private and 'will be shared upon request.' For a reproducibility claim, the authors should either make the repository accessible to reviewers before publication or provide a review copy, since the paper's central results depend on the exact training and evaluation pipeline.
- [Section II.D] The description of experimental data extraction is thin: the authors cite webplotdigitizer and the source references, but do not state which curve from each reference was digitized, how the smoothing broadening function was chosen, or how the intensity normalization was performed before computing MAE. A short supplementary table or paragraph would make the experimental comparison reproducible.
Circularity Check
No circular derivation: CuXASNet is a supervised surrogate for FEFF9, and its experimental comparison is an external benchmark; the only same-author citations are non-load-bearing.
full rationale
The paper's core claim is that a neural network trained on FEFF9 multiple-scattering spectra reproduces those spectra on held-out structures and achieves experimental agreement comparable to FEFF9. This is a regression against an external simulation code, not a quantity defined by the model inputs: the FEFF9 target spectra in the test set are not used in training (Section II.B), and the 14 experimental spectra are independent literature data (Section II.D). The M3GNet featurizer (Ref. 60) is a fixed, pretrained graph neural network representation, not fitted to XAS data, so the featurization is not constructed from the target spectra. The same-author citations (Ref. 10 for featurizer benchmarking, Ref. 45 for the simulated dataset and Ref. 61 for the Lightshow workflow) support methodological choices and data provenance, but the quantitative conclusions do not reduce to them: held-out FEFF9 MAE and external experimental MAE/Spearman values are reported and are falsifiable. The absence of an explicit energy-alignment protocol for the 14 spectra (Section II.D vs. the manual alignment in Section III.G) is a legitimate external-validity concern, but it is not a circularity, since no fitted parameter is renamed as a prediction. No equation in the paper defines the predicted spectrum as the training input, and no fitted quantity is presented as an independent first-principles result. Score 2 reflects the presence of minor same-author citations (notably Refs. 10 and 45) that are ancillary rather than load-bearing.
Assumptions & free parameters
free parameters (1)
- Neural network hyperparameters =
hidden layers: 120, 240, 480; batch size: 10; epochs: 500
assumptions (4)
- domain assumption FEFF9 multiple-scattering theory provides accurate Cu L-edge spectra
- domain assumption M3GNet 64-dim node embedding is a sufficient representation of the local Cu environment for spectral prediction
- domain assumption The training set of 5497 spectra is representative of Cu chemical environments in practice
- domain assumption The 14 literature experimental spectra are correctly digitized and energy-aligned with the simulated spectra
Cite this review
Pith. "Pith review of CuXASNet: Rapid and Accurate Prediction of Copper L-edge X-Ray Absorption Spectra Using Machine Learning." pith.science (2026). https://pith.science/paper/DUZAUV7K
@misc{pith2026241202916,
  author       = {Pith},
  title        = {Pith review of: CuXASNet: Rapid and Accurate Prediction of Copper L-edge X-Ray Absorption Spectra Using Machine Learning},
  year         = {2026},
  howpublished = {\url{https://pith.science/paper/DUZAUV7K}},
  note         = {Machine review of arXiv:2412.02916}
}
read the original abstract
In this work, we have developed CuXASNet, a dense neural network that predicts simulated Cu L-edge X-ray absorption spectra (XAS) from atomic structures. Featurization of the Cu local environment is performed using a component of M3GNet, a graph neural network developed for predicting the potential energy surface. CuXASNet is trained on simulated spectra from FEFF9 at the multiple scattering level of theory, and can predict the L3 and L2 edges for Cu sites to quantitative accuracy. To validate our approach, we compare 14 experimental spectra extracted from the literature with the predictions of CuXASNet. The agreement of CuXASNet with experiments is shown by an average MAE of 0.125 and an average Spearman's correlation coefficient of 0.891, which is comparable to FEFF9's values of 0.131 and 0.898 for the same metrics. As such, CuXASNet can rapidly generate a large number of L-edge XAS spectra at the same accuracy as FEFF9 simulations. This can be used as a drop-in replacement for multiple scattering codes for fast screening of candidate atomic structure models of a measured system. This model establishes a general framework for Cu XAS prediction, and can be extended to more computationally expensive levels of theory and to other transition metal L-edges.
Figures


Figures from the paper (5 more)


Forward citations
Cited by 1 Pith paper
-
Spectra-to-Structure and Structure-to-Spectra Inference Across the Periodic Table
XAStruct learns both structure-to-spectrum and spectrum-to-structure mappings for X-ray absorption spectroscopy across more than 70 elements, including the first reported ML prediction of neighbor atom types from spectra.
Reference graph
Works this paper leans on
-
[1]
F. De Groot and A. Kotani, Core Level Spectroscopy of Solids (CRC Press, 2008)
work page 2008
-
[2]
F. M. F. de Groot, J. C. Fuggle, B. T. Thole, and G. A. Sawatzky, Physical Review B 42, 5459 (1990)
work page 1990
-
[3]
Y. Bai, Y. Wu, X. Zhou, Y. Ye, K. Nie, J. Wang, M. Xie, Z. Zhang, Z. Liu, T. Cheng, and C. Gao, Nature Com- munications 13 (2022), 10.1038/s41467-022-33846-0
- [4]
-
[5]
E. Marelli, J. Lyu, M. Morin, M. Lem´ enager, T. Shang, N. S. Y¨ uzbasi, D. Aegerter, J. Huang, N. D. Daff´ e, A. H. Clark, D. Sheptyakov, T. Graule, M. Nachtegaal, E. Pomjakushina, T. J. Schmidt, M. Krack, E. Fabbri, and M. Medarde, EES Catalysis 2, 335 (2024)
work page 2024
-
[6]
K. P lacheta, A. Kot, J. Banas-Gac, M. Zaj¸ ac, M. Sikora, M. Radecka, and K. Zakrzewska, Applied Surface Sci- ence 608 (2023), 10.1016/j.apsusc.2022.155046
-
[7]
T. Jenkins, J. A. Alarco, B. Cowie, and I. D. Mackinnon, Journal of Power Sources 571 (2023), 10.1016/j.jpowsour.2023.233078
- [8]
Show all 73 references
-
[9]
S. P. Ong, S. Cholia, A. Jain, M. Brafman, D. Gunter, G. Ceder, and K. A. Persson, Computational Materials Science 97, 209 (2015)
2015
-
[10]
A universal deep learning framework for materi- als x-ray absorption spectra,
S. R. Kharel, F. Meng, X. Qu, M. R. Carbone, and D. Lu, “A universal deep learning framework for materi- als x-ray absorption spectra,” (2024), arXiv:2409.19552 [cond-mat.mtrl-sci]
2024 arXiv
-
[11]
K. M. P. Wheelhouse, R. L. Webster, and G. L. Beut- ner, Organic Process Research & Development 27, 1157 (2023)
2023
-
[12]
K. E. Dalle, J. Warnan, J. J. Leung, B. Reuillard, I. S. Karmel, and E. Reisner, Chemical Reviews 119, 2752 (2019)
2019
-
[13]
W. Gao, Y. Xu, L. Fu, X. Chang, and B. Xu, Nature Catalysis 6, 885 (2023)
2023
-
[14]
M. B. Gawande, A. Goswami, F. X. Felpin, T. Asefa, X. Huang, R. Silva, X. Zou, R. Zboril, and R. S. Varma, Chemical Reviews 116, 3722 (2016)
2016
-
[15]
Dervaux and F
B. Dervaux and F. E. Du Prez, Chemical Science 3, 959 (2012)
2012
-
[16]
Astruc, L
D. Astruc, L. Liang, A. Rapakousiou, and J. Ruiz, Ac- counts of Chemical Research 45, 630 (2012)
2012
-
[17]
J. K. Mccusker, Science 363, 484 (2019)
2019
-
[18]
Y. Liu, S. C. Yiu, C. L. Ho, and W. Y. Wong, Coordi- nation Chemistry Reviews 375, 514 (2018)
2018
-
[19]
M. B. Frye and L. M. Garten, Accounts of Materials Re- search 4, 906 (2023)
2023
-
[20]
O’Regan and M
B. O’Regan and M. Gr¨ atzel, Nature353, 737 (1991)
1991
-
[21]
A. K. Renfrew, E. S. O’Neill, T. W. Hambley, and E. J. New, Coordination Chemistry Reviews 375, 221 (2018)
2018
-
[22]
Graham, A
C. Graham, A. Mezzadrelli, W. Senaratne, S. Pal, D. Thelen, L. Hepburn, P. Mazumder, and V. Pruneri, Communications Materials 5 (2024), 10.1038/s43246- 024-00472-w
2024 doi
-
[23]
S. Wang, H. Wu, K. Sun, J. Hu, F. Chen, W. Liu, J. Chen, B. Sun, and A. M. S. Hossain, New Journal of Chemistry 45, 3271 (2021)
2021
-
[24]
R. Cui, P. Zhao, Y. Yan, G. Bao, A. Damirin, and Z. Liu, Inorganic Chemistry 60, 1664 (2021)
2021
-
[25]
M. L. Baker, M. W. Mara, J. J. Yan, K. O. Hodgson, B. Hedman, and E. I. Solomon, Coordination Chemistry Reviews 345, 182 (2017)
2017
-
[26]
Gianoncelli, L
A. Gianoncelli, L. Vaccari, G. Kourousias, D. Cass- ese, D. E. Bedolla, S. Kenig, P. Storici, M. Laz- zarino, and M. Kiskinova, Scientific Reports 5 (2015), 10.1038/srep10250
2015 doi
-
[27]
Cibin, D
G. Cibin, D. Gianolio, S. A. Parry, T. Schoonjans, O. Moore, R. Draper, L. A. Miller, A. Thoma, C. L. Doswell, and A. Graham, Radiation Physics and Chem- istry 175 (2020), 10.1016/j.radphyschem.2019.108479. 12
2020
-
[28]
IXAS XAFS Database,
C. Segre, “IXAS XAFS Database,” (2008)
2008
-
[29]
Y. Chen, C. Chen, C. Zheng, S. Dwaraknath, M. K. Hor- ton, J. Cabana, J. Rehr, J. Vinson, A. Dozier, J. J. Kas, K. A. Persson, and S. P. Ong, Scientific Data 8 (2021), 10.1038/s41597-021-00936-5
2021 doi
-
[30]
Vinson, J
J. Vinson, J. J. Rehr, J. J. Kas, and E. L. Shirley, Phys- ical Review B - Condensed Matter and Materials Physics 83 (2011), 10.1103/PhysRevB.83.115106
2011 doi
-
[31]
Vinson, Physical Chemistry Chemical Physics 24, 12787 (2022)
J. Vinson, Physical Chemistry Chemical Physics 24, 12787 (2022)
2022
-
[32]
Zheng, C
C. Zheng, C. Chen, Y. Chen, and S. P. Ong, Patterns 1 (2020), 10.1016/j.patter.2020.100013
2020
-
[33]
M. R. Carbone, F. Meng, C. Vorwerk, B. Maurer, F. Peschel, X. Qu, E. Stavitski, C. Draxl, J. Vinson, and D. Lu, Journal of Open Source Software 8, 5182 (2023)
2023
-
[34]
Rehr, Joshua J
John J. Rehr, Joshua J. Kas, Fernando D. Vila, Micah P. Prange, and Kevin Jorissen, Physical Chemistry Chem- ical Physics 12, 5503 (2010)
2010
-
[35]
A. Jain, S. P. Ong, G. Hautier, W. Chen, W. D. Richards, S. Dacek, S. Cholia, D. Gunter, D. Skinner, G. Ceder, and others, APL materials 1 (2013)
2013
-
[36]
Zheng, K
C. Zheng, K. Mathew, C. Chen, Y. Chen, H. Tang, A. Dozier, J. J. Kas, F. D. Vila, J. J. Rehr, L. F. Piper, K. A. Persson, and S. P. Ong, npj Computational Ma- terials 4 (2018), 10.1038/s41524-018-0067-x
2018 doi
-
[37]
Mathew, C
K. Mathew, C. Zheng, D. Winston, C. Chen, A. Dozier, J. J. Rehr, S. P. Ong, and K. A. Persson, Scientific Data 5 (2018), 10.1038/sdata.2018.151
2018 doi
-
[38]
Gilmore, J
K. Gilmore, J. Vinson, E. L. Shirley, D. Prendergast, C. D. Pemmaraju, J. J. Kas, F. D. Vila, and J. J. Rehr, Computer Physics Communications 197, 109 (2015)
2015
-
[39]
S. B. Torrisi, M. R. Carbone, B. A. Rohr, J. H. Montoya, Y. Ha, J. Yano, S. K. Suram, and L. Hung, npj Compu- tational Materials 6 (2020), 10.1038/s41524-020-00376-6
2020 doi
-
[40]
Timoshenko, D
J. Timoshenko, D. Lu, Y. Lin, and A. I. Frenkel, Journal of Physical Chemistry Letters 8, 5091 (2017)
2017
-
[41]
Tetef, N
S. Tetef, N. Govind, and G. T. Seidler, Physical Chem- istry Chemical Physics 23, 23586 (2021)
2021
-
[42]
Tetef, V
S. Tetef, V. Kashyap, W. M. Holden, A. Velian, N. Govind, and G. T. Seidler, Journal of Physical Chem- istry A 126, 4862 (2022)
2022
-
[43]
Higashi and H
M. Higashi and H. Ikeno, MATERIALS TRANSAC- TIONS 64, 2179 (2023)
2023
-
[44]
M. R. Carbone, P. M. Maffettone, X. Qu, S. Yoo, and D. Lu, Journal of Physical Chemistry A128, 1948 (2024)
2024
-
[45]
S. P. Gleason, D. Lu, and J. Ciston, npj Computational Materials 10, 221 (2024)
2024
-
[46]
Chatzidakis and G
M. Chatzidakis and G. A. Botton, Scientific Reports 9 (2019), 10.1038/s41598-019-38482-1
2019 doi
-
[47]
del Pozo-Bueno, D
D. del Pozo-Bueno, D. Kepaptsoglou, F. Peir´ o, and S. Estrad´ e, Ultramicroscopy253, 113828 (2023)
2023
-
[48]
David, N
T. David, N. K. Nik Aznan, K. Garside, and T. Penfold, Digital Discovery 2, 1461 (2023)
2023
-
[49]
S. A. Guda, A. S. Algasov, A. A. Guda, A. Martini, A. N. Kravtsova, A. L. Bugaev, L. V. Guda, and A. V. Solda- tov, Journal of Surface Investigation 15, 934 (2021)
2021
-
[50]
A. A. Guda, S. A. Guda, A. Martini, A. N. Kravtsova, A. Algasov, A. Bugaev, S. P. Kubrin, L. V. Guda, P. ˇSot, J. A. van Bokhoven, C. Cop´ eret, and A. V. Soldatov, npj Computational Materials 7 (2021), 10.1038/s41524-021- 00664-9
2021 doi
-
[51]
Z. Ji, M. Hu, and H. L. Xin, Scientific Reports 13, 14132 (2023)
2023
-
[52]
Y. Chen, C. Chen, I. Hwang, M. J. Davis, W. Yang, C. Sun, G. H. Lee, D. McReynolds, D. Allan, J. Maru- landa Arias, S. P. Ong, and M. K. Chan, Chemistry of Materials 36, 2304 (2024)
2024
-
[53]
C. D. Rankine, M. M. Madkhali, M. M. Madkhali, and T. J. Penfold, Journal of Physical Chemistry A124, 4263 (2020)
2020
-
[54]
C. D. Rankine and T. J. Penfold, Journal of Chemical Physics 156 (2022), 10.1063/5.0087255
2022 doi
-
[55]
Watson, C
L. Watson, C. D. Rankine, and T. J. Penfold, Physical Chemistry Chemical Physics 24, 9156 (2022)
2022
-
[56]
Hafner, Journal of Computational Chemistry 29, 2044 (2008)
J. Hafner, Journal of Computational Chemistry 29, 2044 (2008)
2008
-
[57]
M. W. Haverkort, M. Zwierzycki, and O. K. Andersen, Physical Review B - Condensed Matter and Materials Physics 85 (2012), 10.1103/PhysRevB.85.165113
2012 doi
-
[58]
H. Kwon, T. Hsu, W. Sun, W. Jeong, F. Aydin, J. Chap- man, X. Chen, M. R. Carbone, D. Lu, F. Zhou, and T. A. Pham, (2023)
2023
-
[59]
H. Kwon, W. Sun, T. Hsu, W. Jeong, F. Aydin, S. Sharma, F. Meng, M. R. Carbone, X. Chen, D. Lu, L. F. Wan, M. H. Nielsen, and T. A. Pham, Journal of Physical Chemistry C 127, 16473 (2023)
2023
-
[60]
Chen and S
C. Chen and S. P. Ong, Nature Computational Science 2, 718 (2022)
2022
-
[61]
F. Meng, B. Maurer, F. Peschel, S. Selcuk, M. Hybert- sen, X. Qu, C. Vorwerk, C. Draxl, J. Vinson, and D. Lu, Physical Review Materials 8 (2024), 10.1103/PhysRev- Materials.8.013801
2024 doi
-
[62]
D. P. Kingma and J. Ba, (2014)
2014
-
[63]
Marin, A
F. Marin, A. Rohatgi, and S. Charlot, (2017)
2017
-
[64]
S. W. Goh, A. N. Buckley, R. N. Lamb, R. A. Rosenberg, and D. Moran, Geochimica et Cosmochimica Acta 70, 2210 (2006)
2006
-
[65]
R. Liu, J. Chen, P. Nachimuthu, R. Gundakaram, C. Jung, J. Kim, and S. Lee, Solid State Communi- cations 118, 367 (2001)
2001
-
[66]
A. N. Buckley, W. M. Skinner, S. L. Harmer, A. Pring, and L. J. Fan, Geochimica et Cosmochimica Acta 73, 4452 (2009)
2009
-
[67]
Glaser, F
M. Glaser, F. Ciccullo, E. Giangrisostomi, R. Ovsyan- nikov, A. Calzolari, and M. B. Casu, Journal of Materials Chemistry C 6, 2769 (2018)
2018
-
[68]
B. W. Rudyk, P. E. Blanchard, R. G. Cavell, and A. Mar, Journal of Solid State Chemistry 184, 1649 (2011)
2011
-
[69]
P. E. Blanchard, R. G. Cavell, and A. Mar, Journal of Solid State Chemistry 183, 1536 (2010)
2010
-
[70]
Grioni, J
M. Grioni, J. F. Van Acker, M. T. Czyzyk, and J. C. Fuggle, PHYSICAL REVIEW B 45, 3309 (1992)
1992
-
[71]
M. R. Carbone, S. Yoo, M. Topsakal, and D. Lu, Physi- cal Review Materials 3 (2019), 10.1103/PhysRevMateri- als.3.033604
2019 doi
-
[72]
Kitajima, K
N. Kitajima, K. Fujisawa, C. Fujimoto, Y. Moro-oka, S. Hashimoto, T. Kitagawa, K. Toriumi, K. Tatsumi, and A. Nakamura, J. Am. Chem. Soc 114, 1277 (1992)
1992
-
[73]
M. F. Qayyum, R. Sarangi, K. Fujisawa, T. D. P. Stack, K. D. Karlin, K. O. Hodgson, B. Hedman, and E. I. Solomon, Journal of the American Chemical Society135, 17417 (2013). 13 2.0 1.0 0.0 3.0 Non Integer Oxidation State 0 250 500 750 1000 1250 1500 1750 2000Count 4 12 6 5Faile...
2013
Reviewed August 11, 2026 · model on record in the stance chip above.
Discussion (0). Continue with ORCID to comment.