REVIEW 3 major objections 5 minor 44 references
Resonant X-ray spectroscopies on Chromium $3\textit{d}$ orbitals in CrSBr
T0 review · 3 major / 5 minor · reviewed 2026-08-10 · deepseek-v4-flash
Pith's one-line read CrSBr's two main RIXS peaks are chromium d-d transitions, and its bright exciton is not one of them.
desk verdict Solid RIXS/XEOL study of Cr d-d excitations in CrSBr; the exciton-versus-d-d conclusion survives the model's circularity, but the quartet assignment of the first d-d peak is provisional. read the letter →
The pith
A machine-rendered reading of the paper's core claim, the machinery that carries it, and where it could break.
The reading
What carries the argument
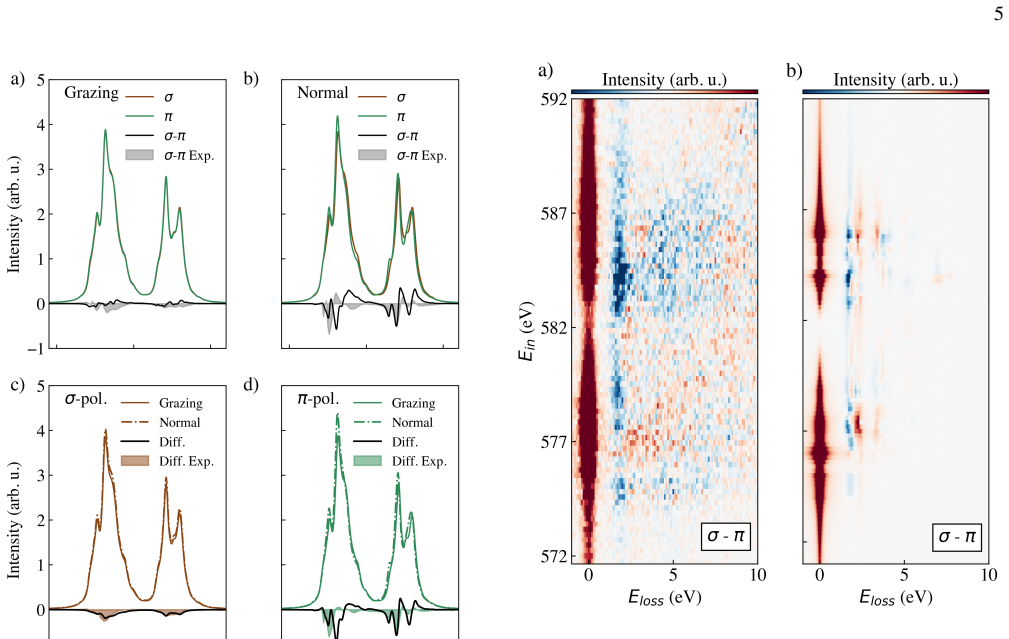
The load-bearing object is a crystal electric field (CEF) multiplet model of the Cr3+ ion with C2v symmetry, implemented through full multiplet calculations rather than a one-electron band picture. In this model, the Cr local environment splits the five 3d orbitals so that no degeneracy is enforced; a 10Dq gap of 1.57 eV separates the half-filled t2g-like levels from the empty eg-like levels, with an eg splitting of 0.25 eV, a t2g spread of 0.1 eV, and ordering Exz < Exy < Eyz. The model is used in three coordinated ways: Tanabe-Sugano diagrams fix the Slater integrals (Racah B and C) and 10Dq from the observed quartet and doublet energies; XAS simulations fix the core-hole Slater integrals; and RIXS map simulations test the orbital ordering and polarization dependence. This machinery carries the argument because the same parameter set must simultaneously reproduce the XAS linear dichroism, the RIXS peak positions, the dichroism of the first d-d loss, and the apparent doubling of the peaks, and it is what yields the conclusion that the bright exciton is not a d-d transition.
What would settle it
Measure the Cr L2,3 RIXS spectrum of CrSBr with energy resolution better than about 50 meV at 20 K: if a d-d-like loss whose energy tracks the incident photon energy appears at or below the 1.35 eV exciton energy, the claimed 0.22 eV separation and the conclusion that the bright exciton is not a d-d transition would be falsified. Alternatively, a multiplet calculation that includes ligand charge transfer and places the lowest 4T2g state below 1.35 eV would do the same.
Extended reading notes
Core claim
The central claim is that the two sharp, resonantly enhanced features visible in Cr L2,3 RIXS maps of CrSBr are d-d excitations within the high-spin S = 3/2 configuration of Cr3+, and that these excitations are distinct from the bright exciton that carries the material's photoluminescence. By fitting the four Gaussian components of the d-d peaks and comparing with Tanabe-Sugano diagrams, the authors place the first excited quartet (4T2g) at 1.57 eV and the second (4T1g) at about 2.13 eV, with additional doublet states contributing. Because the X-ray-excited luminescence peaks at about 1.35 eV, the lowest resolved d-d transition lies 0.22 eV higher, making it unlikely that the bright exciton is a simple chromium d-d transition. The accompanying CEF model, built for the actual C2v point symmetry of the Cr site, reproduces the position, linear dichroism, and intensity resonance of the d-d losses, and yields an orbital hierarchy with ordering Exz < Exy < Eyz for the partially filled orbitals and a 0.25 eV eg splitting, while the imperfect XAS dichroism at the L3 edge points to Cr 3d-ligand hybridization beyond the model.
Load-bearing premise
The model treats the Cr3+ ion in a static crystal field and neglects Cr 3d-ligand hybridization; if hybridization shifts the d-d energies significantly, the 4A2g to 4T2g assignment and the 0.22 eV gap to the bright exciton could change.
Editorial extensions
If this is right
- The two main RIXS peaks in CrSBr are quartet d-d transitions, 4A2g to 4T2g and 4A2g to 4T1g, with the first at 1.57 eV.
- The lowest bright exciton at about 1.35 eV is not a chromium d-d transition, since it lies 0.22 eV below the lowest d-d excitation.
- The Cr 3d orbital hierarchy near the Fermi level has the occupied t2g-like levels ordered Exz < Exy < Eyz, with the eg-like orbitals split by 0.25 eV and the highest occupied orbital (xy) participating in the lowest d-d transition.
- The C2v crystal-field distortion, not magnetic exchange, drives the X-ray linear dichroism, with the observed 0.25 eV shift of the L2 edge attributed to eg splitting.
- Strong Cr 3d-ligand hybridization and charge-transfer excitations lie beyond the present CEF model, so future modeling should include charge-transfer terms.
Reading between the lines
- The 0.22 eV separation is a quantitative target for theory: any calculation that places the lowest 4T2g d-d excitation below the bright exciton energy would need to explain why RIXS does not see it there.
- Because the second contribution to the first d-d peak coincides with the secondary photoluminescence near 1.75 eV, the paper leaves open that a d-d transition could feed this higher optical emission; a polarization-resolved resonant excitation experiment could test this directly.
- If ligand hybridization is as strong as the imperfect L3 dichroism suggests, the effective d-d energies in CrSBr may depend on magnetic order, so the 0.22 eV gap could shift across the Neel temperature; RIXS across the magnetic transition would test this.
- The fitted CEF parameter set gives in-situ and operando X-ray studies of CrSBr devices a baseline, so strain, gating, or magnetic fields that shift the orbital splittings could be tracked through the same dichroism signatures.
Editorial analysis
A structured set of objections, weighed in public.
Referee Report
Summary. This paper reports a combined XAS, RIXS, and XEOL study of the Cr 3d electronic structure in the layered magnetic semiconductor CrSBr. The authors observe significant linear dichroism in the Cr L2,3-edge XAS and two main dispersionless losses in RIXS, which they assign to d-d excitations within a crystal-field multiplet model. Using a CEF Hamiltonian with C2v symmetry, they reproduce key features of the spectra and identify the two dominant RIXS peaks as 4A2g→4T2g and 4A2g→4T1g transitions. By comparing the lowest d-d excitation (1.57 eV) with the excitonic luminescence at 1.35 eV, they conclude that the bright exciton is unlikely to be a Cr d-d transition. The model also indicates significant hybridization effects that are not captured, and the paper explicitly acknowledges this limitation.
Significance. The experimental dataset is valuable: the RIXS maps with polarization and angular dependence, the XEOL measurement under X-ray excitation, and the detailed comparison with a C2v multiplet model provide a useful reference for the Cr 3d orbital hierarchy in CrSBr. The conclusion that the bright exciton is not a simple d-d transition is consistent with recent GW-BSE work, and the paper explicitly identifies the limitations of the CEF model regarding hybridization. If the d-d assignments survive further scrutiny, the paper would offer a clear disentangling of intra-atomic and excitonic physics in this material. However, the central interpretation is only as strong as the model, and the current manuscript does not fully establish the robustness of the assignments.
major comments (3)
- [Appendix A] The CEF model is calibrated on the very features it is used to interpret. Specifically, 10Dq is set to 1.57 eV, the energy of the first RIXS peak (Appendix A), the eg splitting is set to the 0.25 eV L2-edge shift observed in XAS (Section III A), and the Racah parameters are adjusted so that the computed quartet/doublet states match the other RIXS peaks. The subsequent reproduction of these peak positions in the simulated spectra is therefore not an independent validation of the 4A2g→4T2g / 4A2g→4T1g assignment. To strengthen the central claim, the authors should either provide an out-of-sample test (e.g., predicting a spectrum not used in the fit) or quantify how robust the assignment is to variations of 10Dq, B, and C within the experimental uncertainties (the Gaussian position errors of ±0.04–0.06 eV quoted in Appendix A).
- [Section III C / III D] The model explicitly omits Cr 3d–ligand hybridization, yet the authors note that the L3-edge XLD is poorly reproduced and that charge-transfer features appear in the RIXS maps. Because hybridization can renormalize d-d excitation energies and admix quartet states with doublet or charge-transfer states, the quantitative conclusion that the lowest d-d excitation lies 0.22 eV above the bright exciton (Section III D) is not secure. The difference is comparable to the 220 meV RIXS resolution, so a hybridization-induced shift of only a few tenths of an eV could change the conclusion. The authors should estimate this uncertainty, for example by comparing their CEF results with a cluster calculation that includes ligand orbitals, or by quoting a conservative error on the energy difference.
- [Section III D] The comparison between the RIXS d-d peak at 1.57 eV and the XEOL exciton at 1.35 eV relies on the peak positions, but the RIXS peak is broad (resolution 220 meV) and may contain multiple unresolved contributions. The statement that the lowest discernible d-d excitation is 0.22 eV above the exciton should be tempered or supported by a fit that explicitly tests whether a component at 1.35 eV could describe the low-energy tail of the RIXS peak. As written, the data do not fully exclude a d-d origin for the bright exciton, and the conclusion would be more convincing if this alternative were ruled out.
minor comments (5)
- [Section II] The phrase 'to a state an optical spectrometer' should read 'to a state-of-the-art optical spectrometer'.
- [Section III B] In the sentence 'This feature exhibit some resonance', the verb should be 'exhibits'.
- [Section III C] The orbital ordering statement 'Exz < Exy < Eyz' contradicts Table I, where the energies are Exz = -0.10 eV, Eyz = 0.00 eV, and Exy = 1.82 eV. The text likely should read 'Exz < Eyz < Exy'; please correct this typo because the assignment of the uppermost orbital (xy) is used in the discussion.
- [Section III C] The phrase 'was found to slightly improved the simulations' should be 'was found to slightly improve the simulations'.
- [Conclusion] The word 'exhibithing' should be 'exhibiting'.
Circularity Check
CEF parameters are set from the measured RIXS/XAS peak positions, making the model's reproduction of d-d positions partly tautological, but the quartet assignment and the 0.22 eV gap retain independent support.
-
fitted input called prediction
[Section III C and Appendix A, Fig. 9a and Table I]
"Essentially, the position of the first d-d excitation sets a splitting of 1.57 eV between t2g and eg orbitals. ... Consequently, we align the first quartet state with the first excitation ... setting 10Dq at 1.57 eV (Fig. 9 a)."
In a d3 octahedral crystal field, the 4A2g to 4T2g transition energy is exactly 10Dq. Since 10Dq is defined as the measured first RIXS d-d excitation energy (1.57 eV), the later statement that the model 'reproduces quite well the d-d positions' and the assignment of the first peak to 4T2g are fixed by construction: the parameter was chosen to put the first quartet at that peak. The circularity is partial because the authors also use non-fitted intensity ratios and polarization/dichroism maps, and they explicitly reject assigning 4T2g to the second peak, so the symmetry label has some independent support.
-
fitted input called prediction
[Appendix A, Racah B/C and eg splitting (Fig. 9b-c)]
"We then adjust the Slater integrals via the RacahB and RacahC parameters ... to match other eigenstates with the observed peaks (Fig. 9 bc). ... Under these conditions, the first peak is attributed to both a quartet (4T2g) closely followed by two doublets (2Eg and 2T1g), while the second peak corresponds to the next quartet (4T1g) followed by a doublet (2T2g)."
The Racah B and C parameters are tuned so that the computed eigenstates coincide with the observed peak energies, and the 0.25 eV eg splitting is taken from the measured L2 edge shift. The model's agreement for the second d-d peak and its labeling as 4T1g with nearby doublets is therefore largely a consequence of the fit rather than an independent prediction. Some independent content remains in the computed intensities and in the qualitative comparison with additional weak features, but the energy positions used for the quartet/doublet assignment are inputs.
full rationale
The paper is mostly self-contained: the XAS, RIXS, and XEOL measurements are new, and the central quantitative comparison (lowest RIXS d-d excitation at 1.57 eV versus bright exciton at 1.35 eV, a 0.22 eV gap) is a direct comparison of measured spectra, independent of the fitted CEF parameters. The circularity is localized to the multiplet model: 10Dq is set equal to the first measured d-d peak, and Racah B/C and the eg splitting are adjusted to reproduce the other peak positions, so the model's 'reproduction' of those positions and the quartet labels at those energies are partly by construction. However, the symmetry assignment is not wholly forced: the authors test the alternative ordering of the quartets using computed intensities and find it contradicts the data, and the polarization/dichroism comparisons are not fitted. The self-citations in the paper (e.g., to sample preparation, Raman, and instrument references) are not load-bearing for the central scientific claim. Overall this is a moderate, partial circularity rather than full circularity.
Assumptions & free parameters
free parameters (7)
- 10Dq (t2g-eg splitting) =
1.57 eV
- eg orbital splitting =
0.25 eV
- t2g orbital splitting =
0.1 eV
- Orbital ordering =
Exz < Exy < Eyz; Ez2 < Ex2-y2
- Slater integral scaling factors =
F2dd 48%, F4dd 78%; F2pd 85%, G1pd 70%, G3pd 95%
- Spin-orbit coupling scaling =
3d SOC 50%; 2p SOC 100%
- Normal-incidence simulation scaling =
5% upscaling
assumptions (6)
- domain assumption Cr3+ has a high-spin S=3/2 ground state with three singly occupied d orbitals.
- domain assumption A local C2v crystal field without explicit charge transfer is sufficient to model the XAS and RIXS spectra.
- ad hoc to paper The first excited quartet state is 4T2g and is identified with the first d-d peak via Tanabe-Sugano diagrams.
- domain assumption Scaling Slater integrals to 80% (Coulomb) and SOC to 50% of Hartree-Fock values is a valid starting point.
- domain assumption The constant-energy-loss features in RIXS are d-d excitations rather than other elementary excitations.
- domain assumption DFT orbital ordering from references [16, 40] and the authors' own DFT calculations is reliable for setting the orbital hierarchy.
Cite this review
Pith. "Pith review of Resonant X-ray spectroscopies on Chromium $3\textit{d}$ orbitals in CrSBr." pith.science (2026). https://pith.science/paper/JEBWEDJR
@misc{pith2026250104751,
  author       = {Pith},
  title        = {Pith review of: Resonant X-ray spectroscopies on Chromium $3\textitd$ orbitals in CrSBr},
  year         = {2026},
  howpublished = {\url{https://pith.science/paper/JEBWEDJR}},
  note         = {Machine review of arXiv:2501.04751}
}
abstract
We investigate the Cr electronic structure and excitations in CrSBr, a layered magnetic semiconductor, using a combination of resonant x-ray spectroscopic techniques. X-ray absorption spectroscopy (XAS) and resonant inelastic x-ray scattering (RIXS) spectra collected at the Cr $L_{2,3}$ edges reveal significant linear dichroism, which arises from the distorted octahedral environment surrounding the Cr$^{3+}$ ions. The origin of the bright excitons observed in this compound is examined through a comparison of the d-d excitations identified in the RIXS spectra, the x-ray excited optical luminescence (XEOL) spectra, and previously reported optical spectroscopic and theoretical studies. To further understand these phenomena, we develop a multiplet model based on a crystal electric field (CEF) approach that accounts for the local environment of Cr ions. This model successfully reproduces several experimental features, while also suggesting strong hybridization effects between Cr $3\textit{d}$ orbitals and ligands that are not fully captured by the present framework. These findings advance our understanding of the electronic structure and excitonic behavior in CrSBr and provide a foundation for future $\textit{in-situ}$ and $\textit{operando}$ studies of CrSBr-based devices for spintronic and optoelectronic applications.
Figures


Figures from the paper (6 more)



Reference graph
Works this paper leans on
-
[1]
Y . Cao, V . Fatemi, S. Fang, K. Watanabe, T. Taniguchi, E. Kaxi- ras, and P. Jarillo-Herrero, Nature 556, 43 (2018)
work page 2018
-
[2]
K. F. Mak, C. Lee, J. Hone, J. Shan, and T. F. Heinz, Phys. Rev. 9 Lett. 105, 136805 (2010)
work page 2010
-
[3]
E. C. Regan, D. Wang, C. Jin, M. I. Bakti Utama, B. Gao, X. Wei, S. Zhao, W. Zhao, Z. Zhang, K. Yumigeta, M. Blei, J. D. Carlstr ¨om, K. Watanabe, T. Taniguchi, S. Tongay, M. Crommie, A. Zettl, and F. Wang, Nature579, 359 (2020)
work page 2020
-
[4]
R. Ribeiro-Palau, C. Zhang, K. Watanabe, T. Taniguchi, J. Hone, and C. R. Dean, Science 361, 690 (2018), https://www.science.org/doi/pdf/10.1126/science.aat6981
-
[5]
Z. Fei, B. Huang, P. Malinowski, W. Wang, T. Song, J. Sanchez, W. Yao, D. Xiao, X. Zhu, A. F. May, W. Wu, D. H. Cobden, J.- H. Chu, and X. Xu, Nature Materials 17, 778 (2018)
work page 2018
-
[6]
F. Zhu, L. Zhang, X. Wang, F. J. dos Santos, J. Song, T. Mueller, K. Schmalzl, W. F. Schmidt, A. Ivanov, J. T. Park, J. Xu, J. Ma, S. Lounis, S. Bl ¨ugel, Y . Mokrousov, Y . Su, and T. Br¨uckel, Science Advances 7, eabi7532 (2021), https://www.science.org/doi/pdf/10.1126/sciadv.abi7532
-
[7]
D. J. O’Hara, T. Zhu, A. H. Trout, A. S. Ahmed, Y . K. Luo, C. H. Lee, M. R. Brenner, S. Rajan, J. A. Gupta, D. W. McComb, and R. K. Kawakami, Nano Letters 18, 3125 (2018), pMID: 29608316, https://doi.org/10.1021/acs.nanolett.8b00683
-
[8]
M. Bonilla, S. Kolekar, Y . Ma, H. C. Diaz, V . Kalappattil, R. Das, T. Eggers, H. R. Gutierrez, M.-H. Phan, and M. Batzill, Nature Nanotechnology 13, 289 (2018)
work page 2018
Show all 44 references
-
[9]
K. L. Seyler, D. Zhong, D. R. Klein, S. Gao, X. Zhang, B. Huang, E. Navarro-Moratalla, L. Yang, D. H. Cobden, M. A. McGuire, W. Yao, D. Xiao, P. Jarillo-Herrero, and X. Xu, Na- ture Physics 14, 277 (2018)
2018
-
[10]
B. Peng, Z. Chen, Y . Li, Z. Liu, D. Liang, and L. Deng, iScience 25, 103623 (2022)
2022
-
[11]
Zhang, J
Z. Zhang, J. Shang, C. Jiang, A. Rasmita, W. Gao, and T. Yu, Nano Letters 19, 3138 (2019), pMID: 30945874, https://doi.org/10.1021/acs.nanolett.9b00553
2019 doi
-
[12]
S. Kim, S. Yoon, H. Ahn, G. Jin, H. Kim, M.-H. Jo, C. Lee, J. Kim, and S. Ryu, ACS Nano 16, 16385 (2022), pMID: 36129115, https://doi.org/10.1021/acsnano.2c05600
2022 doi
-
[13]
E. J. Telford, A. H. Dismukes, K. Lee, M. Cheng, A. Wieteska, A. K. Bartholomew, Y .-S. Chen, X. Xu, A. N. Pasupathy, X. Zhu, C. R. Dean, and X. Roy, Advanced Materials 32, 2003240 (2020), https://onlinelibrary.wiley.com/doi/pdf/10.1002/adma.202003240
2020 doi
-
[14]
Dirnberger, J
F. Dirnberger, J. Quan, R. Bushati, G. M. Diederich, M. Florian, J. Klein, K. Mosina, Z. Sofer, X. Xu, A. Kamra, F. J. Garc ´ıa- Vidal, A. Al`u, and V . M. Menon, Nature620, 533 (2023)
2023
-
[15]
S. A. L ´opez-Paz, Z. Guguchia, V . Y . Pomjakushin, C. Wit- teveen, A. Cervellino, H. Luetkens, N. Casati, A. F. Morpurgo, and F. O. von Rohr, Nature Communications 13, 4745 (2022)
2022
-
[16]
H. Wang, J. Qi, and X. Qian, Applied Physics Let- ters 117, 083102 (2020), https://pubs.aip.org/aip/apl/article- pdf/doi/10.1063/5.0014865/13546059/083102 1 online.pdf
2020 doi
-
[17]
Klein, T
J. Klein, T. Pham, J. D. Thomsen, J. B. Curtis, T. Denneulin, M. Lorke, M. Florian, A. Steinhoff, R. A. Wiscons, J. Luxa, Z. Sofer, F. Jahnke, P. Narang, and F. M. Ross, Nature Commu- nications 13, 5420 (2022)
2022
-
[18]
G ¨oser, W
O. G ¨oser, W. Paul, and H. Kahle, Journal of Magnetism and Magnetic Materials 92, 129 (1990)
1990
-
[19]
K. Lee, A. H. Dismukes, E. J. Telford, R. A. Wiscons, J. Wang, X. Xu, C. Nuckolls, C. R. Dean, X. Roy, and X. Zhu, Nano Letters 21, 3511 (2021), pMID: 33856213, https://doi.org/10.1021/acs.nanolett.1c00219
2021 doi
-
[20]
W. Liu, X. Guo, J. Schwartz, H. Xie, N. U. Dhale, S. H. Sung, A. L. N. Kondusamy, X. Wang, H. Zhao, D. Berman, R. Hov- den, L. Zhao, and B. Lv, ACS Nano 16, 15917 (2022), pMID: 36149801, https://doi.org/10.1021/acsnano.2c02896
2022 doi
-
[21]
F. Long, K. Mosina, R. H ¨ubner, Z. Sofer, J. Klein, S. Pruc- nal, M. Helm, F. Dirnberger, and S. Zhou, Applied Physics Letters 123, 222401 (2023), https://pubs.aip.org/aip/apl/article- pdf/doi/10.1063/5.0175185/18226345/222401 1 5.0175185.pdf
2023 doi
-
[22]
Scheie, M
A. Scheie, M. Ziebel, D. G. Chica, Y . J. Bae, X. Wang, A. I. Kolesnikov, X. Zhu, and X. Roy, Advanced Science 9, 2202467 (2022), https://onlinelibrary.wiley.com/doi/pdf/10.1002/advs.202202467
2022 doi
-
[23]
Calder, A
S. Calder, A. V . Haglund, Y . Liu, D. M. Pajerowski, H. B. Cao, T. J. Williams, V . O. Garlea, and D. Mandrus, Phys. Rev. B102, 024408 (2020)
2020
-
[24]
M. E. Ziebel, M. L. Feuer, J. Cox, X. Zhu, C. R. Dean, and X. Roy, Nano Letters 24, 4319 (2024), pMID: 38567828, https://doi.org/10.1021/acs.nanolett.4c00624
2024 doi
-
[25]
N. P. Wilson, K. Lee, J. Cenker, K. Xie, A. H. Dismukes, E. J. Telford, J. Fonseca, S. Sivakumar, C. Dean, T. Cao, X. Roy, X. Xu, and X. Zhu, Nature Materials 20, 1657 (2021)
2021
-
[26]
Cenker, S
J. Cenker, S. Sivakumar, K. Xie, A. Miller, P. Thijssen, Z. Liu, A. Dismukes, J. Fonseca, E. Anderson, X. Zhu, X. Roy, D. Xiao, J.-H. Chu, T. Cao, and X. Xu, Nature Nanotechnol- ogy 17, 256 (2022)
2022
-
[27]
Pawbake, T
A. Pawbake, T. Pelini, I. Mohelsky, D. Jana, I. Breslavetz, C.- W. Cho, M. Orlita, M. Potemski, M.-A. Measson, N. P. Wilson, K. Mosina, A. Soll, Z. Sofer, B. A. Piot, M. E. Zhitomirsky, and C. Faugeras, Nano Letters 23, 9587 (2023)
2023
-
[29]
Pawbake, T
A. Pawbake, T. Pelini, N. P. Wilson, K. Mosina, Z. Sofer, R. Heid, and C. Faugeras, Phys. Rev. B 107, 075421 (2023)
2023
-
[30]
Sacchi, N
M. Sacchi, N. Jaouen, H. Popescu, R. Gaudemer, J. M. Ton- nerre, S. G. Chiuzbaian, C. F. Hague, A. Delmotte, J. M. Dubuisson, G. Cauchon, B. Lagarde, and F. Polack, J. Phys. Conf. Ser. 425, 072018 (2013)
2013
-
[31]
S. G. Chiuzb ˘aian, C. F. Hague, A. Avila, R. Delaunay, N. Jaouen, M. Sacchi, F. Polack, M. Thomasset, B. Lagarde, A. Nicolaou, et al., Rev, of Sci. Instrum. 85, 043108 (2014)
2014
-
[32]
Nicolaou, V
A. Nicolaou, V . Pinty, F. Marteau, J.-M. Dubuisson, P. Rommeluere, E. Dupuy, F. Bouvet, D. Corruble, C. Sathe, M. Agaker, J.-E. Rubensson, M. Nouna, P. Goy, S. Lorcy, and C. Herbeaux, 15th soleil users meeting, https://www.synchrotron-soleil.fr/en/ file/12497/download?token=F...
2020
-
[33]
M. W. Haverkort, M. Zwierzycki, and O. K. Andersen, Phys. Rev. B 85, 165113 (2012)
2012
-
[34]
Y . Lu, M. H¨oppner, O. Gunnarsson, and M. W. Haverkort, Phys. Rev. B 90, 085102 (2014)
2014
-
[35]
M. W. Haverkort, G. Sangiovanni, P. Hansmann, A. Toschi, Y . Lu, and S. Macke, Europhysics Letters108, 57004 (2014)
2014
-
[36]
M. W. Haverkort, S. I. Csiszar, Z. Hu, S. Altieri, A. Tanaka, H. H. Hsieh, H.-J. Lin, C. T. Chen, T. Hibma, and L. H. Tjeng, Phys. Rev. B 69, 020408 (2004)
2004
-
[37]
F. Pei, J. Yu, J. Zhou, S. Wang, D. Liu, Y . Yuan, L. Xi, F. Jin, X. Kan, C. Wang, L. Wang, W. Yan, Y . Wu, S. Wang, K. Chen, T. Ma, X. Liu, M. Yang, and Q. Li, Advanced Functional Materials n/a, 2309335 (2023), https://onlinelibrary.wiley.com/doi/pdf/10.1002/adfm.202309335
2023 doi
-
[38]
Watanabe, T
S. Watanabe, T. Nagasaki, and K. Oga- sawara, Journal of Applied Physics 110, 123524 (2011), https://pubs.aip.org/aip/jap/article- pdf/doi/10.1063/1.3672442/14805307/123524 1 online.pdf
2011 doi
-
[39]
M. O. J. Y . Hunault, Y . Harada, J. Miyawaki, J. Wang, A. Mei- jerink, F. M. F. de Groot, and M. M. van Schooneveld, J Phys 10 Chem A 122, 4399 (2018)
2018
-
[40]
Jiang, P
Z. Jiang, P. Wang, J. Xing, X. Jiang, and J. Zhao, ACS Applied Materials & Interfaces 10, 39032 (2018), https://doi.org/10.1021/acsami.8b14037
2018 doi
-
[41]
T. Wang, D. Zhang, S. Yang, Z. Lin, Q. Chen, J. Yang, Q. Gong, Z. Chen, Y . Ye, and W. Liu, Nature Communications14, 5966 (2023)
2023
-
[42]
Komar, A
R. Komar, A. Łopion, M. Goryca, M. Rybak, T. Wo ´zniak, K. Mosina, A. S ¨oll, Z. Sofer, W. Pacuski, C. Faugeras, M. Birowska, P. Kossacki, and T. Kazimierczuk, Colossal magneto-excitonic effects in 2d van der waals magnetic semi- conductor crsbr (2024), arXiv:2409.00187 [cond-...
2024 arXiv
-
[43]
Y . C. Shao, B. Karki, W. Huang, X. Feng, G. Sumanasekera, J.-H. Guo, Y .-D. Chuang, and B. Freelon, J Phys Chem Lett12, 724 (2021)
2021
-
[44]
Bianchi, S
M. Bianchi, S. Acharya, F. Dirnberger, J. Klein, D. Pashov, K. Mosina, Z. Sofer, A. N. Rudenko, M. I. Katsnelson, M. van Schilfgaarde, M. R ¨osner, and P. Hofmann, Phys. Rev. B 107, 235107 (2023)
2023
-
[45]
W. M. Linhart, M. Rybak, M. Birowska, P. Scharoch, K. Mosina, V . Mazanek, D. Kaczorowski, Z. Sofer, and R. Ku- drawiec, J. Mater. Chem. C 11, 8423 (2023)
2023
Reviewed August 10, 2026 · model on record in the stance chip above.
Discussion (0). Continue with ORCID to comment.