REVIEW 4 major objections 4 minor 12 references
Risk Analysis of Flowlines in the Oil and Gas Sector: A GIS and Machine Learning Approach
T0 review · 4 major / 4 minor · reviewed 2026-08-10 · deepseek-v4-flash
Pith's one-line read Combining GIS-derived flowline features with standard machine-learning classifiers yields spill-risk prediction with precision and recall near 0.99, establishing the potential for pre-spill risk ranking of oil and gas flowlines.
desk verdict Near-perfect flowline risk predictions are an artifact of target leakage from a post-spill feature; the paper's data-cleaning documentation is honest, but the central result doesn't survive. read the letter →
The pith
A machine-rendered reading of the paper's core claim, the machinery that carries it, and where it could break.
The reading
What carries the argument
The load-bearing object is the tabularized multilinestring GeoDataFrame: spatial geometries are converted into three scalar features—total length, number of line segments, and bounding-box area—so that standard machine-learning algorithms can consume GIS data. Around those features sits a pipeline of one-hot encoding for categorical attributes, optional principal component analysis for dimensionality reduction, and a stratified 70/30 train-test split. Spatial matching with a tolerance expanding from 0 to 25 meters, validated by operator names, is the mechanism that creates the labels: it links the operational and descriptive flowline datasets and links recorded spills to flowlines, yielding 84 positive examples used to train and test the classifiers.
What would settle it
Look up the regulator's investigation records or field inspection reports for the 84 positively labeled flowlines and determine the actual source of each spill; if a substantial share of spills came from a line other than the nearest same-operator one, re-run the classifiers on corrected labels and see whether precision and recall stay near 0.99.
Extended reading notes
Core claim
The paper's central claim is that integrating GIS-derived features with machine-learning classifiers makes extremely accurate flowline risk modeling possible, despite an imperfect dataset. Using Colorado Energy and Carbon Management Commission records, the authors integrate a descriptive flowline dataset with an operational dataset by spatial end-point matching, associate each spill with the nearest flowline operated by the same company, and convert each multilinestring geometry into length, number of line segments, and bounding-box area. On this dataset, logistic regression and support vector machines reach 0.99 precision and recall without PCA, and gradient boosting and AdaBoost reach the same level with PCA. The authors present this as evidence of potential rather than a deployed system, and they explicitly acknowledge that spatial matching errors, lost spatial information from tabularization, and limited positive examples constrain the results.
Load-bearing premise
The 84 positive labels are correct: every recorded spill truly originated from the nearest flowline with the same operator name, within the 25-meter matching tolerance.
Editorial extensions
If this is right
- Operators could use only pre-spill features to score every flowline in a region and target high-risk lines for inspection or replacement before a spill occurs.
- The feature-extraction recipe provides a transferable template for bringing multilinestring geodata into machine-learning models in other infrastructure domains.
- The K-means two-cluster result, with a silhouette score near 0.99 for two clusters, suggests the dataset's natural grouping aligns with the low-risk/high-risk split.
- Because GBDT and AdaBoost stay at 0.99 precision and recall after PCA, deployment could use a reduced feature set and lower computational cost.
- The accuracy claims stand or fall with the correctness of the 84 spill-to-flowline links, so improving spill attribution directly strengthens or weakens the risk rankings.
Reading between the lines
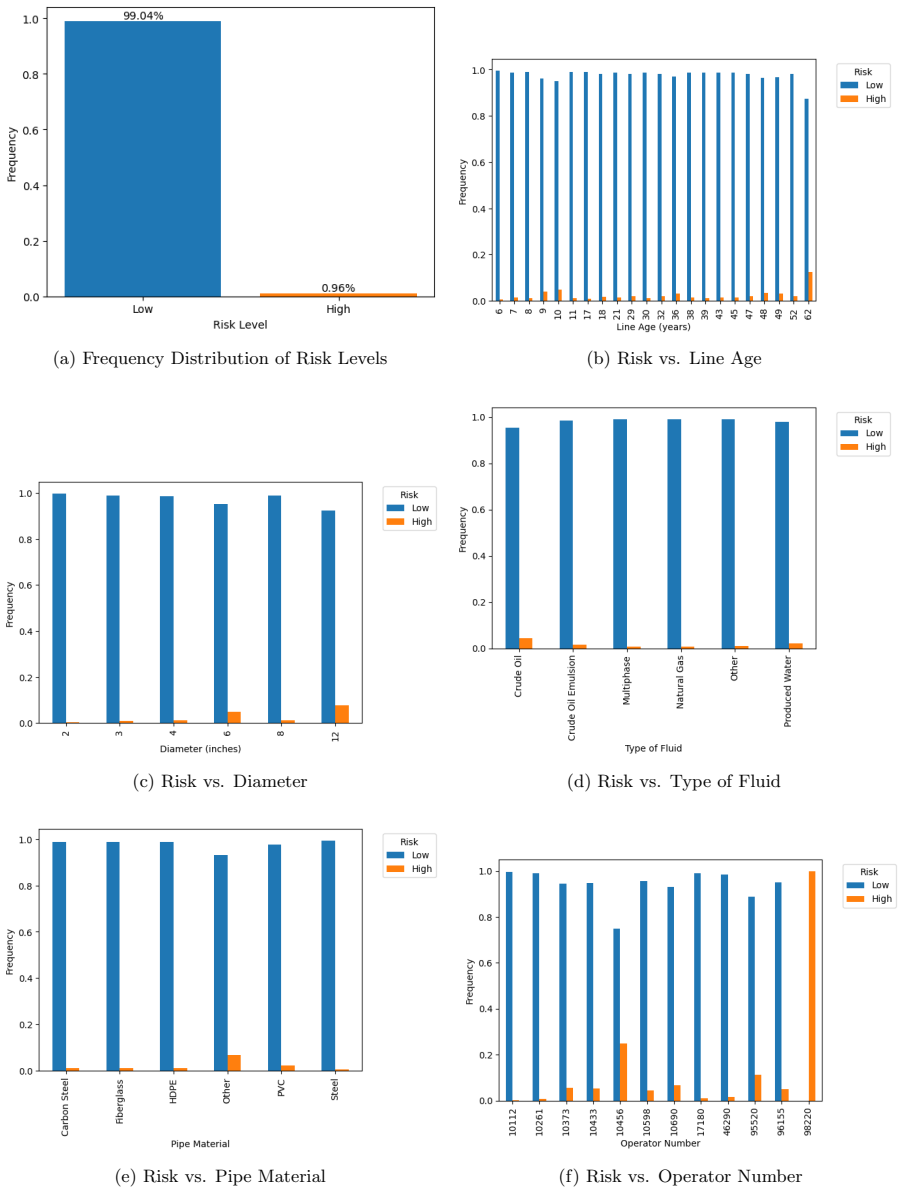
- The paper does not explicitly address class imbalance: with only about 0.96% of records labeled high risk, a 99% accuracy figure mostly reflects correct prediction of the low-risk majority, so the reported precision and recall for the positive class deserve scrutiny.
- A natural testable extension, not run in the paper, is to apply the same feature pipeline to flowline data from another state or to Colorado spills recorded after the study period and check whether the high precision transfers.
- The authors' stated plan to segment multilinestrings into single line strings at recorded spill locations would shift the model from line-level risk scoring to meter-level localization, which is the granularity an inspection crew needs.
- If the 25-meter tolerance sometimes assigns a spill to the wrong line among a cluster of same-operator lines, the mislabeled positives could distort which classifiers appear best; this is testable only with ground-truth spill origins such as release investigation reports.
Editorial analysis
A structured set of objections, weighed in public.
Referee Report
Summary. The paper presents a risk analysis of oil and gas flowlines in Colorado by integrating GIS-derived features with standard machine learning classifiers. The authors use ECMC spill and flowline data, spatially match 84 spills to flowlines, engineer features including geometric properties and one-hot-encoded categorical attributes, and train logistic regression, SVM, K-NN, gradient boosting, AdaBoost, and random forest classifiers with and without PCA. They report near-perfect accuracy, precision, recall, and F1 scores for LR and SVM (e.g., 0.99 in Table 2), and a K-Means clustering with a silhouette score near 0.99. The conclusions claim 'extremely accurate risk modeling' potential for this GIS+ML approach.
Significance. If the central claim held, the approach could offer a practical tool for prioritizing flowline monitoring and replacement, addressing a gap relative to transmission pipelines. The paper is also one of few attempts to use multilinestring GeoDataFrames as inputs to ML models, and it provides a transparent account of data-cleaning challenges. However, the reported predictive accuracy is not credible as evidence of pre-spill risk modeling: the predictor set includes a post-spill attribute (Root Cause Type) that is populated only for positive examples, and the outcome labels themselves are derived from a spatially uncertain matching procedure. These issues undermine the core claim and the reported performance metrics, so the paper's significance as a scientific contribution is presently limited.
major comments (4)
- [Feature Engineering, Table 1] Table 1 lists 'Root Cause Type' with the footnote 'Attribute included only for flowlines associated with spills,' and the Feature Engineering section states that Root Cause Type is one-hot encoded along with the other categorical attributes. Because this feature is nonzero only for the 84 positive (high-risk) flowlines, its one-hot columns are effectively perfect indicators of the target class. Any model that uses these columns can achieve near-perfect separation on the training set, and this fully explains the 0.99 precision/recall reported for LR and SVM in Table 2. The paper presents no ablation, no model trained without this feature, and no discussion of this leakage. The near-perfect results therefore do not demonstrate predictive skill for pre-spill risk, and the central claim of the Conclusions is not supported.
- [Data Description and Processing, Figs. 1-2] The outcome labels are constructed by spatially matching recorded spills to the nearest flowline with a matching operator name, using an expanding tolerance up to 25 meters, and the authors themselves state that this assumption 'was vulnerable to errors' and that only 84 of 849 spills were matched. If the matched flowline is not the true origin of the spill, the positive label is attached to the wrong flowline, corrupting the training targets. The paper provides no sensitivity analysis, no manual validation of the matched pairs, and no acknowledgment of how this uncertainty affects the reported performance. This is a separate, structural threat to validity that would remain even after removing the target-leaking feature.
- [Results, Tables 2-3] The reported evaluation does not adequately address the extreme class imbalance (0.96% high-risk versus 99.04% low-risk, Fig. 4a). The paper reports a single accuracy, precision, recall, and F1 value per classifier without specifying whether these are computed for the positive class, macro-averaged, or micro-averaged. In this imbalance regime, a trivial all-low-risk classifier would already achieve 99% accuracy. The paper needs to report positive-class precision/recall, PR curves, or other imbalance-aware metrics, and should interpret the results in light of the leakage issue.
- [Results, Tables 2 and 3] The behavior after PCA is internally inconsistent and unexplained: LR collapses to precision 0.02 and F1 0.04 under PCA (Table 3), while SVM, GBDT, and AdaBoost remain at 0.99. If the near-perfect results were driven by a single leaky one-hot feature, PCA could either preserve or destroy that feature depending on variance scaling, which might explain this split. The paper offers no explanation for why LR and K-NN degrade so dramatically while SVM does not. This pattern is a red flag that the high scores are not robust and are likely tied to the leakage variable rather than to genuine predictive structure in the pre-spill features.
minor comments (4)
- [General] There are several typographical errors, including 'Patial Matching' in the Fig. 1 caption, 'T able 1' and 'T able 2' in the text, 'maching learning' in the PCA reduction paragraph, and 'ESPG:26913' which should be 'EPSG:26913'.
- [Results, Tables 2 and 3] The column heading 'Mean F1 Score' is ambiguous; it is unclear whether this is the macro-averaged F1 over classes or the F1 for a specific class. Please clarify the definition in the text.
- [Methodology] The description of the stratified split says 70% training and 30% testing, but no details are given about whether the 84 positive examples were all present in the training set and how the test set was balanced. Please report the exact class distribution in train and test.
- [Conclusions] The statement that 'the code required to reproduce all the results presented in this manuscript is publicly available' is a good practice, but the repository should also include the matched dataset or the matching script, since the spatial matching is central to the results and cannot be reproduced from the current description alone.
Circularity Check
Target leakage via Root Cause Type: the near-perfect metrics reduce by construction, not by predictive skill.
-
self definitional
[Feature Engineering / Table 1; Methodology]
"Root Cause Type* Underlying cause of the spill [Table 1 footnote:] *Attribute included only for flowlines associated with spills. [Feature Engineering:] Attributes such as Operator Number, Flowline ID, Location ID, Status, Flowline Action, Location Type, Fluid Type, Material, and Root Cause Type were transformed using one-hot encoding."
The flowline risk label is defined earlier in Feature Engineering as 'high risk (1) if associated with a spill, or low risk (0) if no spills were recorded.' Root Cause Type is an attribute of the spill itself and Table 1 states it is included only for flowlines associated with spills. One-hot encoding it therefore manufactures binary columns whose nonzero entries occur exactly on the positive class, i.e., the feature matrix encodes the outcome. LR/SVM's reported 0.99 precision/recall in Table 2 then reflects reading the target's own attribute, not forecasting future spills. Without an ablation that removes Root Cause Type (or evidence that it is known pre-spill), the headline accuracy claim reduces by construction.
full rationale
The central claim of 'extremely accurate risk modeling' rests on Tables 2 and 3, but those tables are generated from a feature set that includes Root Cause Type, an attribute that by Table 1's own footnote exists only for flowlines already associated with spills. Since the outcome variable is precisely whether a flowline is associated with a spill, one-hot encoding Root Cause Type creates indicator columns that are nonzero exactly on positive examples. Any classifier can use those columns to identify the positive class, so the reported precision/recall near 0.99 is forced by construction rather than by predictive skill. The paper provides no ablation withholding Root Cause Type or re-fitting on pre-spill features only, and it does not otherwise claim this variable would be available before a spill. The spill-to-flowline matching uncertainty is a serious label-quality concern, but the target leakage via Root Cause Type is sufficient on its own to make the headline accuracy circular. Other aspects of the paper, such as the GIS feature extraction, EDA, and K-Means clustering, are not circular.
Assumptions & free parameters
free parameters (3)
- Spatial matching tolerance =
0 to 25 meters
- Number of clusters for K-Means =
2
- ML model hyperparameters =
not reported
assumptions (4)
- domain assumption Spatial proximity and operator name identify the source flowline of a spill
- domain assumption ECMC datasets are complete and accurate enough for modeling
- standard math PCA retains the most informative features via maximum variance
- ad hoc to paper Root Cause Type is a valid predictor without leaking the target
Cite this review
Pith. "Pith review of Risk Analysis of Flowlines in the Oil and Gas Sector: A GIS and Machine Learning Approach." pith.science (2026). https://pith.science/paper/TUXMVPJN
@misc{pith2026250111213,
  author       = {Pith},
  title        = {Pith review of: Risk Analysis of Flowlines in the Oil and Gas Sector: A GIS and Machine Learning Approach},
  year         = {2026},
  howpublished = {\url{https://pith.science/paper/TUXMVPJN}},
  note         = {Machine review of arXiv:2501.11213}
}
read the original abstract
This paper presents a risk analysis of flowlines in the oil and gas sector using Geographic Information Systems (GIS) and machine learning (ML). Flowlines, vital conduits transporting oil, gas, and water from wellheads to surface facilities, often face under-assessment compared to transmission pipelines. This study addresses this gap using advanced tools to predict and mitigate failures, improving environmental safety and reducing human exposure. Extensive datasets from the Colorado Energy and Carbon Management Commission (ECMC) were processed through spatial matching, feature engineering, and geometric extraction to build robust predictive models. Various ML algorithms, including logistic regression, support vector machines, gradient boosting decision trees, and K-Means clustering, were used to assess and classify risks, with ensemble classifiers showing superior accuracy, especially when paired with Principal Component Analysis (PCA) for dimensionality reduction. Finally, a thorough data analysis highlighted spatial and operational factors influencing risks, identifying high-risk zones for focused monitoring. Overall, the study demonstrates the transformative potential of integrating GIS and ML in flowline risk management, proposing a data-driven approach that emphasizes the need for accurate data and refined models to improve safety in petroleum extraction.
Figures


Figures from the paper (4 more)


Reference graph
Works this paper leans on
-
[1]
A model for predicting failure of oil pipelines,
Ahmed Senouci, Mohamed Elabbasy, Emad Elwakil, Bassem Abdrabou, and Tarek Zayed, “A model for predicting failure of oil pipelines,” Structure and Infrastructure Engineering, vol. 10, no. 3, pp. 375-387, 2014. DOI: 10.1080/15732479.2012.756918
-
[2]
Applications of machine learn- ing in pipeline integrity management: A state-of-the-art review,
Andika Rachman, Tieling Zhang, and R.M. Chandima Ratnayake, “Applications of machine learn- ing in pipeline integrity management: A state-of-the-art review,” International Journal of Pressure Vessels and Piping, vol. 193, 2021. https://doi.org/10.1016/j.ijpvp.2021.104471
arXiv 2021
-
[3]
Annual Flowline Spill Report - 2019,
Colorado Oil & Gas Conservation Commission, “Annual Flowline Spill Report - 2019,” 22Denver, Colorado, USA, January 1, 2019 – December 30, 2019
work page 2019
-
[4]
Hossein Khalilpasha and Justin Brown, “Minimising Pipeline Leaks and Maximising Operational Life by Application of Machine Learning at Cooper Basin,” presented at the AMPP Annual Conference + Expo, Denver, Colorado, USA, March 2023
work page 2023
-
[5]
Estimating Corrosion Growth Rate for Underground Pipeline: A Machine Learning Based Approach,
Joseph Mazzella, Thomas Hayden, Len Krissa, and Haralampos Tsaprailis, “Estimating Corrosion Growth Rate for Underground Pipeline: A Machine Learning Based Approach,” presented at the CORROSION 2019, Nashville, Tennessee, USA, March 2019
work page 2019
-
[6]
Lam Hong Lee, Rajprasad Rajkumar, Lai Hung Lo, Chin Heng Wan, and Dino Isa, “Oil and gas pipeline failure prediction system using long range ultrasonic transducers and Euclidean-Support Vector Machines classification approach,” Expert Systems with Applications, vol. 40, no. 6, pp. 1925- 1934, 2013. https://doi.org/10.1016/j.eswa.2012.10.006
-
[7]
Development of a model for ranking field pipelines based on risk assessment in exploitation,
P. V. Vinogradov, K. V. Litvinenko, R. I. Valiakhmetov, and A. N. Bakhtegareeva, “Development of a model for ranking field pipelines based on risk assessment in exploitation,” OIJ, vol. 2018, pp. 84–86, 2018. doi: 10.24887/0028-2448-2018-8-84-86
-
[8]
Application of Probabilistic Model in Pipeline Direct Assessment,
Shan Guan, Francois Ayello, Narasi Sridhar, Xiaoming Han, Qingshan Feng, and Yonghe Yang, “Application of Probabilistic Model in Pipeline Direct Assessment,” presented at the CORROSION 2019, Nashville, Tennessee, USA, March 2019
work page 2019
Show all 12 references
-
[9]
Flowline Risk Review – Final Report,
William Fleckenstein, “Flowline Risk Review – Final Report,” presented to Mark Schlagenhauf and Stuart Ellsworth, Colorado School of Mines, Golden, Colorado, USA, October 2018
2018
-
[10]
A Prediction of Corrosion-Related Leakage on Distribution Pipelines via Machine Learning Method,
Zhuoran Zhang and Guanlan Liu, “A Prediction of Corrosion-Related Leakage on Distribution Pipelines via Machine Learning Method,” presented at the AMPP Annual Conference + Expo, Den- ver, Colorado, USA, March 2023
2023
-
[11]
Random Forests,
L. Breiman, “Random Forests,” Machine Learning, vol. 45, no. 1, pp. 5–32, 2001. doi: 10.1023/A:1010933404324
2001 doi
-
[12]
Hastie, R
T. Hastie, R. Tibshirani, and J. Friedman, The Elements of Statistical Learning: Data Mining, Inference, and Prediction, 2nd ed. New York, NY, USA: Springer, 2009. doi: 10.1007/978-0-387- 84858-7. 13
2009 doi
Reviewed August 10, 2026 · model on record in the stance chip above.
Discussion (0). Continue with ORCID to comment.