Leveraging graph neural networks and mobility data for COVID-19 forecasting
Pith reviewed 2026-05-23 04:46 UTC · model grok-4.3
The pith
Graph neural networks using sparsified mobility networks outperform LSTMs for daily COVID-19 case forecasts in Brazil and China.
A machine-rendered reading of the paper's core claim, the machinery that carries it, and where it could break.
Core claim
Structural sparsification of mobility graphs combined with GNN architectures (GCRN and GCLSTM) yields statistically significant gains over LSTM baselines on daily case counts from Brazil and China, while the same architectures show no advantage on cumulative series; backbone extraction is presented as the key step that removes negligible connections and improves stability.
What carries the argument
Backbone extraction applied to human mobility networks to produce sparse graphs that are then fed to graph convolutional recurrent networks (GCRN) and graph convolutional LSTMs (GCLSTM) for joint spatial-temporal prediction.
If this is right
- Spatial dependencies captured by GNNs become essential once daily rather than cumulative counts are the target.
- Backbone extraction improves both accuracy and stability of spatio-temporal forecasts.
- Temporal granularity of the input series determines whether GNNs or pure temporal baselines are preferable.
- Framing epidemic forecasting as binary classification clarifies the trade-off between context size and prediction horizon.
Where Pith is reading between the lines
- The same sparsification-plus-GNN pipeline could be tested on other mobility-linked outbreaks to check whether daily volatility is the general trigger for spatial modeling.
- Real-time updates to the mobility backbone might allow the models to adapt faster to policy changes or new variants than static graphs permit.
- If the binary-classification view holds, epidemic early-warning systems could be tuned by optimizing context length rather than by adding more complex architectures.
Load-bearing premise
The mobility networks accurately represent the spatial dependencies that drive transmission and backbone extraction discards only non-predictive edges.
What would settle it
Re-running the daily-case experiments on the same Brazil and China datasets but with the unsparsified full mobility graph or an alternative mobility source that produces no statistically significant GNN advantage over LSTM would falsify the central performance claim.
Figures


read the original abstract
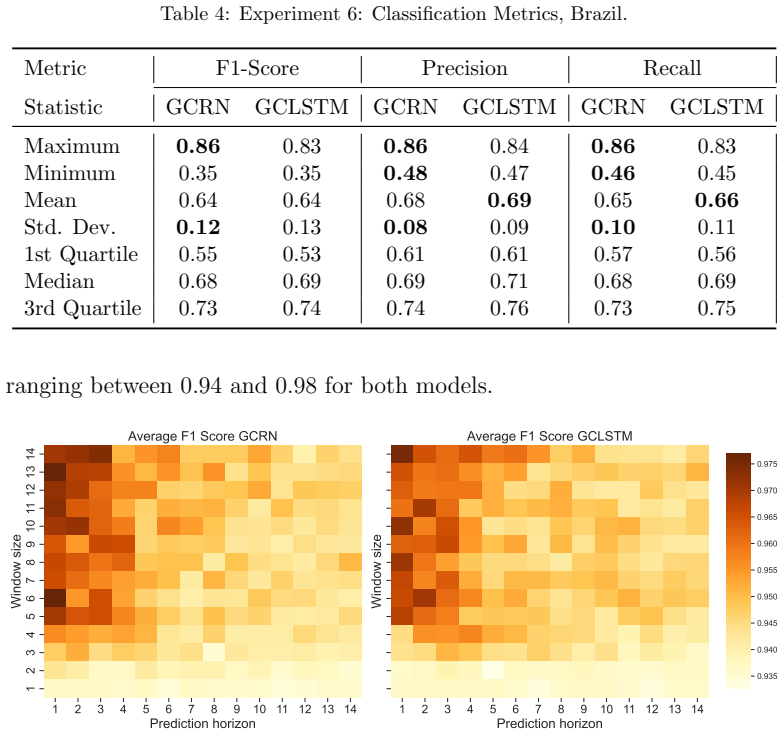
The COVID-19 pandemic has claimed millions of lives, spurring the development of diverse forecasting models. In this context, the true utility of complex spatio-temporal architectures versus simpler temporal baselines remains a subject of debate. Here, we show that structural sparsification of the input graph and temporal granularity are determining factors for the effectiveness of Graph Neural Networks (GNNs). By leveraging human mobility networks in Brazil and China, we address a conflicting scenario in the literature: while standard LSTMs suffice for smooth, monotonic cumulative trends, GNNs significantly outperform baselines when forecasting volatile daily case counts. We show that backbone extraction substantially enhances predictive stability and reduces predictive error by removing negligible connections. Our results indicate that incorporating spatial dependencies is essential for modeling complex dynamics. Specifically, GNN architectures such as GCRN and GCLSTM outperform the LSTM baseline (Nemenyi test, p < 0.05) on datasets from Brazil and China for daily case predictions. Lastly, we frame the problem as a binary classification task to better analyze the dependency between context sizes and prediction horizons.
Editorial analysis
A structured set of objections, weighed in public.
Referee Report
Summary. The manuscript claims that GNN architectures (GCRN, GCLSTM) outperform LSTM baselines for daily COVID-19 case forecasting on Brazil and China mobility networks (Nemenyi p<0.05), that backbone extraction via sparsification improves stability and reduces error by removing negligible connections, and that spatial dependencies encoded in the mobility graphs are essential for volatile daily counts (while LSTMs suffice for smooth cumulative trends). It additionally frames forecasting as binary classification to examine context-size vs. horizon dependencies.
Significance. If the results hold after appropriate controls, the work would clarify when and why GNNs add value over temporal baselines in epidemic forecasting and demonstrate the utility of mobility-graph sparsification, providing actionable guidance for spatio-temporal model selection in public-health applications.
major comments (2)
- [Experimental results] The experimental comparison of GNNs to LSTM (reported in the results on daily-case predictions) does not include an ablation replacing the empirical mobility adjacency matrix with a degree-matched random graph or other null model while holding architecture, training, and temporal granularity fixed. This control is required to substantiate the claim that the specific mobility-derived structure (rather than GNN inductive bias or sparsification alone) drives the reported gains.
- [Results on sparsification] The assertion that backbone extraction 'substantially enhances predictive stability and reduces predictive error' lacks quantification of the edge-removal fraction, before/after performance deltas with error bars, and a check that predictive signal is retained rather than discarded; these details are load-bearing for the sparsification claim.
minor comments (2)
- [Methods] Dataset sizes, exact preprocessing steps, number of nodes/edges in the mobility networks, and sparsification threshold values should be stated explicitly (currently referenced only at a high level) to support reproducibility.
- [Introduction] Ensure first-use definitions for all acronyms (GCRN, GCLSTM) and consistent notation for the binary-classification reformulation.
Simulated Author's Rebuttal
We thank the referee for the constructive feedback. The suggested controls will strengthen the manuscript's claims about the role of mobility-graph structure and the benefits of sparsification. We address each major comment below and will incorporate the requested analyses.
read point-by-point responses
-
Referee: [Experimental results] The experimental comparison of GNNs to LSTM (reported in the results on daily-case predictions) does not include an ablation replacing the empirical mobility adjacency matrix with a degree-matched random graph or other null model while holding architecture, training, and temporal granularity fixed. This control is required to substantiate the claim that the specific mobility-derived structure (rather than GNN inductive bias or sparsification alone) drives the reported gains.
Authors: We agree that a null-model ablation is necessary to isolate the contribution of the empirical mobility structure. In the revised manuscript we will add this control: the empirical adjacency matrix will be replaced by a degree-matched random graph while keeping the GNN architecture (GCRN/GCLSTM), training procedure, temporal granularity, and sparsification (where applicable) identical. Results will be reported alongside the original experiments with the same statistical testing. revision: yes
-
Referee: [Results on sparsification] The assertion that backbone extraction 'substantially enhances predictive stability and reduces predictive error' lacks quantification of the edge-removal fraction, before/after performance deltas with error bars, and a check that predictive signal is retained rather than discarded; these details are load-bearing for the sparsification claim.
Authors: We acknowledge that the current manuscript provides insufficient quantitative detail on sparsification. The revision will report: (1) the precise fraction of edges removed by backbone extraction on each dataset, (2) before/after performance metrics (MAE, RMSE, and stability measures) with error bars across multiple random seeds, and (3) a control comparing backbone extraction against random edge removal at the same density to verify that predictive signal is retained rather than discarded. revision: yes
Circularity Check
No significant circularity; purely empirical evaluation
full rationale
The manuscript reports experimental comparisons of GCRN, GCLSTM, and LSTM models on Brazil/China mobility-augmented COVID-19 time series, with performance assessed via Nemenyi tests. No equations, derivations, fitted parameters renamed as predictions, uniqueness theorems, or ansatzes appear in the text. All claims rest on held-out forecasting metrics and statistical tests performed on external datasets, rendering the evaluation self-contained and independent of any definitional or self-citational reduction.
Axiom & Free-Parameter Ledger
Reference graph
Works this paper leans on
-
[1]
V. L. S. Freitas, T. C. R. O. Konstantyner, J. F. Mendes, C. S. N. Sepetauskas, L. B. L. Santos, The correspondence between the struc- ture of the terrestrial mobility network and the spreading of covid-19 in brazil, Cadernos de Sa´ ude P´ ublica 36 (2020) e00184820
work page 2020
-
[2]
V. L. Freitas, G. J. Moreira, L. B. Santos, Robustness analysis in an inter-cities mobility network: modeling municipal, state and federal ini- tiatives as failures and attacks toward sars-cov-2 containment, PeerJ 8 (2020) e10287
work page 2020
-
[3]
M. Mu˜ noz-Organero, P. Callejo, M.´A. Hombrados-Herrera, A new rnn based machine learning model to forecast covid-19 incidence, enhanced by the use of mobility data from the bike-sharing service in madrid, Heliyon 9 (6) (2023)
work page 2023
- [4]
- [5]
- [6]
-
[7]
H. Li, R. Wei, W. Wang, N. Yu, Predicting covid-19 transmission in southern california with machine learning methods, in: 2024 9th Inter- national Conference on Big Data Analytics (ICBDA), IEEE, 2024, pp. 1–10. 24
work page 2024
-
[8]
F. H. O. Duarte, G. J. P. Moreira, E. J. S. Luz, L. B. L. Santos, V. L. S. Freitas, Time series forecasting of covid-19 cases in brazil with gnn and mobility networks, in: M. C. Naldi, R. A. C. Bianchi (Eds.), Intelligent Systems, Springer Nature Switzerland, Cham, 2023, pp. 361–375
work page 2023
-
[9]
Y. Seo, M. Defferrard, P. Vandergheynst, X. Bresson, Structured se- quence modeling with graph convolutional recurrent networks, in: Neu- ral Information Processing, 2018, pp. 362–373
work page 2018
-
[10]
J. Chen, X. Wang, X. Xu, Gc-lstm: graph convolution embedded lstm for dynamic network link prediction, Applied Intelligence 52 (7) (2022) 7513–7528
work page 2022
-
[11]
C. Comito, C. Pizzuti, Artificial intelligence for forecasting and diagnosing covid-19 pandemic: A focused review, Arti- ficial Intelligence in Medicine 128 (2022) 102286. doi:https: //doi.org/10.1016/j.artmed.2022.102286. URL https://www.sciencedirect.com/science/article/pii/ S0933365722000513
-
[12]
R. P. Joshi, V. Pejaver, N. E. Hammarlund, H. Sung, S. K. Lee, A. Furmanchuk, H.-Y. Lee, G. Scott, S. Gombar, N. Shah, S. Shen, A. Nassiri, D. Schneider, F. S. Ahmad, D. Liebovitz, A. Kho, S. Mooney, B. A. Pinsky, N. Banaei, A predictive tool for identifica- tion of sars-cov-2 pcr-negative emergency department patients using routine test results, Journal ...
-
[13]
B. Pirouz, S. Shaffiee Haghshenas, S. Shaffiee Haghshenas, P. Piro, Investigating a serious challenge in the sustainable development pro- cess: Analysis of confirmed cases of covid-19 (new type of coronavirus) through a binary classification using artificial intelligence and regression analysis, Sustainability 12 (6) (2020). doi:10.3390/su12062427. URL ht...
-
[14]
F. H. O. Duarte, G. J. Moreira, E. J. Luz, L. B. Santos, V. L. Freitas, Correlations between epidemiological time series forecasting and influence regions of brazilian cities, 2023, p. 363 – 368, cited by: 0. 25 URL https://www.scopus.com/inward/record. uri?eid=2-s2.0-85181098306&partnerID=40&md5= f60d73eee623d21c9b7119bbc4407319
work page 2023
-
[15]
M. R. Davahli, K. Fiok, W. Karwowski, A. M. Aljuaid, R. Taiar, Predict- ing the dynamics of the covid-19 pandemic in the united states using graph theory-based neural networks, International journal of environ- mental research and public health 18 (7) (2021) 3834
work page 2021
-
[16]
H. Xie, D. Li, Y. Wang, Y. Kawai, Visualization method for the spread- ing curve of covid-19 in universities using gnn, in: 2022 IEEE Inter- national Conference on Big Data and Smart Computing (BigComp), IEEE, 2022, pp. 121–128
work page 2022
-
[17]
D. Fanelli, F. Piazza, Analysis and forecast of covid-19 spreading in china, italy and france, Chaos, Solitons & Fractals 134 (2020) 109761
work page 2020
-
[18]
C.-P. Kuo, J. S. Fu, Evaluating the impact of mobility on covid-19 pandemic with machine learning hybrid predic- tions, Science of The Total Environment 758 (2021) 144151. doi:https://doi.org/10.1016/j.scitotenv.2020.144151. URL https://www.sciencedirect.com/science/article/pii/ S0048969720376828
-
[19]
F. Menczer, S. Fortunato, C. A. Davis, A First Course in Network Sci- ence, Cambridge University Press, 2020. doi:10.1017/9781108653947
-
[20]
C. H. Gomes Ferreira, F. Murai, A. P. C. Silva, M. Trevisan, L. Vassio, I. Drago, M. Mellia, J. M. Almeida, On network backbone extraction for modeling online collective behavior, PLOS ONE 17 (9) (2022) 1–36. doi:10.1371/journal.pone.0274218. URL https://doi.org/10.1371/journal.pone.0274218
-
[21]
Z. Wu, S. Pan, F. Chen, G. Long, C. Zhang, P. S. Yu, A comprehen- sive survey on graph neural networks, IEEE Transactions on Neural Networks and Learning Systems 32 (2021) 4–24. doi:10.1109/TNNLS. 2020.2978386
-
[22]
M. Niepert, M. Ahmed, K. Kutzkov, Learning convolutional neural net- works for graphs, in: International conference on machine learning, PMLR, 2016, pp. 2014–2023. 26
work page 2016
-
[23]
T. N. Kipf, M. Welling, Semi-supervised classification with graph con- volutional networks, arXiv preprint arXiv:1609.02907 (2016)
work page internal anchor Pith review Pith/arXiv arXiv 2016
-
[24]
IBGE, Liga¸ c˜ oes rodovi´ arias e hidrovi´ arias: 2016, IBGE, Coordena¸ c˜ ao de Geografia Rio de Janeiro, Brazil, 2017
work page 2016
-
[25]
China Data Lab, Baidu Mobility Data (2020). doi:10.7910/DVN/ FAEZIO. URL https://doi.org/10.7910/DVN/FAEZIO
-
[26]
W. Cota, Monitoring the number of covid-19 cases and deaths in brazil at municipal and federative units level, SciELO Preprints (2020)
work page 2020
-
[27]
Harvard Global Health Institute and Harvard’s Edmond J. Safra Center for Ethics, Key metrics for covid suppression a framework for policy makers and the public (2020)
work page 2020
-
[28]
M. Jin, H. Y. Koh, Q. Wen, D. Zambon, C. Alippi, G. I. Webb, I. King, S. Pan, A survey on graph neural networks for time series: Forecasting, classification, imputation, and anomaly detection, IEEE Transactions on Pattern Analysis and Machine Intelligence 46 (12) (2024) 10466–10485. doi:10.1109/TPAMI.2024.3443141. 27
discussion (0)
Sign in with ORCID, Apple, or X to comment. Anyone can read and Pith papers without signing in.