REVIEW 3 major objections 5 minor 12 references
Quantification via Gaussian Latent Space Representations
T0 review · 3 major / 5 minor · reviewed 2026-08-10 · deepseek-v4-flash
Pith's one-line read Modeling a bag of examples by the average likelihood of its members under learnable multivariate Gaussians in latent spaces yields the best multiclass prevalence estimates on the LeQua benchmarks.
desk verdict A useful but not yet decisive bag-representation paper: the architecture is clearly better than HistNetQ in data efficiency, but the SOTA claim rests on single runs and untuned baselines. read the letter →
The pith
A machine-rendered reading of the paper's core claim, the machinery that carries it, and where it could break.
The reading
What carries the argument
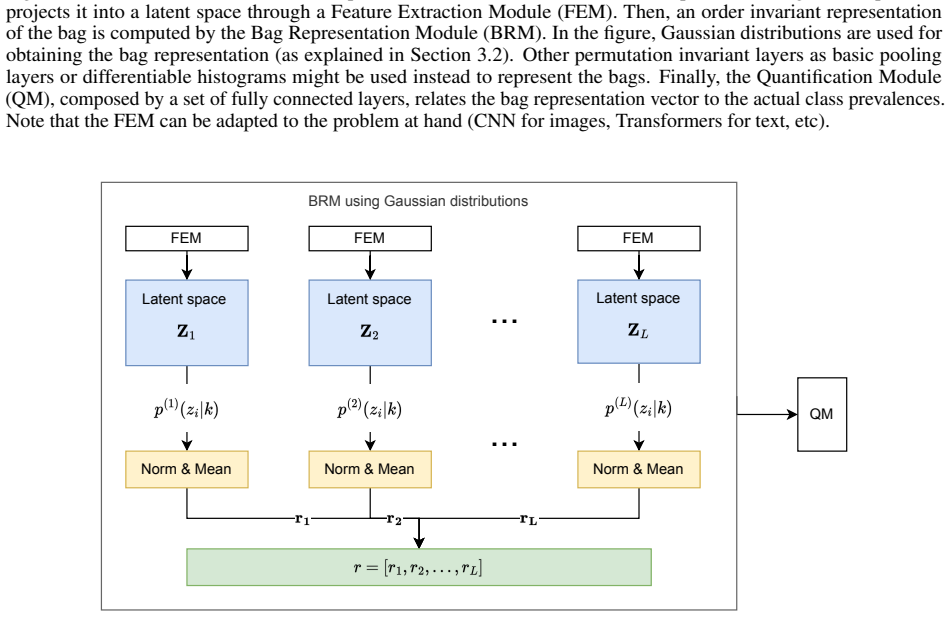
The core object is the Gaussian bag-representation module. For each of L latent spaces of dimension d, the network places K multivariate Gaussians with learnable means $\mu_k$ and positive-definite covariances $\Sigma_k$, with a sigmoid bounding each latent space to the unit hypercube. For each example $z_i$ it computes Gaussian likelihoods $p(z_i|k)$, averages them over the bag to obtain $\bar{p}(k)$, and concatenates these K mean-likelihood values per latent space into the bag vector $r$. The representation is permutation-invariant because averaging over the bag is order-free, continuous rather than binned, and the covariance lets it capture correlations between features. Training adds a Centered Kernel Alignment penalty that encourages the L latent spaces to be dissimilar, and covariances are kept positive-definite via manifold-constrained optimization; Gaussian centers are initialized uniformly with diagonal covariances derived from half the mean of minimum pairwise center distances.
What would settle it
Re-run the LeQua T1B, T2, and T3 comparisons with every deep method given the same exhaustive hyperparameter search, including histogram bin counts, number of Gaussians, and regularization weight, and with test statistics averaged over multiple training seeds; if a tuned HistNetQ reaches or beats GMNet's RAE on T1B and T2, the claim that Gaussian latent-space representations are superior would be refuted.
Extended reading notes
Core claim
On its own terms, the paper's central claim is that replacing the bag-representation module matters more than the surrounding architecture: with the same feature-extraction and quantification modules and only the bag-summarization layer changed, the Gaussian-likelihood layer outperforms average, median, and max pooling and HistNetQ's differentiable histograms. Concretely, GMNet reports RAE 0.6728 in the U setting and 0.5433 in the U+APP setting on T1B versus HistNetQ's 0.6989 and 0.5711, and 0.8816 and 0.7062 on T2 versus 0.9162 and 0.7455. On the ordinal task T3 its NMD of 0.0502 and 0.0498 trails HistNetQ's 0.0489 and 0.0467. The authors also show that GMNet needs less data than HistNetQ to stay competitive, and that a CKA-based regularizer that pushes separate latent spaces apart provides a small improvement on the multiclass tasks.
Load-bearing premise
The headline result depends on the assumption that the bag-representation module, not the choice of hyperparameters, is what makes GMNet beat HistNetQ and DQN.
Editorial extensions
If this is right
- Quantification becomes a direct optimization problem: bag prevalence can be predicted end-to-end with the chosen loss, RAE or NMD, and no intermediate classifier or prior-probability-shift correction is needed.
- Prevalence-labeled bags alone are enough to train a competitive quantifier; adding synthetic bags generated under prior shift via the APP protocol improves results further.
- On the multiclass benchmark tasks, the choice of bag representation is the deciding factor among deep quantifiers, with the Gaussian layer beating pooling and differentiable histograms under identical surrounding architecture.
- GMNet is less data-hungry than HistNetQ, staying competitive when only a few hundred prevalence-labeled bags are available.
- The advantage is not uniform: on the ordinal task T3, HistNetQ's histograms remain slightly better, so the Gaussian representation is not a universal replacement for histogram-based bag summaries.
Reading between the lines
- The same Gaussian-likelihood representation could be dropped into any permutation-invariant set processor, such as label-proportion learning or set regression, where the LeQua results suggest it may carry information that pooling discards.
- Because the averaged likelihood is a soft, continuous analogue of a histogram, a testable extension is to let the number of Gaussians K and their covariances adapt per class or per latent dimension rather than being fixed globally.
- The data-scarcity trend implies a concrete prediction: on domains where bags are small and few, GMNet's gap over histogram and pooling baselines should grow, which could be checked with synthetic bags from unrelated datasets.
- The CKA regularizer's benefit appearing only on the 28-class tasks suggests that diversity among latent spaces pays off when the prevalence vector is high-dimensional; an extension would be to scale the regularization weight with the number of classes.
Signed reviews
Editorial analysis
A structured set of objections, weighed in public.
Referee Report
Summary. The paper proposes GMNet, an end-to-end deep quantification method whose bag representation module (BRM) models latent-space activations with learnable multivariate Gaussian distributions. Instead of pooling or histograms, the BRM computes mean Gaussian likelihoods per component and concatenates these across several latent spaces, optionally with a CKA-based diversity regularizer. The network is trained directly on bags annotated by prevalence, optimizing the task loss (RAE or NMD). Experiments on LeQua 2022/2024 datasets (T1B, T2, T3) compare GMNet against traditional quantifiers and deep baselines (DQN, HistNetQ) under two data settings (U and U+APP). The authors report state-of-the-art results on T1B and T2 and slightly worse performance than HistNetQ on T3, and they provide an additional data-availability study and a regularizer ablation.
Significance. If the experimental comparison were fully controlled, the paper would make a useful contribution: it introduces a novel, permutation-invariant bag representation that is continuous and captures feature correlations, and it shows that this representation improves over pooling and histogram baselines on large public multiclass quantification benchmarks. The code is publicly available, the evaluation uses standard competition datasets and official metrics (RAE, NMD), and the paper explicitly discusses a model-specific regularizer and initialization scheme. These are concrete strengths. However, the central state-of-the-art claim currently rests on a comparison in which GMNet's hyperparameters appear to have been selected more carefully than those of the deep baselines, and all deep methods are evaluated on a single training run. The reported standard deviations are over test bags only, so they do not quantify training-seed variability. The paper's own statement in Section 4.2 that 'an exhaustive hyperparameter search for deep learning methods was not feasible' flags this as the main weakness.
major comments (3)
- [Section 4.2, Table 1] The claim that GMNet achieves state-of-the-art results is not yet supported because the comparison does not isolate the bag representation module. The paper states that all deep methods use the same architecture and vary only the BRM, which is good, but it also states that 'an exhaustive hyperparameter search for deep learning methods was not feasible due to limited resources.' GMNet's hyperparameters (K=100, latent dimension 5, 9 latent spaces, lambda=0.01) are fixed, while HistNetQ uses a single 32-bin histogram and DQN uses untuned pooling. The performance margins over HistNetQ on T1B U+APP (RAE 0.5433 vs 0.5711) and T2 U+APP (0.7062 vs 0.7455) are only about 5-6% relative, and the reported standard deviations are over the 5,000 test bags, not over network initializations. With one training run per method, these margins could plausibly lie within seed noise or reflect a more favorable hyperparameter allocation for GMNet. Please report results over multiple seeds and include significance tests, or tune the baselines' hyperparameters on validation data to the same degree as GMNet's.
- [Abstract and Section 5] The abstract claims 'Our method achieves state-of-the-art results, both against traditional quantification methods and other deep learning approaches,' but Table 1 shows that on T3 in the U+APP setting GMNet (NMD 0.0498) is worse than HistNetQ (NMD 0.0467). The conclusion appropriately limits the claim to T1B and T2, but the abstract and introduction do not. Please qualify the state-of-the-art statement to the multiclass tasks, or explain why T3 is not considered in that claim.
- [Section 4.4, Table 2] Table 2 does not state whether the results are for the U or U+APP setting, but it is presumably U+APP given the values in Table 1. More importantly, the lambda value used in the main experiments (0.01) is not the best on T1B: lambda=0.1 gives RAE 0.5307 and lambda=0.001 gives 0.5345, both better than 0.01's 0.5433. This indicates that the fixed lambda is a suboptimal choice for at least one dataset, which is not in itself problematic, but it should be acknowledged and the setting must be specified. Otherwise the reader cannot tell whether the main results would improve further under a tuned lambda.
minor comments (5)
- [Equation (9)] The formula for the covariance initialization is hard to parse in the current typesetting; the denominator 2 and the exponent are misplaced. Please rewrite it clearly, e.g., \Sigma_{ii} = ( \mathrm{mean}_i( \min_{j \neq i} |\mu_i - \mu_j| ) / 2 )^2, and check that the text matches the code.
- [Figure 3 caption] The caption refers to 'L1' as the loss being minimized at different epochs, but L1 is not defined in the text. Define it (presumably the L1 loss or mean absolute error) in the caption or in Section 3.2.
- [Section 4.2] The sentence 'All networks were trained using an identical procedure to ensure comparability' is followed by early stopping details, but no information is given about learning rate, optimizer, batch size, or number of epochs before early stopping. Please provide the full training configuration in the text or supplement, since reproducibility is claimed.
- [Section 4.3] In Figures 4 and 5, the x-axis is labeled 'Thousands of labeled examples' but the description refers to 'training bags' (e.g., '200k examples (200 training bags)'). Please clarify the relationship between examples and bags in these figures, and state whether the x-axis is the number of labeled examples used to generate training bags or the number of training bags.
- [References] The text mentions 'an algorithm like Kraemer' but the reference is to Smith and Tromble (2004); the algorithm name should be spelled consistently and linked to the correct citation.
Circularity Check
No circularity: GMNet's derivation is self-contained and evaluated against held-out LeQua benchmarks.
full rationale
The paper's central claim is that a bag representation based on averaged multivariate Gaussian likelihoods improves quantification accuracy. This is an empirical claim tested on held-out test bags from LeQua 2022/2024, with GMNet trained end-to-end by minimizing RAE/NMD on training and validation bags. The Gaussian parameters are learned, not defined in terms of the test prevalences they predict; Equations (5)-(8) define the representation from learnable Gaussians and bag examples, and the QM maps that representation to prevalence estimates. No fitted parameter is renamed as a prediction: the hyperparameters (K=100, latent dimension 5, L=9, lambda=0.01) are fixed before evaluation, and the lambda ablation in Table 2 is an optimization study, not a prediction. The paper does cite prior work by the same authors for HistNetQ, the Bag Mixer, and the APP protocol, but these citations are to independently published, code-reproducible methods and external benchmarks; they do not inject the target result into the premises. The acknowledged lack of exhaustive hyperparameter search for deep baselines (Section 4.2) is a potential threat to the strength of the state-of-the-art conclusion, but it is an experimental-robustness concern, not a circularity. No equation in the paper reduces a derived quantity to an input by construction.
Assumptions & free parameters
free parameters (4)
- Number of Gaussian components K per latent space =
100
- Latent space dimension d =
5
- Number of latent spaces L =
9
- CKA regularization weight lambda =
0.01
assumptions (4)
- domain assumption Averaged Gaussian likelihoods over examples provide a sufficient permutation-invariant bag representation for quantification.
- domain assumption LeQua T1B, T2, and T3 benchmarks with prior probability shift are representative of the quantification problem.
- ad hoc to paper CKA-based diversity regularization helps the network find more informative latent spaces.
- ad hoc to paper The compared deep methods receive a level playing field despite uneven hyperparameter tuning.
Cite this review
Pith. "Pith review of Quantification via Gaussian Latent Space Representations." pith.science (2026). https://pith.science/paper/2XRZCOT7
@misc{pith2026250113638,
  author       = {Pith},
  title        = {Pith review of: Quantification via Gaussian Latent Space Representations},
  year         = {2026},
  howpublished = {\url{https://pith.science/paper/2XRZCOT7}},
  note         = {Machine review of arXiv:2501.13638}
}
read the original abstract
Quantification, or prevalence estimation, is the task of predicting the prevalence of each class within an unknown bag of examples. Most existing quantification methods in the literature rely on prior probability shift assumptions to create a quantification model that uses the predictions of an underlying classifier to make optimal prevalence estimates. In this work, we present an end-to-end neural network that uses Gaussian distributions in latent spaces to obtain invariant representations of bags of examples. This approach addresses the quantification problem using deep learning, enabling the optimization of specific loss functions relevant to the problem and avoiding the need for an intermediate classifier, tackling the quantification problem as a direct optimization problem. Our method achieves state-of-the-art results, both against traditional quantification methods and other deep learning approaches for quantification. The code needed to reproduce all our experiments is publicly available at https://github.com/AICGijon/gmnet.
Figures


Figures from the paper (2 more)


Reference graph
Works this paper leans on
-
[6]
Quantification via Prob- ability Estimators
Antonio Bella, Cesar Ferri, José Hernández-Orallo, and María José Ramírez-Quintana. Quantification via Prob- ability Estimators. In 2010 IEEE International Conference on Data Mining , pages 737–742, December
work page 2010
-
[12]
On learning from label proportions
Felix X Yu, Krzysztof Choromanski, Sanjiv Kumar, Tony Jebara, and Shih-Fu Chang. On learning from label proportions. arXiv preprint arXiv:1402.5902,
-
[2002]
doi:10.1162/089976602753284446
ISSN 0899-7667. doi:10.1162/089976602753284446. Andrea Esuli, Alejandro Moreo, Fabrizio Sebastiani, and Gianluca Sperduti. A detailed overview of LeQua@CLEF 2022: Learning to quantify. In CLEF 2022 - Conference and Labs of the Evaluation Forum, volume 3180 of CEUR Workshop Proceedings, pages 1849–1868,
-
[2008]
ISSN 1573-756X. doi:10.1007/s10618-008-0097-y. Zachary Lipton, Yu-Xiang Wang, and Alexander Smola. Detecting and correcting for label shift with black box predictors. In ICML, pages 3122–3130. PMLR,
-
[2010]
doi:10.1109/ICDM.2010.75. ISSN: 2374-8486. André Maletzke, Denis dos Reis, Everton Cherman, and Gustavo Batista. DyS: A Framework for Mixture Models in Quantification. In Proceedings of the AAAI Conference on Artificial Intelligence, volume 33, pages 4552–4560,
-
[2013]
ISSN 0020-0255. doi:10.1016/j.ins.2012.05.028. Marco Saerens, Patrice Latinne, and Christine Decaestecker. Adjusting the outputs of a classifier to new a pri- ori probabilities: A simple procedure. Neural Computation , 14(1):21–41, January
-
[2018]
Lei Qi, Mohammed Khaleel, Wallapak Tavanapong, Adisak Sukul, and David Peterson
doi:10.1145/3269206.3269287. Lei Qi, Mohammed Khaleel, Wallapak Tavanapong, Adisak Sukul, and David Peterson. A framework for deep quantification learning. In Machine Learning and Knowledge Discovery in Databases: European Conference, ECML PKDD 2020, Ghent, Belgium, September 14–18, 2020, Proceedings, Part I, pages 232–248. Springer,
-
[2020]
Alejandro Moreo, Andrea Esuli, and Fabrizio Sebastiani
doi:10.1007/s10791-019-09363-y. Alejandro Moreo, Andrea Esuli, and Fabrizio Sebastiani. QuaPy: a python-based framework for quantification. In Proceedings of the 30th ACM International Conference on Information & Knowledge Management, pages 4534–4543,
Show all 12 references
-
[2022]
Maximum likelihood with bias-corrected calibration is hard-to-beat at label shift adaptation
13 A PREPRINT - JANUARY 24, 2025 Amr Alexandari, Anshul Kundaje, and Avanti Shrikumar. Maximum likelihood with bias-corrected calibration is hard-to-beat at label shift adaptation. In International Conference on Machine Learning, pages 222–232. PMLR,
2025
-
[2023]
doi:10.1007/978-3-031-20467-8
ISBN 978-3-031-20466-1. doi:10.1007/978-3-031-20467-8. Tobias Schumacher, Markus Strohmaier, and Florian Lemmerich. A comparative evaluation of quantification methods. arXiv preprint arXiv:2103.03223,
-
[2024]
George Forman
doi:10.1007/s00521-024-10721-1. George Forman. Quantifying counts and costs via classification. Data Mining and Knowledge Discovery , 17(2): 164–206, October
-
[3203]
URL http://www.sciencedirect.com/science/article/pii/ S0031320311002901
doi:10.1016/j.patcog.2011.06.019. URL http://www.sciencedirect.com/science/article/pii/ S0031320311002901. Andrea Esuli, Alejandro Moreo, and Fabrizio Sebastiani. A recurrent neural network for sentiment quantifica- tion. In ACM International Conference on Information and Know...
2011 doi
Reviewed August 10, 2026 · model on record in the stance chip above.
Discussion (0). Continue with ORCID to comment.