REVIEW 2 major objections 5 minor 1 cited by
Do LLMs Have Visualization Literacy? An Evaluation on Modified Visualizations to Test Generalization in Data Interpretation
T0 review · 2 major / 5 minor · reviewed 2026-08-10 · deepseek-v4-flash
Pith's one-line read Both GPT-4 and Gemini fall short of the general public's visualization literacy, and they answer from prior knowledge rather than reading the charts.
desk verdict A solid contamination-controlled LLM evaluation whose real finding is that the models ignore the charts; the human-literacy comparison is the weak link and needs a same-test baseline. read the letter →
The pith
A machine-rendered reading of the paper's core claim, the machinery that carries it, and where it could break.
The reading
What carries the argument
The central instrument is a modified version of the 53-item VLAT in which every chart is regenerated with randomized data values, value labels are stripped from marks, and all correct answers are re-derived so they differ from the original test's answers. Around this, the paper builds a paired protocol: the same questions are asked with the chart present and with the chart absent, across 120 counterbalanced trials per item and model, so that any accuracy that persists without the chart can be attributed to the model's prior knowledge rather than to visual reading. A logistic-regression model with bootstrapped coefficients over the factors visualization type, task type, model, and visualization presence, plus a decontextualized follow-up experiment that anonymizes proper nouns, supplies the quantitative evidence that the charts themselves contribute little to the answers.
What would settle it
Give the same human participants both the original VLAT and this paper's modified version and show that the modified version is substantially harder for people; that would break the comparability assumption on which the 'below the general public' claim rests. Alternatively, run a newer multimodal model on the modified test and observe accuracy at or above the human baseline that drops sharply when the charts are removed.
Extended reading notes
Core claim
On the paper's own terms, the discovery is that visualization literacy, measured as the ability to read, understand, and interpret information from a chart, is not yet possessed by GPT-4 or Gemini at the level of the general public. Across 53 question stems and 12 chart types, the models beat the human VLAT accuracy on only 14 and 15 questions respectively, and they exceeded random guessing on only about half the items. The decisive evidence for knowledge substitution comes from the paired no-visualization condition: for the majority of chart/task combinations, showing the chart did not significantly change the models' accuracy, even though the charts contained randomized data whose correct answers could not be known in advance. Decontextualizing the charts—replacing real city, country, company, and party names with placeholders—raised GPT-4's accuracy from about 31 percent to 42 percent, which the paper reads as further confirmation that contextual labels trigger memorized answers instead of chart reading.
Load-bearing premise
The human accuracy scores from the original 2017 VLAT paper are treated as a valid baseline, even though the LLMs faced modified charts with randomized data, no value labels, and no 'omit' option; if those changes made the LLM version harder than the human version, the conclusion that LLMs lack literacy would be overstated.
Editorial extensions
If this is right
- Current GPT-4 and Gemini cannot yet replace human raters for visualization readability assessment; human validation remains necessary for evaluation studies.
- The paired with/without-visualization protocol offers a reusable, contamination-resistant template for benchmarking future LLM literacy.
- Anonymizing or decontextualizing chart labels can push LLMs toward genuine chart reading, at least for GPT-4, suggesting a practical prompt or interface design for chart question answering.
- LLM evaluation remains far cheaper and faster than crowdworker evaluation — roughly $0.53 versus $1.80 per 53-item run for GPT-4, and near zero for Gemini — so even imperfect models may be economical screening tools for flagging problematic visualizations.
- Model choice can be tuned per task: GPT-4 did comparatively well at trend-finding and hierarchical structure, while Gemini won several comparison and retrieval tasks, so practitioners can mix models rather than relying on one.
Reading between the lines
- Because the charts used randomized data, the near-zero accuracy of both models on several 'find extremum' and 'retrieve value' items suggests those tasks are currently under-served by multimodal LLMs; one could test whether chain-of-thought prompting or higher-resolution inputs close that gap.
- The knowledge-substitution failure likely extends to real-world chart QA benchmarks, so high scores on those benchmarks may overstate true visual reasoning; a direct comparison using the same protocol on such benchmarks would reveal how much is memorization.
- The paper's human baseline comes from the original VLAT, but no human data was collected on the modified test; recruiting a human sample on the modified charts would let the authors convert their qualitative comparison into a proper head-to-head literacy test.
- The decontextualization effect suggests a testable design rule: strip real-world labels before feeding charts to LLMs when the goal is to assess the chart itself—and the same trick might improve LLM performance in downstream applications like automated chart captioning or data extraction.
Signed reviews
Editorial analysis
A structured set of objections, weighed in public.
Referee Report
Summary. The manuscript proposes a template for assessing the visualization literacy of GPT-4 and Gemini by administering a modified 53-item VLAT in which charts are redrawn with randomized data, value labels are removed, the Omit option is suppressed, and answer choices are counterbalanced over 120 trials per question. The authors compare LLM accuracy to the original VLAT human accuracy (Table 2), analyze performance by visualization/task/model via bootstrap logistic regression (H1-H4), run follow-up experiments without answer choices and with decontextualized charts, and estimate cost/time differences between LLMs and human participants. The paper reports that the LLMs lack visualization literacy relative to the general public and that they rely on pre-existing knowledge rather than on the information in the visualizations.
Significance. The paper's methodological core is strong: 25,440 trials with counterbalanced option order, separate sessions per question, bootstrap logistic regression with hyperparameter tuning, and a decontextualization experiment are careful and reproducible, with code and data publicly released. The template of re-rendering VLAT charts with randomized data to avoid memorization is a useful contribution to LLM evaluation in visualization. The within-LLM comparisons (H1-H4) and the decontextualization results are interesting and informative. However, the headline human-comparison claim is not supported by the evidence as presented, because the modified test was never administered to human participants. If a same-instrument human baseline is added or the claims are reframed, the internal findings would still be valuable to the visualization community.
major comments (2)
- [Section 4.1.1, Table 2] The headline claim that both GPT-4 and Gemini 'lack visualization literacy compared to humans' (abstract and Section 4.3.1) is operationalized in Table 2 by comparing LLM accuracy on the modified VLAT to the original VLAT human accuracies from Lee et al. (2017). Section 4.1.1 changes the instrument in at least three consequential ways: all data values are randomized, value labels are removed, and the Omit option is replaced by a forced guess. These changes plausibly shift difficulty independently of visualization literacy: randomized values make semantic priors misleading, removing labels turns Retrieve Value tasks into axis interpolation, and removing Omit eliminates a safe response. The original human data were collected on the original instrument, with labels and Omit. No human participants took the modified instrument, so the size and direction of the difficulty shift are unknown. The paper assumes, but does not validate, item difficulty equivalence between the two instruments. This assumption is load-bearing for the strongest claim in the abstract and Section 4.3.1; the within-LLM comparisons for H1-H4 do not depend on it. The authors should either collect human data on the modified test (e.g., via crowdsourcing) or explicitly reframe the claim as 'LLMs perform poorly on a modified VLAT' rather than 'compared to humans, LLMs lack visualization literacy.'
- [Section 4.3.4 and Section 5.1.3] The claim that LLMs 'heavily relied on their pre-existing knowledge' is not established by the H4 analysis as written. H4 tests whether accuracy is higher with a visualization than without; Section 4.3.4 reports that the majority of visualization/task interactions were not significant. The text then concludes 'suggesting that LLMs mostly rely on their knowledge base.' This is a non-sequitur: failing to find a benefit of the visualization is consistent with several alternatives, including that the models attempt to use the visual information but fail to extract it, or that the visual information actively misleads them. The comparison is also confounded by model version: Experiment 2 uses gpt-4-turbo-preview and gemini-pro, while Experiment 1 uses gpt-4-vision-preview and gemini-pro-vision (Section 4.1.3). The more direct evidence for prior-knowledge reliance comes from Experiment 5, where decontextualization improved GPT-4's accuracy (Section 5.3.2), but those results are reported as descriptive comparisons without statistical tests, and the paper itself notes that the number of examples per task is too small for statistical conclusions. The abstract's causal claim should either be supported by a statistical test of the decontextualization effect or softened to say that LLMs appear to rely on context when available and perform poorly whether or not the visualization is present.
minor comments (5)
- [Section 4.3.1] The statement that 'GPT-4 performed better than random in 25 of the 53 questions' should be supported by a per-question binomial test or bootstrap confidence intervals, since 120 trials are available and the random baseline varies by the number of answer options.
- [Table 5] The entry 'Make Comperison' is a typo for 'Make Comparison.'
- [Section 6] The time comparison against the 25-second per-question limit in VLAT is not apples-to-apples because human participants answered all 53 questions in a single session, whereas LLMs were tested per question in separate sessions; the paper acknowledges this, but the cost table should include session overhead or explicitly state the limitation.
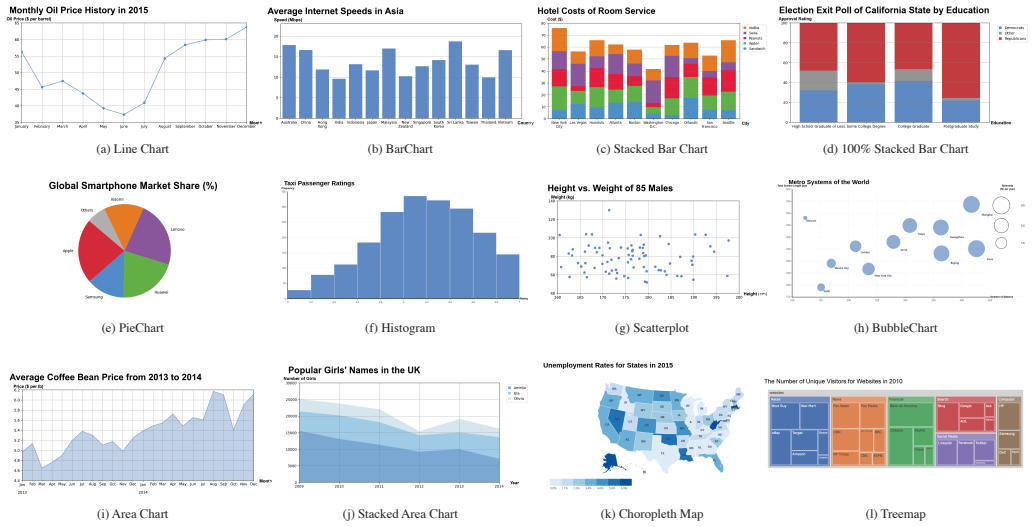
- [Figure 8] The subfigure labels skip (f), (g), and (k) because three charts were excluded; renumbering or adding placeholders would avoid confusion.
- [Section 5.3.1] The statement that providing answer choices 'guides' LLMs is a causal claim; the design compares different prompt conditions, so consider softening to 'is associated with more answerable responses.'
Circularity Check
No significant circularity: both central claims rest on external baselines or controlled contrasts rather than on self-referential definitions.
full rationale
I examined the derivation chain for the paper's two central claims: (1) GPT-4 and Gemini lack human-comparable visualization literacy, and (2) LLMs rely on pre-existing knowledge rather than information in the visualization. Claim (1) is an empirical comparison between LLM accuracy on a modified 53-item test and human accuracy on the original VLAT instrument reported by Lee et al. (2017). The human baseline is external data, not a quantity fitted from or defined by the LLM responses; the modified test is a deliberate perturbation (randomized values, removed value labels, removed Omit option) described in Sections 4.1.1 and 4.1.2, so the comparison is not true by construction. The concern that the modified items may also be harder for humans is a validity threat, not a circularity, and the paper itself acknowledges method sensitivity in its Limitations section ('we adopted a specific method to test their visualization literacy, and exploring other methods could be beneficial'). Claim (2) is supported by H4, a controlled contrast between identical questions with and without visualizations over 25,440 trials, analyzed with bootstrapped logistic-regression probability differences (Sections 4.2 and 4.3.4); the conclusion that LLMs rely on prior knowledge is an inference from the absence of a visualization benefit, not an assumption built into the outcome. I found no step where a prediction is equivalent to an input by definition, no fitted parameter renamed as a prediction, and no load-bearing self-citation: the cited prior work on VLAT and on GPT-4 VLAT performance is external and is used to motivate the modified design or to explain discrepancies. The paper's external-validity caveat around the human baseline should be weighed as correctness risk, but it does not constitute circular reasoning.
Assumptions & free parameters
assumptions (4)
- domain assumption VLAT is a valid and comprehensive measure of visualization literacy.
- ad hoc to paper The modified charts, questions, and answers are equivalent in difficulty to the original VLAT items.
- ad hoc to paper The answer to each modified question depends only on the visualization, not on real-world knowledge.
- domain assumption LLM API responses are stable enough that 120 repeated trials per question provide a meaningful estimate of performance.
Cite this review
Pith. "Pith review of Do LLMs Have Visualization Literacy? An Evaluation on Modified Visualizations to Test Generalization in Data Interpretation." pith.science (2026). https://pith.science/paper/U22EJ55H
@misc{pith2026250116277,
  author       = {Pith},
  title        = {Pith review of: Do LLMs Have Visualization Literacy? An Evaluation on Modified Visualizations to Test Generalization in Data Interpretation},
  year         = {2026},
  howpublished = {\url{https://pith.science/paper/U22EJ55H}},
  note         = {Machine review of arXiv:2501.16277}
}
read the original abstract
In this paper, we assess the visualization literacy of two prominent Large Language Models (LLMs): OpenAI's Generative Pretrained Transformers (GPT), the backend of ChatGPT, and Google's Gemini, previously known as Bard, to establish benchmarks for assessing their visualization capabilities. While LLMs have shown promise in generating chart descriptions, captions, and design suggestions, their potential for evaluating visualizations remains under-explored. Collecting data from humans for evaluations has been a bottleneck for visualization research in terms of both time and money, and if LLMs were able to serve, even in some limited role, as evaluators, they could be a significant resource. To investigate the feasibility of using LLMs in the visualization evaluation process, we explore the extent to which LLMs possess visualization literacy -- a crucial factor for their effective utility in the field. We conducted a series of experiments using a modified 53-item Visualization Literacy Assessment Test (VLAT) for GPT-4 and Gemini. Our findings indicate that the LLMs we explored currently fail to achieve the same levels of visualization literacy when compared to data from the general public reported in VLAT, and LLMs heavily relied on their pre-existing knowledge to answer questions instead of utilizing the information provided by the visualization when answering questions.
Figures


Figures from the paper (4 more)


Forward citations
Cited by 1 Pith paper
-
SciVisAgentBench: A Benchmark for Evaluating Scientific Data Analysis and Visualization Agents
SciVisAgentBench provides 108 expert-crafted tasks and a mixed LLM-plus-deterministic evaluation pipeline for benchmarking AI agents that perform scientific visualization workflows.
Reference graph
Works this paper leans on
-
[1]
M. Aubin Le Quéré, H. Schroeder, C. Randazzo, J. Gao, Z. Epstein, S. T. Perrault, D. Mimno, L. Barkhuus, and H. Li. LLMs as research tools: Applications and evaluations in HCI data work. In Extended Abstracts of the CHI Conference on Human Factors in Computing Systems, CHI EA ’24, 2024. doi: 10.1145/3613905.3636301 1
arXiv 2024
-
[2]
B. Bach, S. Huron, U. Hinrichs, J. C. Roberts, and S. Carpendale. Special issue on visualization teaching and literacy. IEEE Computer Graphics and Applications, 41(06):13–14, 2021. doi: 10.1109/MCG.2021.3117412 2
arXiv 2021
-
[3]
F. B. Baker. The basics of item response theory. ERIC, 2001. 2
work page 2001
-
[4]
A. Bendeck and J. Stasko. An Empirical Evaluation of the GPT-4 Multi- modal Language Model on Visualization Literacy Tasks. IEEE Transac- tions on Visualization and Computer Graphics, pp. 1–11, 2024. doi: 10. 1109/TVCG.2024.3456155 2, 10
arXiv 2024
-
[5]
K. Börner, A. Bueckle, and M. Ginda. Data visualization literacy: Defini- tions, conceptual frameworks, exercises, and assessments. In Proceedings of the National Academy of Sciences, vol. 116, pp. 1857–1864. National Acad Sciences, Feb. 2019. doi: 10.1073/pnas.180718011 2
- [6]
-
[7]
J. Boy, R. A. Rensink, E. Bertini, and J.-D. Fekete. A principled way of assessing visualization literacy. IEEE Transactions on Visualization and Computer Graphics, 20(12):1963–1972, Dec. 2014. doi: 10.1109/TVCG. 2014.2346984 2
arXiv 1963
-
[8]
Toward a More Comprehensive Understanding of Visualization Literacy
A.-F. Cabouat, T. He, F. Cabric, T. Isenberg, and P. Isenberg. Position pa- per: A case to study the relationship between data visualization readability and visualization literacy. In Proceedings of CHI Workshop “Toward a More Comprehensive Understanding of Visualization Literacy”, 2024. 1, 10
work page 2024
Show all 52 references
-
[9]
Chang, X
Y . Chang, X. Wang, J. Wang, Y . Wu, L. Yang, K. Zhu, H. Chen, X. Yi, C. Wang, Y . Wang, W. Ye, Y . Zhang, Y . Chang, P. S. Yu, Q. Yang, and X. Xie. A survey on evaluation of large language models. ACM Trans- actions on Intelligent Systems and Technology, Jan. 2024. doi: 10.11...
2024
- [10]
-
[11]
Z. Chen, C. Zhang, Q. Wang, J. Troidl, S. Warchol, J. Beyer, N. Gehlen- borg, and H. Pfister. Beyond generating code: Evaluating GPT on a data visualization course. In IEEE VIS Workshop on Visualization Edu- cation, Literacy, and Activities (EduVis), pp. 16–21, Oct. 2023. doi:...
2023
-
[12]
Chiang and H.-y
C.-H. Chiang and H.-y. Lee. Can large language models be an alternative to human evaluations? In A. Rogers, J. Boyd-Graber, and N. Okazaki, eds., Proceedings of the Annual Meeting of the Association for Computa- tional Linguistics, vol. 1, pp. 15607–15631. Association for Comp...
2023 doi
-
[13]
K. Choe, C. Lee, S. Lee, J. Song, A. Cho, N. W. Kim, and J. Seo. En- hancing Data Literacy On-demand: LLMs as Guides for Novices in Chart Interpretation. IEEE Transactions on Visualization and Computer Graph- ics, pp. 1–17, 2024. doi: 10.1109/TVCG.2024.3413195 10
2024
- [14]
-
[15]
Demszky, D
D. Demszky, D. Yang, D. S. Yeager, C. J. Bryan, M. Clapper, S. Chandhok, J. C. Eichstaedt, C. Hecht, J. Jamieson, M. Johnson, M. Jones, D. Krettek- Cobb, L. Lai, N. JonesMitchell, D. C. Ong, C. S. Dweck, J. J. Gross, and J. W. Pennebaker. Using large language models in psychol...
2023 doi
-
[16]
Di Bartolomeo, G
S. Di Bartolomeo, G. Severi, V . Schetinger, and C. Dunne. Ask and you shall receive (a graph drawing): Testing ChatGPT’s potential to apply graph layout algorithms. Proc. EuroVis Conference on Visualization, Jan
-
[17]
Y . Feng, X. Wang, K. K. Wong, S. Wang, Y . Lu, M. Zhu, B. Wang, and W. Chen. PromptMagician:interactive prompt engineering for text- to-image creation. IEEE Transactions on Visualization and Computer Graphics, 30(1):295–305, Jan. 2024. doi: 10.1109/TVCG.2023.3327168 2
2024
-
[18]
Hämäläinen, M
P. Hämäläinen, M. Tavast, and A. Kunnari. Evaluating large language models in generating synthetic HCI research data: A case study. In Proceedings of the CHI Conference on Human Factors in Computing Systems, pp. 1–19. ACM, Hamburg Germany, 2023. doi: 10.1145/3544548 .3580688 1, 2
2023 doi
-
[19]
D. A. Jackson, K. M. Somers, and H. H. Harvey. Similarity coefficients: measures of co-occurrence and association or simply measures of oc- currence? The American Naturalist , 133(3):436–453, 1989. doi: 10. 1086/284927 9, 15
1989
-
[20]
Kafle, B
K. Kafle, B. Price, S. Cohen, and C. Kanan. DVQA: Understanding data visualizations via question answering. In Proceedings of the IEEE Conference on Computer Vision and Pattern Recognition, pp. 5648–5656, Dec. 2018. doi: 10.1109/CVPR.2018.00592 2
2018
-
[21]
Kafle, R
K. Kafle, R. Shrestha, S. Cohen, B. Price, and C. Kanan. Answering questions about data visualizations using efficient bimodal fusion. In Proceedings of the IEEE/CVF Winter Conference on Applications of Com- puter Vision, pp. 1498–1507, May 2020. doi: 10.1109/W ACV45572.2020. ...
2020
-
[22]
S. E. Kahou, V . Michalski, A. Atkinson, Á. Kádár, A. Trischler, and Y . Bengio. FigureQA: An annotated figure dataset for visual reasoning. In Proceedings of the International Conference on Learning Representations, Feb. 2018. doi: arXiv.1710.07300 2
2018 arXiv
- [23]
-
[24]
Lee, S.-H
S. Lee, S.-H. Kim, and B. C. Kwon. VLAT: Development of a Visualiza- tion Literacy Assessment Test. IEEE Transactions on Visualization and Computer Graphics, 23(1):551–560, Jan. 2017. doi: 10.1109/TVCG.2016 .2598920 1, 2, 3, 6, 7, 10
2017 doi
-
[25]
Z. Li, H. Miao, V . Pascucci, and S. Liu. Visualization Literacy of Multi- modal Large Language Models: A Comparative Study, June 2024. 2
2024
- [26]
-
[27]
J. Liu, C. S. Xia, Y . Wang, and LINGMING. ZHANG. Is your code generated by ChatGPT really correct? Rigorous evaluation of large lan- guage models for code generation. In A. Oh, T. Neumann, A. Globerson, K. Saenko, M. Hardt, and S. Levine, eds., Advances in Neural Information ...
-
[28]
L. Y .-H. Lo and H. Qu. How Good (Or Bad) Are LLMs at Detecting Misleading Visualizations? IEEE Transactions on Visualization and Computer Graphics, pp. 1–10, 2024. doi: 10.1109/TVCG.2024.3456333 2
2024
-
[29]
Masry, D
A. Masry, D. X. Long, J. Q. Tan, S. Joty, and E. Hoque. ChartQA: A benchmark for question answering about charts with visual and logical reasoning. In Findings of the Association for Computational Linguistics, May 2022. doi: 10.18653/v1/2022.findings-acl.177 2
2022 doi
- [30]
-
[31]
Pandey and A
S. Pandey and A. Ottley. Mini-VLAT: A short and effective measure of visualization literacy. Computer Graphics Forum, 42(3):1–11, June 2023. doi: 10.1111/cgf.14809 1, 2, 7
2023 doi
- [32]
-
[33]
D. C. Montgomery, E. A. Peck, and G. G. Vining. Introduction to linear regression analysis. John Wiley & Sons, 2021. 4
2021
- [34]
-
[35]
M. M. Rahman and Y . Watanobe. ChatGPT for education and research: Opportunities, threats, and strategies. Applied Sciences, 13(9):5783, May
-
[36]
Pham-Gia, N
T. Pham-Gia, N. Turkkan, and P. Eng. Bayesian analysis of the difference of two proportions. Communications in Statistics-Theory and Methods, 22(6):1755–1771, 1993. doi: 10.1080/03610929308831114 5, 20, 21
1993 doi
-
[37]
E. H. Simpson. The interpretation of interaction in contingency ta- bles. Journal of the Royal Statistical Society: Series B (Methodological), 13(2):238–241, 1951. 5
1951
-
[38]
Strobelt, A
H. Strobelt, A. Webson, V . Sanh, B. Hoover, J. Beyer, H. Pfister, and A. M. Rush. Interactive and visual prompt engineering for ad-hoc task adaptation with large language models. IEEE Transactions on Visualization and Computer Graphics, pp. 1146–1156, Jan. 2023. doi: 10.1109/...
2023 doi
-
[39]
doi: 10.3390/app13095783 1, 2
-
[40]
C. Shi, W. Cui, C. Liu, C. Zheng, H. Zhang, Q. Luo, and X. Ma. NL2Color: Refining color palettes for charts with natural language.IEEE Transactions on Visualization and Computer Graphics, pp. 814–824, Jan. 2024. doi: 10. 1109/TVCG.2023.3326522 1
2024
- [41]
-
[42]
Vaithilingam, T
P. Vaithilingam, T. Zhang, and E. L. Glassman. Expectation vs. experi- ence: Evaluating the usability of code generation tools powered by large language models. In Extended Abstracts of the CHI Conference on Human Factors in Computing Systems, CHI EA ’22. Association for Compu...
2022
-
[43]
Y . Tian, W. Cui, D. Deng, X. Yi, Y . Yang, H. Zhang, and Y . Wu. ChartGPT: Leveraging LLMs to generate charts from abstract natural language. IEEE Transactions on Visualization and Computer Graphics, Feb. 2024. doi: 10. 1109/TVCG.2024.3368621 2
2024
-
[44]
R. J. Tibshirani and B. Efron. An introduction to the bootstrap. Mono- graphs on statistics and applied probability, 57(1):1–436, 1993. 4
1993
-
[45]
Vijaymeena and K
M. Vijaymeena and K. Kavitha. A survey on similarity measures in text mining. Machine Learning and Applications: An International Journal, 3(1):19–28, Mar. 2016. doi: 10.5121/mlaij.2016.3103 9, 16
2016
-
[46]
J. Wei, X. Wang, D. Schuurmans, M. Bosma, b. ichter, F. Xia, E. Chi, Q. V . Le, and D. Zhou. Chain-of-thought prompting elicits reasoning in large language models. In S. Koyejo, S. Mohamed, A. Agarwal, D. Belgrave, K. Cho, and A. Oh, eds., Advances in Neural Information Proces...
2025
-
[47]
Valmeekam, M
K. Valmeekam, M. Marquez, S. Sreedharan, and S. Kambhampati. On the planning abilities of large language models - a critical investigation. In A. Oh, T. Neumann, A. Globerson, K. Saenko, M. Hardt, and S. Levine, eds., Advances in Neural Information Processing Systems , vol. 36...
2023
-
[48]
P.-P. Vázquez. Are llms ready for visualization? In 2024 IEEE 17th Pacific Visualization Conference (PacificVis), pp. 343–352. IEEE, 2024. doi: 10.1109/PacificVis60374.2024.00049 2
2024
-
[51]
S. Xiao, S. Huang, Y . Lin, Y . Ye, and W. Zeng. Let the chart spark: Embedding semantic context into chart with text-to-image generative model. IEEE Transactions on Visualization and Computer Graphics , 30(1):284–294, Jan. 2024. doi: 10.1109/TVCG.2023.3326913 2
2024
-
[52]
Ziems, W
C. Ziems, W. Held, O. Shaikh, J. Chen, Z. Zhang, and D. Yang. Can Large Language Models Transform Computational Social Science? Com- putational Linguistics, pp. 1–55, Mar. 2024. doi: 10.1162/coli_a_00502 2 13 A R ESULTS OF LLM S’ V ISUALIZATION LITERACY A.1 Variables and Inter...
2024 doi
-
[2016]
doi: 10.1177/1473871615594652 2
- [2023]
Reviewed August 10, 2026 · model on record in the stance chip above.
Discussion (0). Continue with ORCID to comment.