REVIEW 5 major objections 5 minor 68 references
Enhancement of superconductivity on thin film of Sn under high pressure
T0 review · 5 major / 5 minor · reviewed 2026-08-10 · deepseek-v4-flash
Pith's one-line read A thin film of tin under non-hydrostatic pressure becomes superconducting near 6.3 K at 10.5 GPa, about 10% higher than the bulk γ-Sn transition temperature.
desk verdict A plausible, modest new data point on thin-film Sn under pressure; the Tc enhancement is real as a resistance feature, but not fully confirmed as bulk gamma-Sn superconductivity. read the letter →
The pith
A machine-rendered reading of the paper's core claim, the machinery that carries it, and where it could break.
The reading
What carries the argument
The central experimental arrangement is a diamond anvil cell with boron-doped diamond (BDD) electrodes, allowing four-terminal resistance measurements directly on a roughly 100-nm tin film deposited on the anvil, with no separate electrical contacts to fabricate. The pressure phase of interest is γ-Sn, the high-pressure allotropic form of tin that in bulk samples superconducts near 5.3 K. The proposed mechanism carrying the extra transition temperature is grain refinement: under non-hydrostatic pressure the film's grains shrink from about 300 nm to several tens of nanometers, and prior phonon measurements on nanostructured tin indicate that such refinement softens low-energy phonons and raises the electron-phonon coupling. The upper critical field is analyzed with the standard upper-critical-field model, which converts the measured field dependence of the transition into an estimated Hc2 of several tesla.
What would settle it
Measure AC magnetic susceptibility or heat capacity of the tin film inside the diamond anvil cell at 10.5 GPa: absence of a diamagnetic Meissner signal or a specific-heat jump near 6.3 K would show that the resistance drop is not bulk superconductivity. Alternatively, in-situ X-ray diffraction on the film at 10.5 GPa showing no γ-Sn phase would invalidate the phase assignment.
Extended reading notes
Core claim
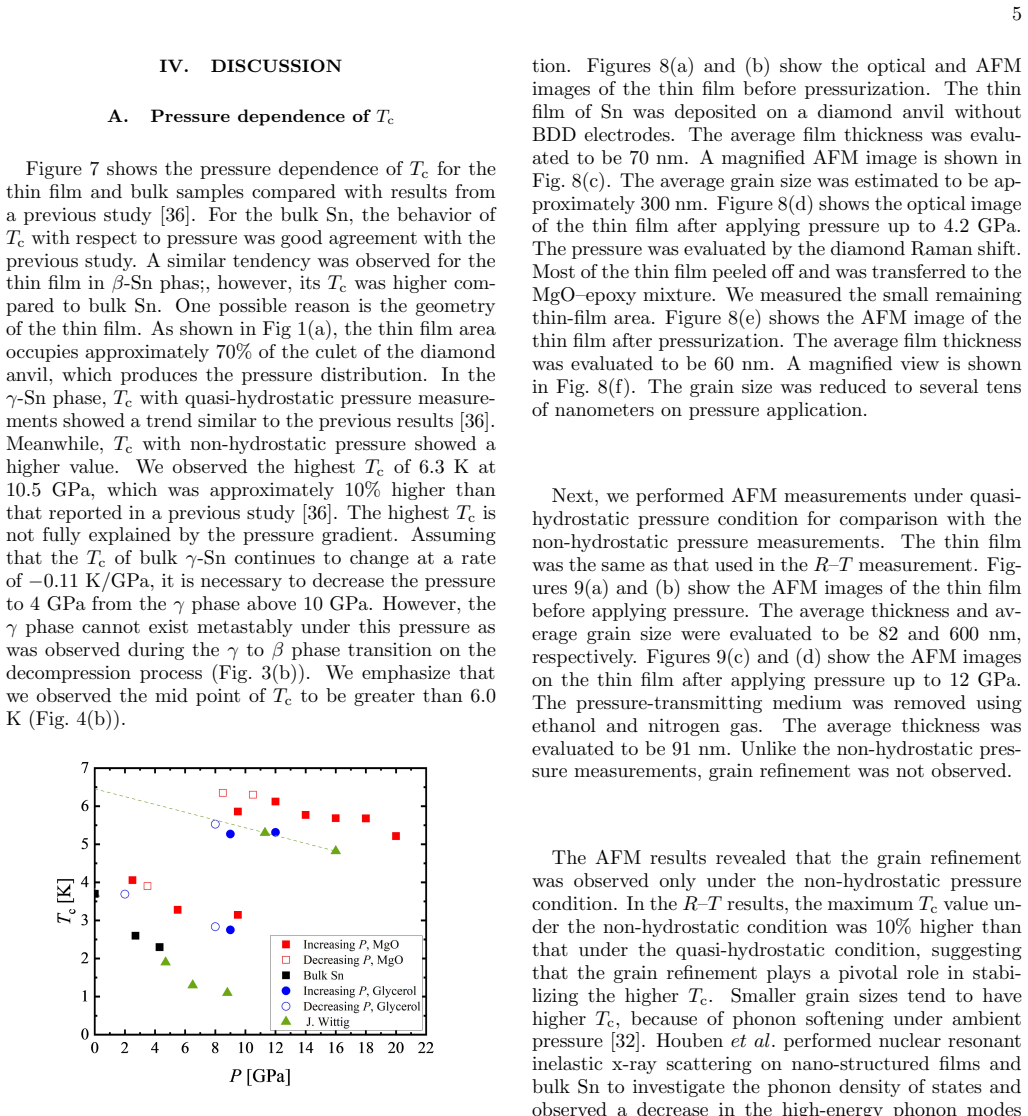
The central claim is that a tin thin film in the γ-Sn phase, reached by combining film growth with non-hydrostatic high pressure, superconducts below 6.3 K at about 10.5 GPa, with the midpoint of the transition above 6.0 K. This is approximately 10% higher than the 5.3 K measured for bulk γ-Sn in the earlier pressure study [36], and the resistance drop under magnetic field indicates an upper critical field reaching several tesla, an order-of-magnitude enhancement over the ambient-pressure film and bulk values. The authors also report a resistance anomaly around 11 K at 9.5 GPa whose onset shifts to lower temperature in a magnetic field, which they describe as a possible signature of a higher superconducting transition that requires magnetization, heat-capacity, or tunneling measurements to confirm. Atomic force microscopy comparison before and after pressurization shows grain refinement only under non-hydrostatic conditions, and the authors connect this refinement to the higher transition temperature through phonon softening and increased electron-phonon coupling in nanostructured tin.
Load-bearing premise
The load-bearing premise is that the resistance drop seen in the film near 6.3 K at 10.5 GPa is the superconducting transition of γ-Sn, since no magnetization or heat-capacity measurement was made on the film and the γ-phase assignment rests on pressure range and resistance behavior rather than in-situ structural data.
Editorial extensions
If this is right
- If the assignment is correct, thin-film processing becomes a viable route to raise the transition temperature in high-pressure phases of elemental superconductors, not only at ambient pressure.
- The γ-Sn film's 6.3 K transition at 10.5 GPa sets a new pressure-phase benchmark for tin superconductivity, about 10% above the bulk value.
- The enhanced upper critical field of several tesla implies a strongly reduced coherence length and likely a shorter electron mean free path under non-hydrostatic pressure, consistent with the observed increase in normal-state resistivity.
- Grain refinement under non-hydrostatic pressure is the paper's candidate explanation for the transition-temperature gain; if it holds, controlling grain size under pressure could become a general tool for engineering thin-film superconductors.
- The 11 K resistance anomaly at 9.5 GPa, if confirmed by magnetization or heat-capacity measurements, would point to a substantially higher transition temperature in part of the film or in a related phase.
Reading between the lines
- A direct extension the authors leave implicit: the same grain-refinement route could be tried on other elemental superconductors with high-pressure phases, such as bismuth or lead, to search for similar relative gains in transition temperature.
- The large upper critical field and high normal-state resistivity under non-hydrostatic pressure suggest a dirty-limit superconductor, so measuring the coherence length from the upper-critical-field slope would test whether the transition-temperature gain tracks disorder-induced shortening of the mean free path.
- Because non-hydrostatic pressure creates spatial pressure gradients, part of the observed 6.3 K signal could come from film regions at pressures somewhat different from the nominal 10.5 GPa, and a spatially resolved measurement would clarify how much of the gain is genuinely phase-specific rather than pressure-distribution related.
- The 11 K anomaly offers a concrete testable prediction: magnetization or heat-capacity measurements on the film under pressure should show a corresponding feature if the anomaly is a bulk superconducting transition rather than a fluctuation or granular effect.
Editorial analysis
A structured set of objections, weighed in public.
Referee Report
Summary. The paper reports electrical resistance measurements of evaporated Sn thin films in a diamond anvil cell with boron-doped diamond electrodes, under both non-hydrostatic and quasi-hydrostatic pressure conditions. The authors claim that in the gamma-Sn phase under non-hydrostatic pressure, the superconducting transition temperature reaches 6.3 K at 10.5 GPa, roughly 10% higher than the bulk value reported by Wittig, and that the upper critical magnetic field is drastically enhanced. They also report atomic force microscopy evidence of grain refinement under non-hydrostatic pressure, which they propose as the mechanism stabilizing the higher Tc. Bulk Sn magnetization measurements under pressure are included as a reference, but transport is the only probe used on the film under pressure.
Significance. If confirmed, the result would be a clear demonstration that combining thin-film geometry with pressure can raise Tc of an elemental superconductor beyond the bulk high-pressure phase value, with a plausible microstructure-based mechanism. The paper has several strengths: it compares bulk and thin-film behavior, includes a quasi-hydrostatic control experiment, uses an established BDD electrode technique, and provides a data availability statement. The main significance is therefore conditional on whether the 6.3 K feature is truly bulk superconductivity of a uniform gamma-Sn phase; the current evidence does not fully exclude alternative interpretations such as granular percolation, weak links, or a minority phase.
major comments (5)
- [Sec. III.C, Fig. 4(b)] The central claim of the paper—that the 6.3 K resistance drop at 10.5 GPa is a superconducting transition of uniform gamma-Sn—rests entirely on four-terminal resistance measurements. No magnetization or heat-capacity data are reported for the film under pressure; the only magnetic data (Fig. 2) are for bulk Sn. The paper itself cites fluctuation-induced resistance decreases in granular or amorphous films (Sec. IV.C, Refs. [59-62]) and attributes a resistance peak to 'granularity or disorder' in Sec. III.C. A percolating path through strained grains, a weak-link network, or a minority high-Tc region could produce the same resistance drop without a bulk transition of gamma-Sn. The ~10% Tc enhancement therefore is not uniquely established by the present data. A bulk-sensitive measurement on the film (e.g., ac susceptibility in the DAC) or a quantitative analysis ruling out fluctuation and weak-link contributions is needed.
- [Sec. II and Sec. IV.A] Pressure is not measured at the sample: under non-hydrostatic conditions the pressure is determined from ruby fluorescence and diamond Raman shift at room temperature, which gives a distribution across the culet rather than a single sample pressure. No error bars are given in Fig. 7, which is the basis for the comparison with Wittig's bulk data. The argument that a pressure gradient cannot explain the 6.3 K value assumes the bulk Tc(P) slope and phase stability; under non-hydrostatic loading, local regions of the film could be at different pressures or contain different phase mixtures, and the additional effects of strain and grain refinement are not quantitatively separated. The paper should provide pressure-uncertainty estimates and a more explicit treatment of how the pressure distribution affects the claimed 10% enhancement.
- [Sec. III.C and Fig. 7] The gamma-Sn phase is inferred from the pressure range and the resistance behavior, not from in-situ structural data such as X-ray diffraction. Under non-hydrostatic pressure, the film could contain a mixture of beta-Sn, gamma-Sn, or other high-pressure phases, and the resistance drop near 6.3 K could arise from only part of the film. The phase assignment is load-bearing because the claim is specifically about the gamma-Sn phase; without phase identification, the comparison to Wittig's bulk gamma-Sn result is not fully grounded. In-situ XRD on the film under pressure, or at least a more detailed resistance-based phase analysis, would strengthen this point.
- [Sec. IV.B, Fig. 8] The AFM grain-refinement evidence is not directly tied to the transport samples. The film shown in Fig. 8 was deposited on a diamond anvil without BDD electrodes, and after pressurization most of the film peeled off and was transferred to the MgO-epoxy mixture; AFM was performed only on a small remaining area. It is therefore not established that the film used for the 6.3 K resistance measurement had the same grain refinement. In addition, the quasi-hydrostatic AFM control (Fig. 9) shows no grain refinement but also was not measured on the exact transport film. The causal statement that grain refinement contributes to stabilizing the higher Tc of gamma-Sn is plausible but currently supported only by indirect correlation.
- [Sec. III.C, Fig. 4(c)] The upper critical magnetic field values are derived from resistance onsets fitted with the WHH model. If the zero-field resistance drop is not a bulk superconducting transition of a single phase, these Hc2 values are not reliable as intrinsic properties. Moreover, no comparison is made with Hc2 of bulk gamma-Sn under pressure, so the 'drastic enhancement' lacks a baseline. The authors should either provide a bulk comparison or temper the claim about Hc2 enhancement until a bulk-sensitive confirmation is available.
minor comments (5)
- [Abstract and Sec. I] There is a typo 'comapred' in the Introduction; the abstract also contains awkward phrasing such as 'pressure effects of a superconductivity' that should be corrected.
- [Sec. IV.A] In the sentence 'A similar tendency was observed for the thin film in β-Sn phas;' the 'phas;' should be 'phase'.
- [Sec. II and Sec. III.D] The phrase 'RRR was with in 2–3' should be 'within 2–3', and the description of pressure-transmitting media ('solid, liquid, and gaseous states') could be clarified to specify which media were actually used in each run.
- [Sec. IV.C, Fig. 10] The 11 K anomaly is described in the text as 'suggesting the signature of the superconducting transition,' but the paper also acknowledges fluctuation effects in granular films; the figure caption and text should present this anomaly more cautiously, for example as an unexplained resistance anomaly, unless further evidence is provided.
- [Figs. 3 and 7] No error bars or uncertainty estimates are shown for the pressure values; adding estimates based on ruby fluorescence and diamond Raman linewidths or spatial pressure distribution would improve the quantitative claims.
Circularity Check
No significant circularity: the Tc enhancement claim is an experimental observation benchmarked against Wittig's bulk data, and no fitted parameter or self-citation is disguised as a prediction.
full rationale
The paper reports a resistance-derived Tc of 6.3 K in gamma-Sn thin film at 10.5 GPa, compared with Wittig's 5.3 K bulk value; this is a direct measurement, not a derived quantity. The WHH analysis extracts Hc2 from the measured R(T,H) curves and is standard data analysis rather than a prediction forced by an input. The self-citations [37-39,43,44] concern the BDD electrode DAC technique; they establish the measurement method and are not used to justify the value of Tc or the gamma-phase identification. No equation defines the claim in terms of itself, no fitted parameter is renamed as a prediction, and no uniqueness theorem is imported from the authors' prior work. The paper even flags the alternative fluctuation/granularity explanation (Sec. IV.C) and asks for magnetic/calorimetric confirmation, which is the opposite of circular reasoning. Any concern about phase identification or non-hydrostatic pressure gradients is a correctness/interpretation risk, not a circularity.
Assumptions & free parameters
assumptions (4)
- domain assumption Ruby fluorescence and diamond Raman shift provide accurate pressure at the sample location.
- domain assumption A resistance drop in the thin film at zero field indicates a superconducting transition of the film.
- domain assumption The gamma-Sn phase is present in the film at the stated pressures based on the pressure range and transport behavior.
- domain assumption The WHH model is applicable to this thin film superconductor for Hc2 estimates.
Cite this review
Pith. "Pith review of Enhancement of superconductivity on thin film of Sn under high pressure." pith.science (2026). https://pith.science/paper/UWM5K5CJ
@misc{pith2026250117451,
  author       = {Pith},
  title        = {Pith review of: Enhancement of superconductivity on thin film of Sn under high pressure},
  year         = {2026},
  howpublished = {\url{https://pith.science/paper/UWM5K5CJ}},
  note         = {Machine review of arXiv:2501.17451}
}
abstract
We investigated the pressure effects of a superconductivity on thin films of Sn. Elemental superconductor Sn with a body-centered tetragonal structure, $\beta$-Sn, exhibits superconductivity below the superconducting transition temperature ($T_{\rm c}=3.72$ K) at ambient pressure. $T_{\rm c}$ of Sn increases with lowering dimension such as in thin film and nanowire growth, or by high-pressure application. For thin films, $T_{\rm c}$ exhibits a slight increase up to approximately 4 K compared to the bulk value, attributable to the crystalline size and lattice disorder. By applying pressure on a bulk Sn, $T_{\rm c}$ initially decreases from 3.72 K as the pressure increases. Further increasing pressure up to 10 GPa, $T_{\rm c}$ increases to 5.3 K with the structural transformation. However, the combination of these effects on thin films of Sn, namely, thin-film growth and pressure effects, remains underexplored. In this study, we combined film-growth and pressure-application techniques to further increase $T_{\rm c}$ using a diamond anvil cell with boron-doped diamond electrodes. The drop of the electrical resistance suggesting the onset of $T_{\rm c}$ on the thin film reached above 6 K in $\gamma$-Sn phase. Further, the upper critical magnetic field was drastically enhanced. Atomic force microscopy suggests that the refinement of the grain size of the thin film under the non-hydrostatic pressure conditions contributes to stabilizing the higher $T_{\rm c}$ of $\gamma$-Sn.
Figures


Figures from the paper (7 more)




Reference graph
Works this paper leans on
- [1]
- [2]
-
[3]
K. Shimizu, K. Suhara, M. Ikumo, M. I. Eremets, and K. Amaya, Nature 393, 767 (1998)
work page 1998
- [4]
-
[5]
A. P. Drozdov, M. I. Eremets, I. A. Troyan, V. Kseno- fontov, and S. I. Shylin, Nature 525, 73 (2015)
work page 2015
-
[6]
A. P. Drozdov, P. P. Kong, V. S. Minkov, S. P. Besedin, M. A. Kuzovnikov, S. Mozaffari, L. Balicas, F. F. Bal- akirev, D. E. Graf, V. B. Prakapenka, E. Greenberg, D. A. Knyazev, M. Tkacz, and M. I. Eremets, Nature 569, 528 (2019)
work page 2019
-
[7]
M. Somayazulu, M. Ahart, A. K. Mishra, Z. M. Geballe, M. Baldini, Y. Meng, V. V. Struzhkin, and R. J. Hemley, Phys. Rev. Lett. 122, 027001 (2019)
work page 2019
-
[8]
R. Matsumoto, M. Einaga, S. Adachi, S. Yamamoto, T. Irifune, K. Terashima, H. Takeya, Y. Nakamoto, K. Shimizu, and Y. Takano, Supercond. Sci. Technol. 33, 124005 (2020)
work page 2020
Show all 68 references
-
[9]
D. V. Semenok, A. G. Kvashnin, A. G. Ivanova, V. Svit- lyk, V. Y. Fominski, A. V. Sadakov, O. A. Sobolevskiy, V. M. Pudalov, I. A. Troyan, and A. R. Oganov, Mate- rials Today 33, 36 (2020)
2020
-
[10]
W. Chen, D. V. Semenok, X. Huang, H. Shu, X. Li, D. Duan, T. Cui, and A. R. Oganov, Phys. Rev. Lett. 127, 117001 (2021)
2021
-
[11]
Tc slightly increased compared to the bulk value and was similar to values from the previous studies on thin films [27, 28]
At H = 0, an R drop suggesting the onset of the superconducting transition was observed at 3.75 K. Tc slightly increased compared to the bulk value and was similar to values from the previous studies on thin films [27, 28]. By applying H, the onset of Tc decreased with increas...
-
[12]
P. Kong, V. S. Minkov, M. A. Kuzovnikov, A. P. Droz- dov, S. P. Besedin, S. Mozaffari, L. Balicas, F. F. Bal- akirev, V. B. Prakapenka, S. Chariton, D. A. Knyazev, E. Greenberg, and M. I. Eremets, Nat Commun 12, 5075 (2021)
2021
-
[13]
I. A. Troyan, D. V. Semenok, A. G. Kvashnin, A. V. Sadakov, O. A. Sobolevskiy, V. M. Pudalov, A. G. Ivanova, V. B. Prakapenka, E. Greenberg, A. G. Gavril- iuk, I. S. Lyubutin, V. V. Struzhkin, A. Bergara, I. Er- rea, R. Bianco, M. Calandra, F. Mauri, L. Monacelli, R. Akashi, a...
2021
-
[14]
Z. Li, X. He, C. Zhang, X. Wang, S. Zhang, Y. Jia, S. Feng, K. Lu, J. Zhao, J. Zhang, B. Min, Y. Long, R. Yu, L. Wang, M. Ye, Z. Zhang, V. Prakapenka, S. Chariton, P. A. Ginsberg, J. Bass, S. Yuan, H. Liu, and C. Jin, Nat Commun 13, 2863 (2022)
2022
-
[15]
L. Ma, K. Wang, Y. Xie, X. Yang, Y. Wang, M. Zhou, H. Liu, X. Yu, Y. Zhao, H. Wang, G. Liu, and Y. Ma, Phys. Rev. Lett. 128, 167001 (2022)
2022
-
[16]
Y. Song, J. Bi, Y. Nakamoto, K. Shimizu, H. Liu, B. Zou, G. Liu, H. Wang, and Y. Ma, Phys. Rev. Lett. 130, 266001 (2023)
2023
-
[17]
Cross, J
S. Cross, J. Buhot, A. Brooks, W. Thomas, A. Kleppe, O. Lord, and S. Friedemann, Phys. Rev. B 109, L020503 (2024)
2024
-
[18]
H. Sun, M. Huo, X. Hu, J. Li, Z. Liu, Y. Han, L. Tang, Z. Mao, P. Yang, B. Wang, J. Cheng, D.-X. Yao, G.-M. Zhang, and M. Wang, Nature 621, 493 (2023)
2023
-
[19]
Sakakibara, M
H. Sakakibara, M. Ochi, H. Nagata, Y. Ueki, H. Saku- rai, R. Matsumoto, K. Terashima, K. Hirose, H. Ohta, M. Kato, Y. Takano, and K. Kuroki, Phys. Rev. B 109, 144511 (2024)
2024
-
[20]
X. Liu, P. Jiang, Y. Wang, M. Li, N. Li, Q. Zhang, Y. Wang, Y.-L. Li, and W. Yang, Phys. Rev. B 105, 224511 (2022)
2022
-
[21]
Zhang, X
C. Zhang, X. He, C. Liu, Z. Li, K. Lu, S. Zhang, S. Feng, X. Wang, Y. Peng, Y. Long, R. Yu, L. Wang, V. Prakapenka, S. Chariton, Q. Li, H. Liu, C. Chen, and C. Jin, Nat Commun 13, 5411 (2022)
2022
-
[22]
J. Ying, S. Liu, Q. Lu, X. Wen, Z. Gui, Y. Zhang, X. Wang, J. Sun, and X. Chen, Phys. Rev. Lett. 130, 256002 (2023)
2023
-
[23]
Buckel and R
W. Buckel and R. Hilsch, Z. Physik 138, 109 (1954)
1954
-
[24]
Abeles, R
B. Abeles, R. W. Cohen, and G. W. Cullen, Phys. Rev. Lett. 17, 632 (1966)
1966
-
[25]
J. W. Garland, K. H. Bennemann, and F. M. Mueller, Phys. Rev. Lett. 21, 1315 (1968)
1968
-
[26]
Strongin, O
M. Strongin, O. F. Kammerer, J. E. Crow, R. D. Parks, D. H. Douglass, and M. A. Jensen, Phys. Rev. Lett. 21, 1320 (1968)
1968
-
[27]
M. Tian, J. Wang, J. S. Kurtz, Y. Liu, M. H. W. Chan, T. S. Mayer, and T. E. Mallouk, Phys. Rev. B71, 104521 (2005)
2005
-
[28]
M. H. Beutel, N. G. Ebensperger, M. Thiemann, G. Un- tereiner, V. Fritz, M. Javaheri, J. N¨ agele, R. R¨ osslhuber, M. Dressel, and M. Scheffler, Supercond. Sci. Technol. 29, 085011 (2016)
2016
-
[29]
W. Bang, T. D. Morrison, K. D. D. Rathnayaka, I. F. Lyuksyutov, D. G. Naugle, and W. Teizer, Thin Solid Films 676, 138 (2019)
2019
-
[30]
D. P. Lozano, S. Couet, C. Petermann, G. Hamoir, J. K. Jochum, T. Picot, E. Men´ endez, K. Houben, V. Joly, V. A. Antohe, M. Y. Hu, B. M. Leu, A. Alatas, A. H. Said, S. Roelants, B. Partoens, M. V. Miloˇ sevi´ c, F. M. Peeters, L. Piraux, J. Van de Vondel, A. Vantomme, K. Tems...
2019
-
[31]
Knorr and N
K. Knorr and N. Barth, Solid State Communications 8, 1085 (1970)
1970
-
[32]
Houben, S
K. Houben, S. Couet, M. Trekels, E. Men´ endez, T. Peissker, J. W. Seo, M. Y. Hu, J. Y. Zhao, E. E. Alp, S. Roelants, B. Partoens, M. V. Miloˇ sevi´ c, F. M. Peeters, D. Bessas, S. A. Brown, A. Vantomme, K. Temst, and M. J. Van Bael, Phys. Rev. B 95, 155413 (2017). 8
2017
-
[33]
Houben, J
K. Houben, J. K. Jochum, S. Couet, E. Men´ endez, T. Pi- cot, M. Y. Hu, J. Y. Zhao, E. E. Alp, A. Vantomme, K. Temst, and M. J. Van Bael, Sci Rep 10, 5729 (2020)
2020
-
[34]
J. D. Barnett, V. E. Bean, and H. T. Hall, Journal of Applied Physics 37, 875 (2004)
2004
-
[35]
Salamat, R
A. Salamat, R. Briggs, P. Bouvier, S. Petitgirard, A. De- waele, M. E. Cutler, F. Cor` a, D. Daisenberger, G. Gar- barino, and P. F. McMillan, Phys. Rev. B 88, 104104 (2013)
2013
-
[36]
Deffrennes, P
G. Deffrennes, P. Faure, F. Bottin, J.-M. Joubert, and B. Oudot, Journal of Alloys and Compounds919, 165675 (2022)
2022
-
[37]
Wittig, Z
J. Wittig, Z. Physik 195, 228 (1966)
1966
-
[38]
Matsumoto, Y
R. Matsumoto, Y. Sasama, M. Fujioka, T. Irifune, M. Tanaka, T. Yamaguchi, H. Takeya, and Y. Takano, Review of Scientific Instruments 87, 076103 (2016)
2016
-
[39]
Matsumoto, T
R. Matsumoto, T. Irifune, M. Tanaka, H. Takeya, and Y. Takano, Jpn. J. Appl. Phys. 56, 05FC01 (2017)
2017
-
[40]
Matsumoto, A
R. Matsumoto, A. Yamashita, H. Hara, T. Irifune, S. Adachi, H. Takeya, and Y. Takano, Appl. Phys. Ex- press 11, 053101 (2018)
2018
-
[41]
H. K. Mao, P. M. Bell, J. W. Shaner, and D. J. Steinberg, Journal of Applied Physics 49, 3276 (1978)
1978
-
[42]
Akahama and H
Y. Akahama and H. Kawamura, Journal of Applied Physics 96, 3748 (2004)
2004
-
[43]
Takano, M
Y. Takano, M. Nagao, I. Sakaguchi, M. Tachiki, T. Hatano, K. Kobayashi, H. Umezawa, and H. Kawarada, Applied Physics Letters 85, 2851 (2004)
2004
-
[44]
Adachi, R
S. Adachi, R. Matsumoto, S. Yamamoto, T. D. Ya- mamoto, K. Terashima, Y. Saito, M. Esparza Echevarria, P. Baptista de Castro, P. Song, S. Iwasaki, H. Takeya, and Y. Takano, Applied Physics Letters 116, 223506 (2020)
2020
-
[45]
Matsumoto, S
R. Matsumoto, S. Nakano, S. Yamamoto, and Y. Takano, Jpn. J. Appl. Phys. 60, 090902 (2021)
2021
-
[46]
M. Mito, M. Hitaka, T. Kawae, K. Takeda, T. Kitai, and N. Toyoshima, Jpn. J. Appl. Phys. 40, 6641 (2001)
2001
-
[47]
M. Mito, T. Imakyurei, H. Deguchi, K. Matsumoto, H. Hara, T. Ozaki, H. Takeya, and Y. Takano, J. Phys. Soc. Jpn. 83, 023705 (2014)
2014
-
[48]
M. Mito, H. Goto, H. Matsui, H. Deguchi, K. Matsumoto, H. Hara, T. Ozaki, H. Takeya, and Y. Takano, J. Phys. Soc. Jpn. 85, 024711 (2016)
2016
-
[49]
M. Mito, K. Ogata, H. Goto, K. Tsuruta, K. Nakamura, H. Deguchi, T. Horide, K. Matsumoto, T. Tajiri, H. Hara, T. Ozaki, H. Takeya, and Y. Takano, Phys. Rev. B 95, 064503 (2017)
2017
-
[50]
Abdel-Hafiez, Y
M. Abdel-Hafiez, Y. Zhao, Z. Huang, C.-w. Cho, C. H. Wong, A. Hassen, M. Ohkuma, Y.-W. Fang, B.-J. Pan, Z.-A. Ren, A. Sadakov, A. Usoltsev, V. Pudalov, M. Mito, R. Lortz, C. Krellner, and W. Yang, Phys. Rev. B 97, 134508 (2018)
2018
-
[51]
M. Mito, Y. Kitamura, T. Tajiri, K. Nakamura, R. Shiraishi, K. Ogata, H. Deguchi, T. Yamaguchi, N. Takeshita, T. Nishizaki, K. Edalati, and Z. Horita, Journal of Applied Physics 125, 125901 (2019)
2019
-
[52]
Irifune, A
T. Irifune, A. Kurio, S. Sakamoto, T. Inoue, and H. Sumiya, Nature 421, 599 (2003)
2003
-
[53]
G. J. Dolan and J. Silcox, Phys. Rev. Lett. 30, 603 (1973)
1973
-
[54]
Ohkuma, R
M. Ohkuma, R. Matsumoto, and Y. Takano, Appl. Phys. Express 16, 043004 (2023)
2023
-
[55]
Helfand and N
E. Helfand and N. R. Werthamer, Phys. Rev. 147, 288 (1966)
1966
-
[56]
N. R. Werthamer, E. Helfand, and P. C. Hohenberg, Phys. Rev. 147, 295 (1966)
1966
-
[57]
Baumgartner, M
T. Baumgartner, M. Eisterer, H. W. Weber, R. Fl¨ ukiger, C. Scheuerlein, and L. Bottura, Supercond. Sci. Technol. 27, 015005 (2014)
2014
-
[58]
Zhang, C
Y. Zhang, C. H. Wong, J. Shen, S. T. Sze, B. Zhang, H. Zhang, Y. Dong, H. Xu, Z. Yan, Y. Li, X. Hu, and R. Lortz, Sci Rep 6, 32963 (2016)
2016
-
[59]
Z. Shao, Z. Zhang, H. Yuan, H. Sun, Y. Cao, X. Zhang, S. Li, H. Gedeon, T. Xiang, Q.-K. Xue, and M. Pan, Science Bulletin 63, 1332 (2018)
2018
-
[60]
R. E. Glover, Physics Letters A 25, 542 (1967)
1967
-
[61]
L. G. Aslamasov and A. I. Larkin, Physics Letters A 26, 238 (1968)
1968
-
[62]
W. J. Skocpol and M. Tinkham, Rep. Prog. Phys. 38, 1049 (1975)
1975
-
[63]
S´ o˜ nora, C
D. S´ o˜ nora, C. Carballeira, J. J. Ponte, F. Vidal, T. Grenet, and J. Mosqueira, Phys. Rev. B 100, 104509 (2019)
2019
-
[64]
Hsieh, P
S. Hsieh, P. Bhattacharyya, C. Zu, T. Mittiga, T. J. Smart, F. Machado, B. Kobrin, T. O. H¨ ohn, N. Z. Rui, M. Kamrani, S. Chatterjee, S. Choi, M. Zaletel, V. V. Struzhkin, J. E. Moore, V. I. Levitas, R. Jeanloz, and N. Y. Yao, Science 366, 1349 (2019)
2019
-
[65]
Lesik, T
M. Lesik, T. Plisson, L. Toraille, J. Renaud, F. Occelli, M. Schmidt, O. Salord, A. Delobbe, T. Debuisschert, L. Rondin, P. Loubeyre, and J.-F. Roch, Science 366, 1359 (2019)
2019
-
[66]
Umeo, Review of Scientific Instruments 87, 063901 (2016)
K. Umeo, Review of Scientific Instruments 87, 063901 (2016)
2016
-
[67]
Z.-Y. Cao, H. Jang, S. Choi, J. Kim, S. Kim, J.-B. Zhang, A. S. Sharbirin, J. Kim, and T. Park, NPG Asia Mater 15, 1 (2023)
2023
-
[68]
Sasaki, M
M. Sasaki, M. Ohkuma, R. Matsumoto, T. Shinmei, T. Irifune, Y. Takano, and K. Shimizu, (2025), https://zenodo.org/records/14759622
2025
Reviewed August 10, 2026 · model on record in the stance chip above.
Discussion (0). Continue with ORCID to comment.