REVIEW 3 major objections 5 minor 3 cited by
Causal-Copilot: An Autonomous Causal Analysis Agent
T0 review · 3 major / 5 minor · reviewed 2026-08-16 · deepseek-v4-flash
Pith's one-line read An LLM-orchestrated pipeline that picks and tunes causal analysis algorithms outperforms single-method baselines, the paper claims.
desk verdict A real LLM-driven causal-analysis pipeline with a valuable benchmark, but the reported gains are not isolated from postprocessing, so the central selection claim is unsupported as written. read the letter →
The pith
A machine-rendered reading of the paper's core claim, the machinery that carries it, and where it could break.
The reading
What carries the argument
The load-bearing machinery is the algorithm-selection loop supported by a causality-specific knowledge memory: rules and tagged performance ratings narrow the candidate algorithm set, the LLM ranks and configures the survivors using statistical diagnostics and empirical benchmarks, and execution errors loop back for revision. A second mechanism is the postprocessing module, where bootstrap resampling produces per-edge confidence estimates, high-confidence missing edges are added and weak edges removed, and moderate-confidence edges are sent to the LLM for conceptual plausibility review, with LLM suggestions treated as soft and barred from overriding high-confidence statistical decisions. Together these mechanisms let the system adapt its choice of method to the data at hand and then anchor the final graph statistically.
What would settle it
Run the full benchmark with the postprocessing module disabled, keeping only preprocessing and LLM-based algorithm selection, and compare F1 against the reported numbers; if scores fall to roughly the level of the raw baseline algorithms or fail to beat the GPT-4o baseline, the selection strategy is not the cause of the advantage.
Extended reading notes
Core claim
On the paper's own terms, the discovery is that a fully automated, LLM-orchestrated workflow can make causal analysis accessible and accurate: the system chooses among more than twenty causal discovery and inference methods, configures their hyperparameters using dataset statistics and a causality-specific knowledge base, executes the methods, and then refines the output graph using bootstrap edge-confidence estimates and plausibility checks. Across the synthetic benchmarks reported, the full pipeline maintains high F1 performance across graph density, node count, sample size, noise type, missing-data rate, measurement error, and heterogeneous domains, while completing tasks at up to 1000 nodes that individual baseline algorithms fail to finish within the time limit. The result is a claim about the whole agent, not about any single module, because the evaluated comparison runs the full pipeline, including its postprocessing, against raw baseline algorithms.
Load-bearing premise
The evaluation assumes the F1 advantage comes from the algorithm-selection strategy, but the baseline algorithms run without the system's bootstrap-based edge refinement, and the paper never tests the selection step on its own; if that refinement alone produces the gain, the central claim is not supported.
Editorial extensions
If this is right
- Non-specialists could run credible causal discovery and effect estimation by describing their question in natural language, with algorithm choice and hyperparameters set automatically.
- Large, dense, missing, or heterogeneous datasets become tractable where a single method times out or collapses, up to roughly 1000 variables in the reported settings.
- The benchmarking results themselves form an empirical map of which causal discovery algorithms work under which data conditions, which could be reused beyond the agent.
- LLM-based graph refinement can be bounded as a soft postprocessing step, preserving high-confidence statistical decisions while adding domain plausibility.
Reading between the lines
- A direct subtraction test, applying the same postprocessing to the baseline algorithms, would reveal whether the agent's selection strategy or its refinement module produces the reported gains; this is the crucial experiment the paper does not run.
- Because the evaluation is entirely on synthetic data with known ground truth, real observational deployment would need a different validation route, such as resampling consistency or agreement with domain knowledge.
- The benchmarking data could be treated as a reusable empirical performance map from data-characteristic vectors to algorithm rankings, independent of the LLM agent.
- The LLM refinement step introduces a risk of plausible-sounding but false edges; the paper's restriction of LLM changes to moderate-confidence edges is a testable guardrail whose effect on downstream causal estimates could be measured.
Signed reviews
Editorial analysis
A structured set of objections, weighed in public.
Referee Report
Summary. The paper introduces Causal-Copilot, an LLM-orchestrated agent that automates the full causal analysis pipeline: preprocessing, algorithm selection, hyperparameter configuration, execution, postprocessing (bootstrap edge confidence and LLM-guided graph refinement), and report generation. The system integrates over twenty causal discovery and inference algorithms. The paper reports two main experimental contributions: a large preliminary benchmarking of causal discovery algorithms (Section 5.1) that is used to build a knowledge base for algorithm selection, and a comparative evaluation of Causal-Copilot against PC, FCI, GES, DirectLiNGAM, and a GPT-4o baseline on synthetic tabular and time-series data with known ground truth (Section 5.2). The central claim is that Causal-Copilot achieves superior F1 performance thanks to its automated algorithm and hyperparameter selection strategy.
Significance. If validated, the system would be a practically valuable tool for non-experts, and the paper's integrated benchmarking effort is a useful resource for the causal discovery community. The paper ships code, data, and a live demo, and reports results with error bars on synthetic data with known ground truth. However, the current evaluation does not isolate the contribution of the algorithm-selection strategy from the postprocessing module, and the test scenarios overlap heavily with the benchmarking distribution used to build the knowledge base. The central attribution claim is therefore not yet supported, although the system as a whole may still be effective. The paper's claims need to be substantially qualified or defended with additional controlled experiments.
major comments (3)
- [Section 5.2 vs Section 2.4] The Causal-Copilot results in Tables 2 and 3 include the full postprocessing module from Section 2.4 (bootstrap edge confidence and LLM-guided graph refinement), whereas the baselines (PC, FCI, GES, DirectLiNGAM, and GPT-4o) are evaluated without any postprocessing. The text in Section 5.2 attributes the F1 advantage to the 'algorithm and hyperparameter selection strategy.' The paper reports no ablation that disables postprocessing for Causal-Copilot, nor any control that applies the same postprocessing to the baselines. Since the postprocessing module can add and delete edges, the observed gains in dense, heterogeneous, missing-data, and compound scenarios could arise entirely from postprocessing rather than from selecting a better algorithm. This missing ablation leaves the central mechanism unidentified and unsupported.
- [Appendix C.1, C.2, C.3, C.4 and Section 5.1/5.2] The algorithm-selection knowledge base is constructed from the Section 5.1 benchmarking, which uses a specific simulator based on Zheng et al. (2018) with parameter grids over node counts, sample sizes, edge probabilities, noise types, and missing rates. The Section 5.2 evaluation generates test scenarios from the same simulator and with overlapping parameter ranges (compare Appendix C.1 with C.2 and C.3 with C.4). Consequently, the system's predictions are informed by performance data from the same distribution on which it is tested. The paper should quantify the overlap between the benchmark grid and the test grid, and should evaluate on genuinely out-of-distribution settings (e.g., different graph families, non-Erdos-Renyi structures, or parameter values outside the benchmark grid) to support the abstract's claim of a reliable, scalable, and extensible solution.
- [Table 2, Default Settings row] The abstract claims 'superior performance compared to existing baselines,' but in the default settings of Table 2, Causal-Copilot's F1 is 0.900±0.120 while PC and GES achieve 0.920±0.050 and 0.920±0.090, respectively. The baselines' point estimates are higher and the error bars overlap. This basic scenario directly contradicts the unqualified superiority claim. The claim should be qualified to the specific configurations where Causal-Copilot does show a consistent advantage (e.g., dense graphs, high node counts, data-quality challenges, and compound scenarios).
minor comments (5)
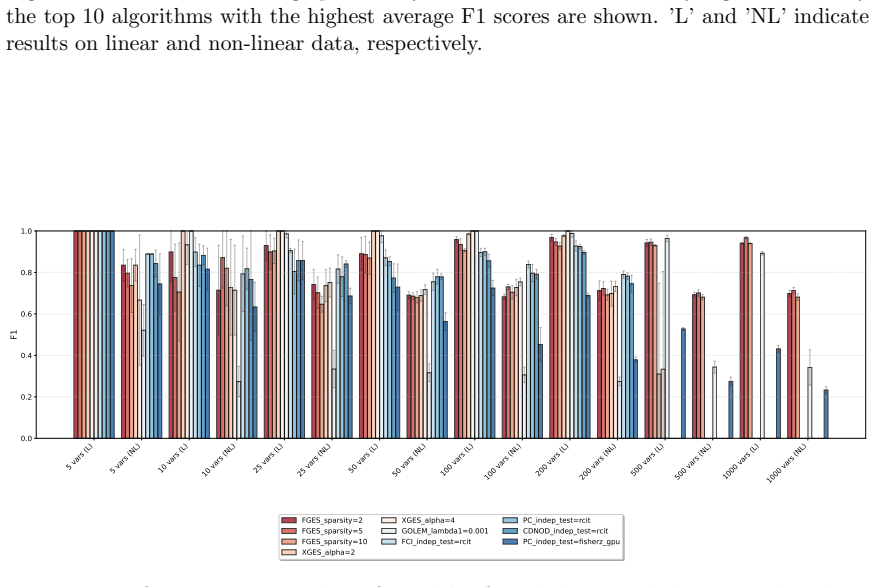
- [Section 5.1.1, Sensitivity to Graph Density] The text refers to 'XES' twice; this should be 'XGES.'
- [Table 2, Node Count rows] The row labels 'Super Large (p=100)' and 'Large Scale Extreme Large Node and Sample (p=1000, n=10000)' are confusing; the naming convention should be made consistent and clearer.
- [Table 3, Very Large row] For p=100, Causal-Copilot's F1 is 0.182, which is low in absolute terms; the text calls this 'superior scalability,' but this is only relative to the baselines that fail to complete and should be presented as such.
- [Appendix D] The metric description says all graph types are converted to DAGs by 'sampling the best DAG representation from the equivalence class,' but the sampling procedure is not specified; this could affect F1 comparisons across methods that output different graph types (CPDAG, PAG, DAG) and should be clarified.
- [Section 3.1, Continuous Optimization-based Methods] CORL is described as a reinforcement-learning-based method but is listed under 'Continuous Optimization-based Methods'; the category name is inaccurate for this algorithm.
Circularity Check
Algorithm-selection validation replays the paper's own benchmark knowledge on the same simulator; a postprocessing confound further weakens the attribution.
-
fitted input called prediction
[Section 5.1 preliminary benchmarking; Section 2.3 Algorithm Ranking; Appendix B reranking prompt; Appendix C.2 evaluation settings; Section 5.2 conclusion]
"To maximize the effectiveness of Causal-Copilot's algorithm selection capabilities, we conducted a comprehensive preliminary benchmarking study... Gather rich, first-hand performance data to support algorithm recommendations that complement theoretical assumptions and reflect how methods actually perform in similar data settings. For evaluating Causal-Copilot on tabular data, we utilized the same data generation framework described above to create a diverse set of test scenarios."
The selection module is explicitly fed the Section 5.1 benchmarking tables: Section 2.3 says the LLM 'retrieves and analyzes benchmarking results across diverse scenarios to evaluate empirical performance,' and the Appendix B reranking prompt instructs the LLM to extract and analyze '[ALGORITHM BENCHMARKING RESULTS]'. The Section 5.2 test scenarios are then generated from 'the same data generation framework' with parameter ranges that overlap the benchmarking grid in Appendix C.1.2. So when Section 5.2 concludes that 'Causal-Copilot's algorithm and hyperparameter selection strategy' delivers the F1 gains, the chosen algorithm is effectively a lookup of the best row of the benchmark table for the same distribution.
full rationale
The circularity is partial rather than total. Causal-Copilot is a systems paper with independent design content (LLM orchestration, preprocessing, report generation, and an illustrative case study), and the self-citations to CD-NOD and CALM are used as integrated algorithms rather than as load-bearing justifications. However, the quantitative validation of the central algorithm-selection claim is in-sample: the knowledge base is built from the Section 5.1 benchmark, the reranking prompt consumes that benchmark, and the Section 5.2 test data come from the same simulator with overlapping configurations. The reported F1 superiority for the selection strategy therefore reduces largely to replaying the benchmark's own winning configurations. There is also a separate, non-circular but serious evaluation confound: Causal-Copilot's reported F1 includes the Section 2.4 postprocessing module (bootstrap edge confidence and LLM-guided graph refinement), while PC, FCI, GES, DirectLiNGAM, and the GPT-4o baseline receive no postprocessing and no ablation isolates its contribution. This further invalidates the attribution of the advantage to 'algorithm and hyperparameter selection strategy' specifically, though it is an experimental-design issue rather than a definitional circularity. Score 6 reflects the partial reduction of the prediction to its own benchmark input; it is not 10 because the system as a whole still has non-circular components and the evaluation is not a formal derivation.
Assumptions & free parameters
free parameters (4)
- Algorithm scalability thresholds in selection prompt =
small<25, medium 25-50, large 50-110, very large>110 variables (Appendix B)
- Performance rating hierarchy (Robust>Strong>Moderate>Limited>Poor) =
Derived from Section 5.1 benchmarking
- Runtime cap for benchmarks =
20 minutes (Appendix D)
- Benchmark hyperparameter grid (XGES alpha 0.5-4, FGES sparsity 2-10, CI tests fisherz/RCIT/KCI/FastKCI/CMIknn) =
multiple values per algorithm
assumptions (5)
- domain assumption Causal Markov condition and faithfulness hold for generated data
- domain assumption The NOTEARS-style synthetic data generator (Erdos-Renyi DAGs with linear/nonlinear SEMs and configurable noise) is representative of real-world causal discovery tasks
- domain assumption LLMs (GPT-4o, Claude-3.5, DeepSeek-R1) reliably parse queries, select algorithms, and execute code without fatal errors
- domain assumption Converting CPDAG/PAG outputs to a DAG by sampling the best DAG from the equivalence class is a fair basis for F1 comparisons
- domain assumption LLM graph refinement does not leak ground truth when variable names are generic
Cite this review
Pith. "Pith review of Causal-Copilot: An Autonomous Causal Analysis Agent." pith.science (2026). https://pith.science/paper/T44ENWPL
@misc{pith2026250413263,
  author       = {Pith},
  title        = {Pith review of: Causal-Copilot: An Autonomous Causal Analysis Agent},
  year         = {2026},
  howpublished = {\url{https://pith.science/paper/T44ENWPL}},
  note         = {Machine review of arXiv:2504.13263}
}
read the original abstract
Causal analysis plays a foundational role in scientific discovery and reliable decision-making, yet it remains largely inaccessible to domain experts due to its conceptual and algorithmic complexity. This disconnect between causal methodology and practical usability presents a dual challenge: domain experts are unable to leverage recent advances in causal learning, while causal researchers lack broad, real-world deployment to test and refine their methods. To address this, we introduce Causal-Copilot, an autonomous agent that operationalizes expert-level causal analysis within a large language model framework. Causal-Copilot automates the full pipeline of causal analysis for both tabular and time-series data -- including causal discovery, causal inference, algorithm selection, hyperparameter optimization, result interpretation, and generation of actionable insights. It supports interactive refinement through natural language, lowering the barrier for non-specialists while preserving methodological rigor. By integrating over 20 state-of-the-art causal analysis techniques, our system fosters a virtuous cycle -- expanding access to advanced causal methods for domain experts while generating rich, real-world applications that inform and advance causal theory. Empirical evaluations demonstrate that Causal-Copilot achieves superior performance compared to existing baselines, offering a reliable, scalable, and extensible solution that bridges the gap between theoretical sophistication and real-world applicability in causal analysis. A live interactive demo of Causal-Copilot is available at https://causalcopilot.com/.
Figures


Figures from the paper (40 more)






Forward citations
Cited by 3 Pith papers
-
CausalForge: A Formally Grounded, Self-Improving Agentic Framework for Automated Research in Causal Inference
CausalForge is a Lean-grounded, self-improving agentic framework that proposes, proves, and statement-audits causal inference theorems; its runs produced nine accepted results including a new ATE minimax upper bound.
-
Automated Synthesis and Adversarial Validation of Executable Causal Research Pipelines
ARA's adversarial protocol-validation pipeline reduced silent causal claims (no sign flips in 33 cases) at the cost of producing more conservative, withheld, or incomplete estimates than a vanilla LLM baseline.
-
Causal MAS: A Survey of Large Language Model Architectures for Discovery and Effect Estimation
A structured survey that defines and catalogs multi-agent LLM systems for causal reasoning, discovery, and effect estimation, including their architectures, benchmarks, and applications.
Reference graph
Works this paper leans on
-
[1]
User query overrides ALL other considerations
-
[2]
Extract expertise, constraints, and requirements from user query FIRST
-
[3]
Prioritize fulfilling user’s specific needs over general algorithm metrics
-
[4]
User-provided domain knowledge supersedes general best practices
-
[5]
Never select a lower-rated algorithm over a higher-rated one with matching properties
EVERY recommendation MUST be directly traceable to the user’s requirements For the dataset [TABLE NAME]that have the following variables: [COLUMNS] And the following statistics: [STATISTICS DESC] And the relevant domain knowledge: [DOMAIN KNOWLEDGE] All candidate algorithms, their descriptions and tags: [ALGO CONTEXT] CRITICAL SELECTION REQUIREMENT When A...
-
[6]
Hyperparameters - **Number of Hyperparameters**: Only three key hyperparameters (alpha, independence test, depth), making tuning more manageable than algorithms with numerous parameters. · · ·
-
[7]
Interpretability - **Output Format**: Produces a Completed Partially Directed Acyclic Graph (CPDAG) that clearly distinguishes definite causal edges from undetermined relationships. · · · Appendix C. Detailed Simulation Experiment Settings C.1 Preliminary benchmarking on tabular causal discovery algorithms To systematically evaluate causal discovery algor...
work page 2021
-
[9]
**User Goal Analysis**: - What is the primary causal question the user is trying to answer? - Is the focus on prediction, explanation, or intervention? - What degree of interpretability is required? - What additional expert knowledge from user that would be relevant for causal structure learning? (e.g., domain-specific data properties)
Show all 28 references
-
[10]
**Data Characteristics Analysis**: - Sample size (n): Is it sufficient for statistical power? (small: <500, medium: 500-5000, large: >5000) - Variable count (p): How many variables need to be considered? Consider these thresholds: * Small scale (<25 variables): Most algorithms...
-
[11]
Include detailed analysis of why certain algorithms are superior for THIS SPECIFIC dataset while others are unsuitable
**Resource Constraints**: - Computational resources: GPU availability, memory limitations, time constraints - Output format requirements: Is a DAG, CPDAG, or PAG preferred or required? REQUIRED: Extensive Reasoning Process You MUST provide comprehensive reasoning at each step,...
-
[12]
The user’s query MUST be your primary consideration - all recommendations MUST directly address their specific needs
-
[13]
Extract and apply ALL domain knowledge and requirements from the user’s query
-
[14]
Your algorithm selection MUST prioritize fulfilling the exact requirements stated by the user
-
[15]
When user expertise contradicts general best practices, ALW AYS favor the user’s domain knowledge User original query (TOP PRIORITY): [USER QUERY] The computation has to be finished in the runtime of [W AIT TIME]minutes. [ACCEPT CPDAG] Dataset Profile - Characteristics: [STATI...
-
[16]
Dataset-Algorithm Compatibility Analysis For each algorithm candidate, evaluate compatibility across these dimensions BASED SOLELY ON THE CURRENT DATASET: - Variable type handling: How well does the algorithm process THIS dataset’s continuous/discrete/mixed variables? · · ·
-
[17]
Critical Assumption Verification For each algorithm: - Identify which core assumptions would be violated by THIS SPECIFIC dataset · · ·
-
[18]
Computational Feasibility Assessment For each algorithm: - Estimate runtime based on THIS dataset’s dimensions=[DIMENSIONS], samples=[SAMPLES], and expected graph density · · ·
-
[19]
Domain-Specific Considerations (SKIP if you find the dataset is not real-world dataset) **NOTE: infer if this dataset is a real-world dataset from dataset name and column name, SKIP this part for numerical simu- lation dataset since it doesn’t indicate any domains** - Does THI...
-
[20]
If an algorithm can deliver robust per- formance and superior accuracy without significantly sacrificing efficiency, it should be considered even if simpler alternatives exist
Performance-Interpretability Balance - What’s more important in THIS domain and for THIS dataset: causal accuracy or interpretability? · · · IMPORTANT NOTE ON ALGORITHM SELECTION It is acceptable to recommend algorithms that may be ”overqualified” for the dataset. If an algori...
-
[21]
It’s best suited for exploratory causal analysis with adequate sample sizes where causal sufficiency can be reasonably assumed
THEORETICAL ASSESSMENT: - Score each algorithm (1-5 scale) based on theoretical properties from algorithm profiles · · · Output in the following JSON format: · · · 41 Causal-Copilot: An Autonomous Causal Analysis Agent Description Profile for An Example Algorithm PC Executive ...
-
[22]
Research by Le et al
Real-World Applications - **Best Use Cases** - **Genomics**: Effectively identifies gene regulatory networks from expression data. Research by Le et al. demonstrated PC’s effectiveness in reconstructing gene regulatory networks from microarray data, particularly with smaller g...
-
[23]
When violated, produces spurious edges and incorrect orientations
Assumptions - **Causal Sufficiency**: Assumes all common causes are measured. When violated, produces spurious edges and incorrect orientations. · · ·
-
[24]
Data Handling Capabilities - **Variable Types**: Suited for continuous data with Fisher-Z test; can handle discrete data with chi-squared test; can also handle mixed data types with non-parametric conditional independence tests. · · ·
-
[25]
Robustness & Scalability - **Missing Data Tolerance**: Poor tolerance for missing values; performance degrades rapidly with missingness above 5 · · ·
-
[26]
Computational Complexity - **Theoretical Time Complexity**: Worst-case O(n(k+2)), where n is the number of variables and k is the maximum degree in the true graph. · · ·
-
[2020]
for markov-blanket based feature selection, NTS-NOTEARS (Zheng et al., 2018) for the non-linear time-series structure learning approach and Tigramite (Runge et al., 2019) for constraint-based time series causal discovery. For causal inference, we integrate DoWhy (Sharma and Ki...
2018
-
[2021]
which provides diverse causal discovery algorithms. We also benefit from specialized implementations such as FGES and XGES for score-based learning, AcceleratedLiNGAM (Ramsey et al., 2017; Nazaret and Blei, 2025; Akinwande and Kolter, 2024) for GPU- accelerated linear non-Gaus...
2017
-
[3425]
Pmlr, 2020. Y. Zheng, B. Huang, W. Chen, J. Ramsey, M. Gong, R. Cai, S. Shimizu, P. Spirtes, and K. Zhang. Causal-learn: Causal discovery in python. Journal of Machine Learning Research, 25(60):1–8, 2024. 38 Causal-Copilot: An Autonomous Causal Analysis Agent Appendix A. Ackno...
2020
Reviewed August 16, 2026 · model on record in the stance chip above.
Discussion (0). Continue with ORCID to comment.