REVIEW 5 major objections 5 minor 74 references
Interactive Hybrid Rice Breeding with Parametric Dual Projection
T0 review · 5 major / 5 minor · reviewed 2026-08-06 · deepseek-v4-flash
Pith's one-line read A parametric dual projection method, built on invertible neural networks inside an autoencoder, makes interactive dual analysis fast enough for hybrid rice breeding while preserving neighborhoods better than the previous state-of-the-art…
desk verdict The parametric dual projection is a real new combination and the case study is solid, but the 'always better than SIRIUS' theorem silently assumes exact autoencoder reconstruction that the training loss doesn't enforce. read the letter →
The pith
A machine-rendered reading of the paper's core claim, the machinery that carries it, and where it could break.
The reading
What carries the argument
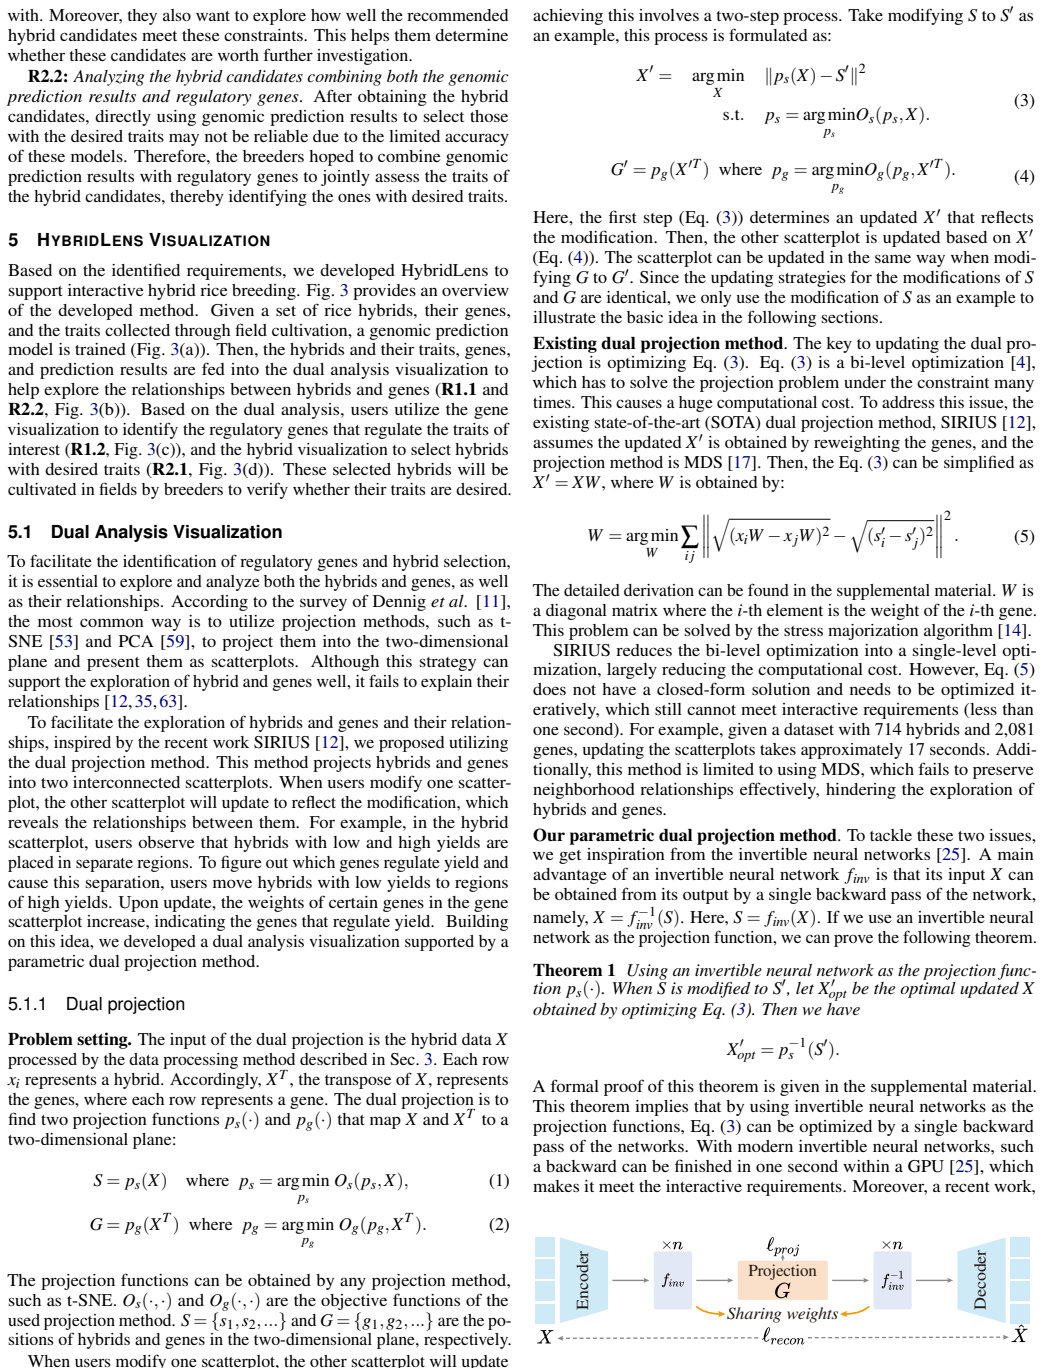
The central object is a parametric dual projection network: an invertible neural network $f_{\mathrm{inv}}$ nested inside an autoencoder, with the hybrid projection given by $S = f_{\mathrm{inv}}(\mathrm{Encoder}(X))$ and the gene projection obtained analogously from $X^T$. Because $f_{\mathrm{inv}}$ is invertible, an edited scatterplot $S'$ is mapped back to data by one backward pass, $X' = \mathrm{Decoder}(f_{\mathrm{inv}}^{-1}(S'))$, which replaces SIRIUS's iterative stress-majorization optimization and makes updates take about 0.01 seconds. The training objective is a weighted sum of a contrastive loss that preserves neighborhoods and a reconstruction loss that lets the inverse exist; the paper's Theorem 2 claims this scheme always beats SIRIUS in matching the edited scatterplot.
What would settle it
Measure the reconstruction error of the trained autoencoder on the rice dataset; if $\mathrm{Decoder}(f_{\mathrm{inv}}^{-1}(S'))$ is not close to $X'$ for typical edited scatterplots, then the inequality in Theorem 2 is not operational. Then, on many random edits, compute both $p_s(X'_{\mathrm{inv}})$ and $p_s(X'_{\mathrm{SIRIUS}})$ and check whether the claimed distance-to-$S'$ dominance actually holds in every case.
Extended reading notes
Core claim
The paper claims that interactive dual analysis can be made parametric and near-instantaneous by using invertible neural networks as the projection functions, and that this is not only faster but also better at preserving neighborhoods than the existing state-of-the-art method SIRIUS. Applied to 714 Indica rice hybrids, the HybridLens tool lets a breeder move hybrids in one scatterplot, immediately see which genes' weights rise in the other, verify candidate regulatory genes against chromosome context and genotype-trait boxplots, and select hybrids whose genotypes match known regulators. In the case study the method rediscovers the known length/width-ratio gene GW7, points to a previously unreported candidate region on chromosome 4, and explains why GS3 appears ineffective due to extreme allele imbalance. The central theoretical assertion, stated as Theorem 2, is that when one scatterplot is modified, the updated other scatterplot produced by this method is always at least as close to the user's edit as the one produced by SIRIUS.
Load-bearing premise
The theorem that the new method always beats SIRIUS assumes the autoencoder reconstructs the original gene data almost perfectly, but the training loss only balances reconstruction against projection quality, so perfect reconstruction is not guaranteed.
Editorial extensions
If this is right
- Dual projection updates complete in about 0.01 seconds versus roughly 17 seconds for SIRIUS on the rice dataset, making interactive exploration feasible on genomic-scale data.
- The method achieves higher trustworthiness and continuity than SIRIUS on MNIST, CIFAR-10, and the rice genomic dataset, meaning the scatterplot neighborhoods better reflect true high-dimensional relationships.
- Breeders can identify regulatory genes by interacting with hybrids, rediscovering the known gene GW7 and surfacing a candidate region on chromosome 4 for the target rice population.
- Combining the hybrid recommendation with dual analysis selected 24 hybrids that met the desired traits, versus 126 hybrids for automatic genomic selection alone, reducing the field-cultivation workload.
- The parametric projection is domain-agnostic, so the same dual-analysis machinery can be applied to other paired high-dimensional datasets once the visual encodings are redesigned.
Reading between the lines
- Because the projection is parametric, the same dual-analysis machinery should transfer to other paired datasets, such as protein features and organism traits or patient genotypes and drug responses, with only the visual encodings redesigned.
- The theoretical guarantee is only as strong as the reconstruction term in the training loss; a natural next experiment is to measure how the claimed dominance over SIRIUS degrades as the reconstruction error grows or as the balancing weight $\lambda$ changes.
- The closed-form gene-weight update $W = \mathrm{diag}(X^T X')/\mathrm{diag}(X^T X)$ gives an interpretable per-gene importance score that could be validated against GWAS hits beyond the single case study.
- The 126-versus-24 comparison treats uncultivated hybrids as undesired, so a true forward validation would require growing the 24 recommended hybrids to maturity and measuring their traits directly.
Editorial analysis
A structured set of objections, weighed in public.
Referee Report
Summary. The paper proposes a visual analytics system, HybridLens, for interactive hybrid rice breeding. The core technical contribution is a parametric dual projection method that uses an invertible neural network nested inside an autoencoder to project both hybrids and genes into two linked scatterplots, allowing a user's modification of one scatterplot to update the other in about 0.01 seconds. The authors claim two theorems: Theorem 1 states that the optimal updated data are obtained by a single backward pass through the inverse projection, and Theorem 2 states that the proposed update is always better than the existing SIRIUS method in terms of squared distance to the user-modified projection. The system also includes a hybrid recommendation view and a gene visualization, and the paper reports a quantitative comparison with t-SNE, PCA, and SIRIUS on MNIST, CIFAR-10, and rice genomic data, as well as a case study with rice breeders and a simulated field experiment.
Significance. If the theoretical and empirical claims are valid, the paper makes a valuable contribution to interactive dual projection and to visual analytics for genomic breeding. The system addresses a real and well-motivated problem, the case study with breeders is informative, and the source code is promised. The interactive speed of the proposed dual projection is a clear improvement over SIRIUS, and the approach is domain-agnostic. However, the advertised theoretical guarantee 'always better than SIRIUS' is currently not supported by a verifiable proof in the manuscript and appears to rely on an unstated perfect-reconstruction assumption. The quantitative evaluation is also weakened by single-run results and by metrics that measure the same neighborhood-preservation objective used in training. These issues are central to the paper's claimed contributions, but they are in principle fixable, so the paper merits revision rather than rejection.
major comments (5)
- [Sec. 5.1.1, Eq. (6)-(8)] Theorem 2 does not follow from the stated training objective. Since ps(X'_inv) = finv(Encoder(Decoder(finv^{-1}(S')))), the equality ps(X'_inv)=S' holds only if Encoder(Decoder(z))=z for z=finv^{-1}(S'), i.e., the autoencoder reconstruction loss in Eq. (8) is zero. The actual objective in Eq. (6) is a weighted sum L = ℓ_proj + λ ℓ_recon, and nothing forces ℓ_recon to vanish. As stated, the theorem is therefore unproven, and the inequality over SIRIUS is a conditional statement at best. The proof is deferred to a supplemental document that is not included, so the hidden assumption cannot be checked. Please either state and prove the theorem under an explicit perfect-reconstruction assumption, or derive a bound of the form ||ps(X'_inv)-S'||^2 ≤ B(ℓ_recon) that depends on the reconstruction error and show that this bound is smaller than the corresponding SIRIUS error under the settings of Table 1.
- [Sec. 5.1.1, Theorem 1 and Fig. 5] Theorem 1 claims that when an invertible neural network is used as the projection function ps, the optimal updated data satisfy X'_opt = p^{-1}_s(S'). However, the architecture defines ps as ps(X)=finv(Encoder(X)), and the inverse is defined as p^{-1}_s(S')=Decoder(finv^{-1}(S')). Because the encoder maps the high-dimensional input to a low-dimensional latent space, ps is not invertible as a function on the input space; the decoder-based quantity is an approximate inverse only if the autoencoder is near-perfect. The statement of Theorem 1 is thus inconsistent with the actual architecture unless an explicit autoencoder-invertibility condition is added. Please clarify the exact invertibility assumptions and reconcile them with the dimensionality reduction performed by the encoder, or revise the theorem statement accordingly.
- [Table 1 and Sec. 6.1] The quantitative comparison reports single values for trustworthiness T(30), continuity C(30), and Time, with no standard deviations, no repeated runs, and no significance tests. Since the proposed method is trained with stochastic optimization and the contrastive loss in Eq. (7), the reported margins (e.g., T(30) of 0.961 vs 0.781 on MNIST) cannot be assessed for statistical reliability. Additionally, trustworthiness and continuity measure the same kNN neighborhood-preservation objective that the contrastive loss ℓ_proj optimizes, so the comparison is partly self-confirming. An independent evaluation, such as a downstream classification task or a baseline trained without the contrastive objective, is needed to support the claim that the proposed projection better preserves neighborhoods.
- [Sec. 6.2.3] The simulated field experiment labels every hybrid that has not been cultivated in the private dataset as undesired. The manuscript explicitly acknowledges that this assumption is 'not highly rigorous' and that some uncultivated hybrids may actually be desirable. Under this labeling, the reported saving of 102 field cultivations is not a valid measure of workload reduction; it conflates 'not previously cultivated' with 'undesired.' The claim that HybridLens 'largely reduces the workload' of field cultivation is therefore overstated. Please re-analyze the simulations using only the subset of hybrids with known cultivated traits, or clearly label the result as anecdotal rather than as quantitative evidence.
- [Sec. 5.1.1, Theorems 1 and 2] The proofs of Theorems 1 and 2 are deferred to a supplemental document that is not included in the manuscript. Because these theorems are the central advertised theoretical guarantees and their validity is in question for the reasons described above, the main text should contain at least a proof sketch with all assumptions explicitly stated. Without this, the reader cannot verify the claimed theoretical superiority over SIRIUS.
minor comments (5)
- [Eq. (5)] The formula for W contains stray 'q' symbols and is difficult to parse; please rewrite the expression with clear notation for the distance terms.
- [Sec. 5.1.1] The notation p^{-1}_s is used to define X' before the inverse map is formally introduced; please define p^{-1}_s as Decoder(finv^{-1}(·)) before its first use.
- [Fig. 6] Several subfigures are referenced as A-F in the text but are not clearly labeled in the figure; adding explicit labels would improve readability.
- [Sec. 3] The paper uses 'gene' to refer to a Single Nucleotide Polymorphism; although the term is defined, the unconventional usage is potentially confusing and could be highlighted at first use.
- [Sec. 6.1] The text quotes an update time of approximately 17 seconds for a dataset of 714 hybrids and 2,081 genes, which is consistent with the genomic Time value in Table 1, but the quotation and table should be cross-referenced explicitly to avoid ambiguity.
Circularity Check
The 'always better than SIRIUS' theorem is definitional through p_s^{-1}, and the projection-quality metrics mirror the training objective.
-
self definitional
[Section 5.1.1, Theorem 2 (with Eq. (6) and the definition X′ = p−1s(S′))]
"When the S is modified to S′, X and G are updated accordingly: X′ = p−1s(S′) =Decoder(f −1inv(S′)), G = pg(X′T). With this network, we can prove the following theorem. Theorem 2 Using an invertible neural network as the projection method ps(·). When S is modified to S′, let X′SIRIUS be the updated X obtained by SIRIUS, and X′inv be the updated X obtained by our method. Then we have ∥ps(X′inv) − S′∥2 ≤ ∥ps(X′SIRIUS) − S′∥2."
By definition, X′inv is set to p−1s(S′), so if ps is truly invertible then ps(X′inv) = S′ and the left-hand side of Theorem 2 is exactly zero. The inequality is then automatic and says nothing about SIRIUS's optimization quality; it is a restatement of what 'inverse' means. In the implemented system ps is not an invertible map from the high-dimensional X space to 2D; it is finv(Encoder(X)), and the inverse is only approximated by Decoder(finv−1(·)). Training minimizes L = ℓproj + λℓrecon with a soft multi-task weight λ, so nothing forces ℓrecon to vanish and the equality ps(X′inv) = S′ is an unstated perfect-reconstruction assumption rather than a theorem.
-
other
[Sections 5.1.1 and 6.1, Eq. (7) and evaluation measures (T(30), C(30))]
"For the first termℓproj, the contrastive loss is utilized, which has been proven to be effective in preserving neighborhood relationships [60]: ℓproj = −log exp(sim(xi,xj)/τ) / ∑_{t≠i} exp(sim(xi,xt)/τ) . (7) ... We evaluated the results using the trustworthiness and continuity metrics to measure neighborhood preservation in the projection. Trustworthiness. It measures how well the k-nearest neighbors (kNNs) of a point in the embedding space reflect its true neighbors in the high-dimensional space."
The contrastive loss in Eq. (7) is the training objective that directly shapes the embedding to preserve the similarity/neighborhood structure of the high-dimensional data, while trustworthiness and continuity (T(30), C(30)) are used as the evaluation metrics for the same neighborhood-preservation property. The reported quantitative advantage over SIRIUS is therefore partly a measure of how well the model was fitted to the metric, not an independent test of a derived prediction about unseen structure. This is a partial self-confirmation of the projection-quality comparison, although it does not affect the independent speed measurement or the domain case study.
full rationale
The central theoretical claim of the paper is Theorem 2, and it is definitional: X'_inv is constructed as p_s^{-1}(S') = Decoder(f_inv^{-1}(S')), so the inequality ||ps(X'_inv)-S'||^2 <= ||ps(X'_SIRIUS)-S'||^2 is automatic whenever ps is treated as invertible, with the left side equal to zero. No comparison with SIRIUS's optimization quality is needed. In the implemented method ps is not an invertible map from high-dimensional X to 2D; it is finv(Encoder(X)), and the inverse is only an autoencoder approximation. Because training minimizes L = l_proj + lambda*l_recon with a soft multi-task weight, l_recon is not forced to zero, so the equality ps(X'_inv)=S' is an unstated assumption rather than a proof. The quantitative T/C comparison is also partly self-confirming because Eq. (7) optimizes the same neighborhood-preservation objective used as the evaluation metric. These issues do not affect the independent speed measurement or the acknowledged simulation-based field experiment; the latter is explicitly labeled as 'not highly rigorous,' a limitation rather than a circular derivation. No load-bearing self-citation chain was found. Overall, partial circularity in the central 'always better' theorem and in the projection-quality comparison gives a score of 6.
Assumptions & free parameters
free parameters (7)
- lambda (loss balance weight) =
determined by multi-task learning, exact value not given
- tau (contrastive temperature) =
not specified in the paper
- epsilon (genetic distance threshold) =
set as the mean genomic distance of cultivated hybrids
- beta (score threshold) =
user-set
- gamma (sparsity weight) =
max D/K to select around K hybrids
- PCA dimensionality =
200
- invertible network architecture =
four invertible layers, details in supplemental
assumptions (5)
- domain assumption Traits of hybrids are primarily determined by their genes in a stable environment.
- domain assumption The 0/1/2 genotype encoding relative to Nipponbare, followed by PCA to 200 dimensions, retains trait-relevant genetic variation.
- ad hoc to paper Moving hybrids or genes in the scatterplot and computing inverse network updates identifies regulatory genes through computed gene weights.
- ad hoc to paper The autoencoder reconstructs well enough that the inverse network update gives ps(X') approximately equal to S'.
- ad hoc to paper In the simulated field experiment, uncultivated hybrids are considered undesired.
Cite this review
Pith. "Pith review of Interactive Hybrid Rice Breeding with Parametric Dual Projection." pith.science (2026). https://pith.science/paper/SWAFBXXS
@misc{pith2026250711848,
  author       = {Pith},
  title        = {Pith review of: Interactive Hybrid Rice Breeding with Parametric Dual Projection},
  year         = {2026},
  howpublished = {\url{https://pith.science/paper/SWAFBXXS}},
  note         = {Machine review of arXiv:2507.11848}
}
read the original abstract
Hybrid rice breeding crossbreeds different rice lines and cultivates the resulting hybrids in fields to select those with desirable agronomic traits, such as higher yields. Recently, genomic selection has emerged as an efficient way for hybrid rice breeding. It predicts the traits of hybrids based on their genes, which helps exclude many undesired hybrids, largely reducing the workload of field cultivation. However, due to the limited accuracy of genomic prediction models, breeders still need to combine their experience with the models to identify regulatory genes that control traits and select hybrids, which remains a time-consuming process. To ease this process, in this paper, we proposed a visual analysis method to facilitate interactive hybrid rice breeding. Regulatory gene identification and hybrid selection naturally ensemble a dual-analysis task. Therefore, we developed a parametric dual projection method with theoretical guarantees to facilitate interactive dual analysis. Based on this dual projection method, we further developed a gene visualization and a hybrid visualization to verify the identified regulatory genes and hybrids. The effectiveness of our method is demonstrated through the quantitative evaluation of the parametric dual projection method, identified regulatory genes and desired hybrids in the case study, and positive feedback from breeders.
Figures


Figures from the paper (6 more)



Reference graph
Works this paper leans on
-
[1]
B. Alsallakh, L. Micallef, W. Aigner, H. Hauser, S. Miksch, and P. Rodgers. The state-of-the-art of set visualization. Computer Graphics Forum , 35(1):234–260, 2016. doi: 10.1111/cgf.12722 6
-
[2]
R. Arias-Hernandez, L. T. Kaastra, T. M. Green, and B. Fisher. Pair analytics: Capturing reasoning processes in collaborative visual analytics. In Proceedings of the IEEE International Conference on System Sciences, pp. 1–10, 2011. doi: 10.1109/HICSS.2011.339 7
-
[3]
E. Artur and R. Minghim. A novel visual approach for enhanced attribute analysis and selection. Computers & Graphics, 84:160–172, 2019. doi: 10.1016/j.cag.2019.08.015 2
-
[4]
J. F. Bard. Practical bilevel optimization: algorithms and applications , vol. 30. Springer Science & Business Media, 2013. 4
work page 2013
-
[5]
E. Blanco, M. González-Ramírez, and L. Di Croce. Productive visualiza- tion of high-throughput sequencing data using the seqcode open portable platform. Scientific Reports, 11(1):19545, 2021. doi: 10.1038/s41598-021 -98889-7 2
-
[6]
C. Chen, J. Chen, W. Yang, H. Wang, J. Knittel, X. Zhao, S. Koch, T. Ertl, and S. Liu. Enhancing single-frame supervision for better temporal action localization. IEEE Transactions on Visualization and Computer Graphics, 30(6):2903–2915, 2024. doi: 10.1109/TVCG.2024.3388521 5
arXiv 2024
-
[7]
C. Chen, F. Lv, Y . Guan, P. Wang, S. Yu, Y . Zhang, and Z. Tang. Human- guided image generation for expanding small-scale training image datasets. IEEE Transactions on Visualization and Computer Graphics, 31(6):3809– 3821, 2025. doi: 10.1109/TVCG.2025.3567053 7
arXiv 2025
- [8]
Show all 74 references
-
[9]
C. Chen, J. Wu, X. Wang, S. Xiang, S.-H. Zhang, Q. Tang, and S. Liu. Towards better caption supervision for object detection.IEEE Transactions on Visualization and Computer Graphics, 28(4):1941–1954, 2022. doi: 10 .1109/TVCG.2021.3138933 6
1941
-
[10]
C. Chen, J. Yuan, Y . Lu, Y . Liu, H. Su, S. Yuan, and S. Liu. OoDAnalyzer: Interactive analysis of out-of-distribution samples. IEEE Transactions on Visualization and Computer Graphics, 27(7):3335–3349, 2021. doi: 10. 1109/TVCG.2020.2973258 6
2021
-
[11]
F. L. Dennig, M. Miller, D. A. Keim, and M. El-Assady. FS/DS: A theoretical framework for the dual analysis of feature space and data space. IEEE Transactions on Visualization and Computer Graphics, 2023. doi: 10.1109/TVCG.2023.3288356 2, 4
2023
-
[12]
Dowling, J
M. Dowling, J. Wenskovitch, J. Fry, L. House, and C. North. SIRIUS: Dual, symmetric, interactive dimension reductions. IEEE Transactions on Visualization and Computer Graphics, 25(1):172–182, 2018. doi: 10. 1109/TVCG.2018.2865047 2, 4
2018
-
[13]
Elhamifar, G
E. Elhamifar, G. Sapiro, and S. S. Sastry. Dissimilarity-based sparse subset selection. IEEE Transactions on Pattern Analysis and Machine Intelligence, 38(11):2182–2197, 2015. doi: 10.1109/tpami.2015.2511748 6
2015
-
[14]
Endert, C
A. Endert, C. Han, D. Maiti, L. House, and C. North. Observation-level interaction with statistical models for visual analytics. In Proceedings of the IEEE Conference on Visual Analytics Science and Technology, pp. 121–130, 2011. doi: 10.1109/V AST.2011.6102449 2, 4
2011
-
[15]
S. J. Fernstad, J. Shaw, and J. Johansson. Quality-based guidance for exploratory dimensionality reduction. Information Visualization, 12(1):44– 64, 2013. doi: 10.1177/1473871612460526 2
2013 doi
-
[16]
S. A. Flint-Garcia, J. M. Thornsberry, and E. S. Buckler IV . Structure of linkage disequilibrium in plants. Annual Review of Plant Biology , 54(1):357–374, 2003. doi: 10.1146/annurev.arplant.54.031902.134907 8
2003
-
[17]
E. R. Gansner, Y . Koren, and S. North. Graph drawing by stress majoriza- tion. In Graph Drawing: 12th International Symposium, GD 2004, New York, NY, USA, September 29-October 2, 2004, Revised Selected Papers 12, pp. 239–250, 2005. doi: 10.1007/978-3-540-31843-9_25 4
2004 doi
-
[18]
Garrison, J
L. Garrison, J. Müller, S. Schreiber, S. Oeltze-Jafra, H. Hauser, and S. Bruckner. Dimlift: Interactive hierarchical data exploration through dimensional bundling. IEEE Transactions on Visualization and Computer Graphics, 27(6):2908–2922, 2021. doi: 10.1109/TVCG.2021.3057519 2
2021
-
[19]
Z. Gu, J. Gong, Z. Zhu, Z. Li, Q. Feng, C. Wang, Y . Zhao, Q. Zhan, C. Zhou, A. Wang, T. Huang, L. Zhang, Q. Tian, D. Fan, Y . Lu, Q. Zhao, X. Huang, S. Yang, and B. Han. Structure and function of rice hybrid genomes reveal genetic basis and optimal performance of heterosis.Na...
2023 doi
-
[20]
Holten and J
D. Holten and J. J. Van Wijk. Force-directed edge bundling for graph visualization. Computer Graphics Forum, 28(3):983–990, 2009. doi: 10. 1111/j.1467-8659.2009.01450.x 6
2009
-
[21]
Huang, X
X. Huang, X. Wei, T. Sang, Q. Zhao, Q. Feng, Y . Zhao, C. Li, C. Zhu, T. Lu, Z. Zhang, M. Li, D. Fan, Y . Guo, A. Wang, L. Wang, L. Deng, W. Li, Y . Lu, Q. Weng, K. Liu, T. Huang, T. Zhou, Y . Jing, W. Li, Z. Lin, E. S. Buckler, Q. Qian, Q.-F. Zhang, J. Li, and B. Han. Genome-...
-
[22]
J. Jing, X. Deng, M. Xu, J. Wang, and Z. Guan. HiNet: Deep image hiding by invertible network. In Proceedings of the IEEE/CVF International Conference on Computer Vision , pp. 4733–4742, 2021. doi: 10.1109/ ICCV48922.2021.00469 2
2021
-
[23]
Kawahara, M
Y . Kawahara, M. de la Bastide, J. P. Hamilton, H. Kanamori, W. R. Mc- Combie, S. Ouyang, D. C. Schwartz, T. Tanaka, J. Wu, S. Zhou, et al. Improvement of the oryza sativa nipponbare reference genome using next generation sequence and optical map data. Rice, 6:1–10, 2013. doi:...
2013
-
[24]
Kerkhoven, F
R. Kerkhoven, F. H. Van Enckevort, J. Boekhorst, D. Molenaar, and R. J. Siezen. Visualization for genomics: the microbial genome viewer. Bioinformatics, 20(11):1812–1814, 2004. doi: 10.1093/bioinformatics/ bth159 2
2004 doi
-
[25]
D. P. Kingma and P. Dhariwal. Glow: Generative flow with invertible 1x1 convolutions. Advances in Neural Information Processing Systems, 31,
-
[26]
Krizhevsky
A. Krizhevsky. Learning multiple layers of features from tiny images. University of Toronto, 05 2012. 6
2012
-
[27]
LeCun, L
Y . LeCun, L. Bottou, Y . Bengio, and P. Haffner. Gradient-based learning applied to document recognition. Proceedings of the IEEE, 86(11):2278– 2324, 1998. doi: 10.1109/5.726791 6
1998 doi
-
[28]
H. Li, M. Xu, Y . Wang, H. Wei, and H. Qu. A visual analytics approach to facilitate the proctoring of online exams. In Proceedings of the CHI Conference on Human Factors in Computing Systems, pp. 1–17, 2021. doi: 10.1145/3411764.3445294 5
2021
-
[29]
C. Liu, M. R. Schläppi, B. Mao, W. Wang, A. Wang, and C. Chu. The bzip73 transcription factor controls rice cold tolerance at the reproductive stage. Plant Biotechnology Journal , 17(9):1834–1849, 2019. doi: 10. 1111/pbi.13104 3
2019
-
[30]
S. Liu, C. Chen, Y . Lu, F. Ouyang, and B. Wang. An interactive method to improve crowdsourced annotations. IEEE Transactions on Visualization and Computer Graphics, 25(1):235–245, 2019. doi: 10.1109/TVCG.2018. 2864843 6
2019 doi
-
[31]
S. Liu, Y . Liang, and A. Gitter. Loss-balanced task weighting to reduce negative transfer in multi-task learning. In Proceedings of the AAAI Conference on Artificial Intelligence, pp. 9977–9978, 2019. doi: 10.1609/ aaai.v33i01.33019977 5
2019
-
[32]
Q. Lv, W. Li, Z. Sun, N. Ouyang, X. Jing, Q. He, J. Wu, J. Zheng, J. Zheng, S. Tang, et al. Resequencing of 1,143 indica rice accessions reveals important genetic variations and different heterosis patterns.Nature Communications, 11(1):4778, 2020. doi: 10.1038/s41467-020-18608-0 3, 6
2020 doi
-
[33]
L’Yi and N
S. L’Yi and N. Gehlenborg. Multi-view design patterns and responsive visualization for genomics data. IEEE Transactions on Visualization and Computer Graphics, 29(1):559–569, 2022. doi: 10.1109/TVCG.2022. 3209398 2
2022 doi
-
[34]
S. LYi, Q. Wang, F. Lekschas, and N. Gehlenborg. Gosling: A grammar- based toolkit for scalable and interactive genomics data visualization.IEEE Transactions on Visualization and Computer Graphics, 28(1):140–150,
-
[35]
F. Lyu, C. Chen, J. Zhang, X. Feng, and Z. Tang. Visualization for supercomputer system: A survey. Journal of Computer-Aided Design and Computer Graphics, 36(3):321–335, 2024. doi: 10.3724/SP.J.1089.2024. 2023-00791 4
2024
-
[36]
Mishra, B
A. Mishra, B. Danzy, U. Soni, A. Arunkumar, J. Huang, B. C. Kwon, and C. Bryan. PromptAid: Visual prompt exploration, perturbation, testing and iteration for large language models. IEEE Transactions on Visualization and Computer Graphics, 2025. to be published. doi: 10.1109/tv...
2025 doi
-
[37]
Muller, L
J. Muller, L. Garrison, P. Ulbrich, S. Schreiber, S. Bruckner, H. Hauser, and S. Oeltze-Jafra. Integrated dual analysis of quantitative and qualitative high-dimensional data. IEEE Transactions on Visualization and Computer Graphics, 27(6):2953–2966, 2021. doi: 10.1109/TVCG.202...
2021
-
[38]
Q. V . Nguyen, N. H. Khalifa, P. Alzamora, A. Gleeson, D. Catchpoole, P. J. Kennedy, and S. Simoff. Visual analytics of complex genomics data to guide effective treatment decisions. Journal of Imaging, 2(4):29, 2016. doi: 10.3390/jimaging2040029 2
2016 doi
-
[39]
Nusrat, T
S. Nusrat, T. Harbig, and N. Gehlenborg. Tasks, techniques, and tools for genomic data visualization. Computer Graphics Forum, 38(3):781–805,
-
[41]
Radford, J
A. Radford, J. W. Kim, C. Hallacy, A. Ramesh, G. Goh, S. Agarwal, G. Sastry, A. Askell, P. Mishkin, J. Clark, G. Krueger, and I. Sutskever. Learning transferable visual models from natural language supervision. In Proceedings of the International Conference on Machine Learning...
2021
-
[42]
P. E. Rauber, A. X. Falcao, and A. C. Telea. Projections as visual aids for classification system design. Information Visualization, 17(4):282–305,
-
[43]
Rombach, A
R. Rombach, A. Blattmann, D. Lorenz, P. Esser, and B. Ommer. High- resolution image synthesis with latent diffusion models. In Proceedings of the IEEE/CVF Conference on Computer Vision and Pattern Recognition, pp. 10684–10695, 2022. doi: 10.1109/CVPR52688.2022.01042 5
2022
-
[44]
J. Z. Self, R. K. Vinayagam, J. T. Fry, and C. North. Bridging the gap between user intention and model parameters for human-in-the-loop data analytics. In Proceedings of the Workshop on Human-In-the-Loop Data Analytics, pp. 1–6, 2016. doi: 10.1145/2939502.2939505 2
2016
-
[45]
H. Tang, V . Krishnakumar, X. Zeng, Z. Xu, A. Taranto, J. S. Lomas, Y . Zhang, Y . Huang, Y . Wang, W. C. Yim, et al. JCVI: A versatile toolkit for comparative genomics analysis. Imeta, 3(4):e211, 2024. doi: 10. 1002/imt2.211 2
2024
-
[46]
Thorvaldsdóttir, J
H. Thorvaldsdóttir, J. T. Robinson, and J. P. Mesirov. Integrative ge- nomics viewer (igv): high-performance genomics data visualization and exploration. Briefings in Bioinformatics, 14(2):178–192, 2013. doi: 10. 1093/bib/bbs017 2
2013
-
[47]
Turkay, E
C. Turkay, E. Kaya, S. Balcisoy, and H. Hauser. Designing progressive and interactive analytics processes for high-dimensional data analysis. IEEE Transactions on Visualization and Computer Graphics, 23(1):131–140,
-
[48]
Turkay, A
C. Turkay, A. Lex, M. Streit, H. Pfister, and H. Hauser. Characterizing cancer subtypes using dual analysis in caleydo stratomex. IEEE Computer Graphics and Applications, 34(2):38–47, 2014. doi: 10.1109/MCG.2014. 1 2
2014 doi
-
[49]
Turkay, A
C. Turkay, A. Lundervold, A. J. Lundervold, and H. Hauser. Repre- sentative factor generation for the interactive visual analysis of high- dimensional data. IEEE Transactions on Visualization and Computer Graphics, 18(12):2621–2630, 2012. doi: 10.1109/TVCG.2012.256 2
2012 doi
-
[50]
Turkay, A
C. Turkay, A. Slingsby, H. Hauser, J. Wood, and J. Dykes. Attribute sig- natures: Dynamic visual summaries for analyzing multivariate geograph- ical data. IEEE Transactions on Visualization and Computer Graphics, 20(12):2033–2042, 2014. doi: 10.1109/TVCG.2014.2346265 2
2014
-
[51]
van den Brandt, E
A. van den Brandt, E. M. Jonkheer, D.-J. M. van Workum, H. van de Wetering, S. Smit, and A. Vilanova. PanV A: Pangenomic variant analysis. IEEE Transactions on Visualization and Computer Graphics, 30(8):4895– 4909, 2024. doi: 10.1109/TVCG.2023.3282364 2
2024
-
[52]
van der Corput and J
P. van der Corput and J. J. van Wijk. Exploring items and features with if, fi-tables. Computer Graphics Forum, 35(3):31–40, 2016. doi: 10.1111/cgf .12879 2
2016 doi
-
[53]
Van der Maaten and G
L. Van der Maaten and G. Hinton. Visualizing data using t-sne. Journal of Machine Learning Research, 9(11):2579–2605, 2008. 4
2008
-
[54]
K. Wang, M. A. Abid, A. Rasheed, J. Crossa, S. Hearne, and H. Li. DNNGP, a deep neural network-based method for genomic prediction using multi-omics data in plants. Molecular Plant, 16(1):279–293, 2023. doi: 10.1016/j.molp.2022.11.004 2, 3
2023 doi
-
[55]
Q. Wang, X. Liu, M. Q. Liang, S. L’Yi, and N. Gehlenborg. Enabling multimodal user interactions for genomics visualization creation. In Pro- ceedings of the IEEE Visualization and Visual Analytics , pp. 111–115,
-
[56]
X. Wang, W. Chen, J. Xia, Z. Wen, R. Zhu, and T. Schreck. HetVis: A visual analysis approach for identifying data heterogeneity in horizontal federated learning. IEEE Transactions on Visualization and Computer Graphics, 29(1):310–319, 2023. doi: 10.1109/TVCG.2022.3209347 6
2023
-
[57]
X. Wang, S. Liu, J. Liu, J. Chen, J. Zhu, and B. Guo. TopicPanorama: A full picture of relevant topics. IEEE Transactions on Visualization and Computer Graphics, 22(12):2508–2521, 2016. doi: 10.1109/tvcg.2016. 2515592 2
2016 doi
-
[58]
X. Wei, J. Qiu, K. Yong, J. Fan, Q. Zhang, H. Hua, J. Liu, Q. Wang, K. M. Olsen, B. Han, et al. A quantitative genomics map of rice provides genetic insights and guides breeding. Nature Genetics, 53(2):243–253, 2021. doi: 10.1038/s41588-020-00769-9 2
2021 doi
-
[59]
S. Wold, K. Esbensen, and P. Geladi. Principal component analysis. Chemometrics and Intelligent Laboratory Systems, 2(1-3):37–52, 1987. doi: 10.1007/springerreference_84147 4
1987 doi
-
[60]
J. Xia, L. Huang, W. Lin, X. Zhao, J. Wu, Y . Chen, Y . Zhao, and W. Chen. Interactive visual cluster analysis by contrastive dimensionality reduction. IEEE Transactions on Visualization and Computer Graphics, 29(1):734– 744, 2022. doi: 10.1109/tvcg.2022.3209423 5
2022
-
[61]
J. Xia, L. Huang, Y . Sun, Z. Deng, X. L. Zhang, and M. Zhu. A parallel framework for streaming dimensionality reduction. IEEE Transactions on Visualization and Computer Graphics, 30(1):142–152, 2024. doi: 10. 1109/TVCG.2023.3326515 6
2024
-
[62]
Y . Xu, K. Ma, Y . Zhao, X. Wang, K. Zhou, G. Yu, C. Li, P. Li, Z. Yang, C. Xu, et al. Genomic selection: A breakthrough technology in rice breeding. The Crop Journal, 9(3):669–677, 2021. doi: 10.1016/j.cj.2021. 03.008 1
2021 doi
-
[63]
W. Yang, M. Liu, Z. Wang, and S. Liu. Foundation models meet visu- alizations: Challenges and opportunities. Computational Visual Media, 10(3):399–424, 2024. 4
2024
-
[64]
Y . Ye, S. Xiao, X. Zeng, and W. Zeng. ModalChorus: Visual probing and alignment of multi-modal embeddings via modal fusion map. IEEE Transactions on Visualization and Computer Graphics, 31(1):294–304,
-
[65]
L. Yuan. Progress in super-hybrid rice breeding. The Crop Journal , 5(2):100–102, 2017. doi: 10.1016/j.cj.2017.02.001 1
2017 doi
-
[66]
X. Yuan, D. Ren, Z. Wang, and C. Guo. Dimension projection ma- trix/tree: Interactive subspace visual exploration and analysis of high dimensional data. IEEE Transactions on Visualization and Computer Graphics, 19(12):2625–2633, 2013. doi: 10.1109/TVCG.2013.150 2
2013 doi
-
[67]
J. Zhao, M. Karimzadeh, A. Masjedi, T. Wang, X. Zhang, M. M. Craw- ford, and D. S. Ebert. FeatureExplorer: Interactive feature selection and exploration of regression models for hyperspectral images. In Proceed- ings of the IEEE Visualization Conference, pp. 161–165, 2019. doi...
2019
-
[68]
Y . Zhou, C. Chen, Z. Shen, J. Zhu, J. Chen, W. Yang, and S. Liu. Hierarchi- cal fuzzy-cluster-aware grid layout for large-scale data.IEEE Transactions on Visualization and Computer Graphics, 2025. to be published. doi: 10. 1109/TVCG.2025.3566558 5
2025
-
[2010]
doi: 10.1038/ng.695 3, 7
-
[2016]
doi: 10.1109/TVCG.2016.2598470 2
2016
-
[2018]
doi: 10.1177/1473871617713337 2
-
[2019]
doi: doi.org/10.1111/cgf.13727 2
-
[2021]
doi: 10.1109/TVCG.2021.3114876 2
2021
-
[2023]
doi: 10.1109/VIS54172.2023.00031 2
2023
-
[2025]
doi: 10.1109/tvcg.2024.3456387 7
2024
Reviewed August 6, 2026 · model on record in the stance chip above.
Discussion (0). Sign in to comment.