Using PyBioNetFit to Leverage Qualitative and Quantitative Data in Biological Model Parameterization and Uncertainty Quantification
Pith reviewed 2026-05-18 20:27 UTC · model grok-4.3
The pith
PyBioNetFit systematically incorporates qualitative observations as constraints alongside quantitative data to parameterize ODE models and quantify uncertainties.
A machine-rendered reading of the paper's core claim, the machinery that carries it, and where it could break.
Core claim
Starting from the same data and the same ordinary differential equation model structure as the earlier study, we generate formalized statements of qualitative observations, making these observations more reusable, and we improve the model parameterization procedure by applying a systematic and automated approach enabled by the software package PyBioNetFit. We also demonstrate uncertainty quantification, which was absent in the original study.
What carries the argument
PyBioNetFit, the software that automates model fitting by treating formalized qualitative observations as mathematical constraints to be satisfied jointly with quantitative data.
If this is right
- Model parameters are obtained through automated optimization rather than manual adjustment.
- Uncertainty in both estimated parameters and model predictions can be quantified directly.
- Qualitative data becomes reusable in explicit mathematical form for future analyses.
- Reproducibility of parameterization and model analyses increases for cellular regulatory systems.
Where Pith is reading between the lines
- The same formalization step could be applied to other signaling pathways where rank-order or presence/absence data is more available than precise measurements.
- Joint fitting of mixed data types may yield models with improved predictive accuracy for interventions such as targeted inhibitors.
- The workflow could be tested on stochastic or spatial extensions of the current ODE structure to assess robustness.
Load-bearing premise
Qualitative observations from the original experiments can be translated into accurate, reusable mathematical constraints without introducing inconsistencies or bias when combined with quantitative data during fitting.
What would settle it
An experiment showing that parameter values obtained under the formalized qualitative constraints violate one or more original qualitative observations or that the uncertainty intervals fail to cover independent validation measurements.
Figures


read the original abstract
Data generated in studies of cellular regulatory systems are often qualitative. For example, measurements of signaling readouts in the presence and absence of mutations may reveal a rank ordering of responses across conditions but not the precise extents of mutation-induced differences. Qualitative data are often ignored by mathematical modelers or are considered in an ad hoc manner, as in the study of Kocieniewski and Lipniacki (2013) [Phys Biol 10: 035006], which was focused on the roles of MEK isoforms in ERK activation. In this earlier study, model parameter values were tuned manually to obtain consistency with a combination of qualitative and quantitative data. This approach is not reproducible, nor does it provide insights into parametric or prediction uncertainties. Here, starting from the same data and the same ordinary differential equation (ODE) model structure, we generate formalized statements of qualitative observations, making these observations more reusable, and we improve the model parameterization procedure by applying a systematic and automated approach enabled by the software package PyBioNetFit. We also demonstrate uncertainty quantification (UQ), which was absent in the original study. Our results show that PyBioNetFit enables qualitative data to be leveraged, together with quantitative data, in parameterization of systems biology models and facilitates UQ. These capabilities are important for reliable estimation of model parameters and model analyses in studies of cellular regulatory systems and reproducibility.
Editorial analysis
A structured set of objections, weighed in public.
Referee Report
Summary. The manuscript applies PyBioNetFit to re-parameterize the ODE model of MEK isoforms in ERK activation from Kocieniewski and Lipniacki (2013). Starting from the same data and model structure, the authors formalize qualitative observations (rank orderings of responses under mutations) into mathematical constraints, combine them with quantitative data for automated fitting, and perform uncertainty quantification absent from the original manual tuning.
Significance. If the formalization step is robust and documented, the work provides a reproducible, systematic alternative to ad hoc manual tuning and demonstrates how mixed qualitative-quantitative data can be leveraged for parameterization and UQ in systems biology. This has practical value for improving reliability and reproducibility in cellular regulatory modeling.
major comments (1)
- The section describing generation of formalized statements of qualitative observations: the translation of rank orderings into inequalities on model outputs (steady-state or transients) is not accompanied by sensitivity analysis on choices such as which variables to constrain or inequality strictness. This is load-bearing because different formalizations alter the feasible parameter region and thus the reported UQ; without cross-validation against held-out qualitative observations or explicit documentation of the translation rules, the reproducibility advantage over the 2013 manual approach cannot be fully assessed.
minor comments (2)
- The abstract would be strengthened by reporting at least one concrete quantitative result, such as a change in parameter uncertainty ranges or fit residual metrics relative to the original study.
- All formalized qualitative constraints should be explicitly tabulated (with the exact inequalities and the model variables they apply to) to support the claim of reusability.
Simulated Author's Rebuttal
We thank the referee for their thoughtful review and for highlighting an important aspect of reproducibility in our approach. We address the major comment below and will revise the manuscript to strengthen documentation and analysis of the formalization process.
read point-by-point responses
-
Referee: The section describing generation of formalized statements of qualitative observations: the translation of rank orderings into inequalities on model outputs (steady-state or transients) is not accompanied by sensitivity analysis on choices such as which variables to constrain or inequality strictness. This is load-bearing because different formalizations alter the feasible parameter region and thus the reported UQ; without cross-validation against held-out qualitative observations or explicit documentation of the translation rules, the reproducibility advantage over the 2013 manual approach cannot be fully assessed.
Authors: We agree that explicit documentation of the translation rules and sensitivity analysis on formalization choices would improve the manuscript. In the revision we will add a dedicated subsection that lists each qualitative observation from Kocieniewski and Lipniacki (2013), states the exact inequality applied to the corresponding model output (including whether steady-state or transient values are used), and provides the rationale drawn directly from the original text. We will also include a sensitivity study that perturbs inequality strictness (e.g., replacing strict inequalities with relaxed thresholds differing by small epsilon values) and reports the resulting changes in the posterior parameter distributions and key UQ metrics. Because the study incorporates every qualitative observation reported in the 2013 paper, a true held-out cross-validation set is not available; we will therefore discuss this data limitation explicitly and note that the formalization rules are intended to be reusable for future studies that may permit such validation. revision: yes
Circularity Check
No significant circularity; parameterization uses external 2013 data and independent software
full rationale
The paper takes the ODE model structure and both quantitative and qualitative observations from the independent 2013 Kocieniewski & Lipniacki study, formalizes the qualitative observations into reusable constraints, and applies the external PyBioNetFit package to perform joint fitting and UQ. No step reduces by construction to a fitted parameter renamed as a prediction, a self-defined quantity, or a load-bearing self-citation chain; the central demonstration rests on the software's documented ability to handle mixed data types against an external benchmark model. The formalization step is presented as an explicit modeling choice rather than a derived result, and the reported outcomes (parameter estimates and uncertainty ranges) are generated from the combined inputs rather than presupposed by them.
Axiom & Free-Parameter Ledger
free parameters (1)
- kinetic parameters of the ODE model
axioms (1)
- domain assumption Qualitative experimental observations (e.g., rank orderings of responses across mutation conditions) can be translated into formal mathematical constraints suitable for automated optimization.
Lean theorems connected to this paper
-
IndisputableMonolith/Cost/FunctionalEquation.leanwashburn_uniqueness_aczel unclear?
unclearRelation between the paper passage and the cited Recognition theorem.
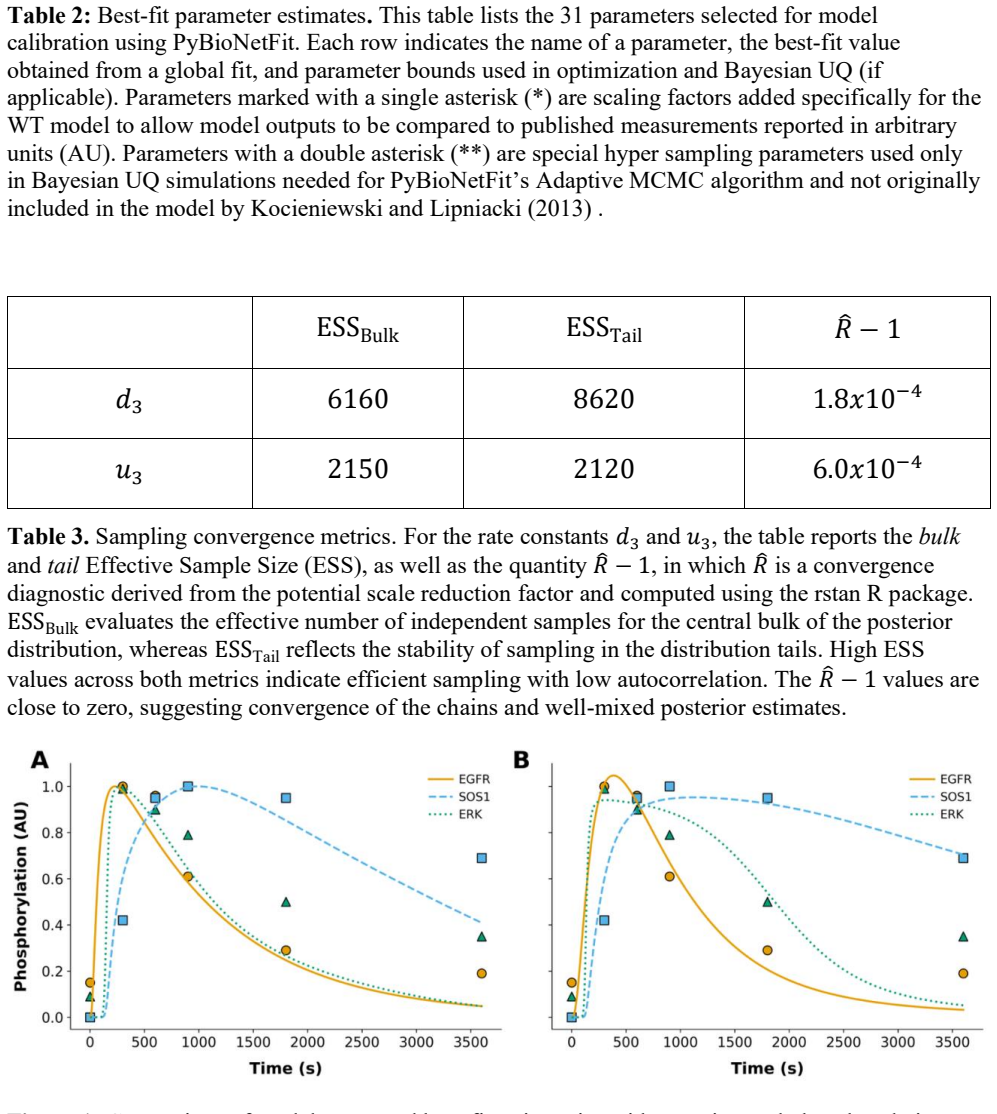
We generate formalized statements of qualitative observations... objective function F(θ) = Fqual(θ) + Fquant(θ)... profile likelihood... adaptive MCMC
What do these tags mean?
- matches
- The paper's claim is directly supported by a theorem in the formal canon.
- supports
- The theorem supports part of the paper's argument, but the paper may add assumptions or extra steps.
- extends
- The paper goes beyond the formal theorem; the theorem is a base layer rather than the whole result.
- uses
- The paper appears to rely on the theorem as machinery.
- contradicts
- The paper's claim conflicts with a theorem or certificate in the canon.
- unclear
- Pith found a possible connection, but the passage is too broad, indirect, or ambiguous to say the theorem truly supports the claim.
Reference graph
Works this paper leans on
-
[1]
Then, following the inference approach of Mitra et al
(Supplemental Tables 1–5). Then, following the inference approach of Mitra et al. (2018), which is elaborated above, we applied, in a single global optimization, a parallelized metaheuristic optimization method implemented in PyBioNetFit (Mitra et al., 2019) to find maximum likelihood estimates (MLEs) for 28 model parameters and 3 scaling factors that rel...
work page 2018
-
[2]
Mitra, E. D., Hlavacek, W. S. (2019). Parameter estimation and uncertainty quantification for systems biology models. Current Opinion in Systems Biology, 18, 9–18
work page 2019
-
[3]
C., Csikasz-Nagy, A., Gyorffy, B., Val, J., Novak, B., Tyson, J
Chen, K. C., Csikasz-Nagy, A., Gyorffy, B., Val, J., Novak, B., Tyson, J. J. (2000). Kinetic analysis of a molecular model of the budding yeast cell cycle. Molecular Biology of the Cell, 11, 369–391
work page 2000
-
[4]
C., Calzone, L., Csikasz-Nagy, A., Cross, F
Chen, K. C., Calzone, L., Csikasz-Nagy, A., Cross, F. R., Novak, B., Tyson, J. J. (2004). Integrative analysis of cell cycle control in budding yeast. Molecular Biology of the Cell, 15, 3841–3862
work page 2004
-
[5]
C., Laomettachit, T., Murali, T
Kraikivski, P., Chen, K. C., Laomettachit, T., Murali, T. M., Tyson, J. J. (2015). From START to FINISH: computational analysis of cell cycle control in budding yeast. NPJ Systems Biology and Applications, 1, 1–9
work page 2015
-
[6]
Barik, D., Ball, D. A., Peccoud, J., Tyson, J. J. (2016) A stochastic model of the yeast cell cycle reveals roles for feedback regulation in limiting cellular variability. PLoS Computational Biology, 12, e1005230
work page 2016
-
[7]
J., Laomettachit, T., Kraikivski, P
Tyson, J. J., Laomettachit, T., Kraikivski, P. (2019). Modeling the dynamic behavior of biochemical regulatory networks. Journal of Theoretical Biology, 462, 514–527
work page 2019
-
[8]
Kinney, J. B., Tkacik, G., Callan, C. G. (2007). Precise physical models of protein-DNA interaction from high-throughput data. Proceedings of the National Academy of Sciences USA, 104, 501–506
work page 2007
-
[9]
Kinney, J. B., Murugan, A., Gallan, C. G., Jr., Cox, E. C. (2010). Using deep sequencing to characterize the biophysical mechanism of a transcriptional regulatory sequence. Proceedings of the National Academy of Sciences USA, 107, 9158–9163
work page 2010
-
[10]
Atwal, G. S., Kinney, J. B. (2016). Learning quantitative sequence–function relationships from massively parallel experiments. Journal of Statistical Physics, 162, 1203–1243
work page 2016
-
[11]
Kinney, J. B., McCandlish, D. M. (2019). Massively parallel assays and quantitative sequence-function relationships. Annual Review of Genomics and Human Genetics, 20, 99– 127. 12
work page 2019
-
[12]
Toni, T., Jovanovic, G., Huvet, M., Buck, M., Stumpf, M. P. H. (2011). From qualitative data to quantitative models: analysis of the phage shock protein stress response in Escherichia coli. BMC Systems Biology, 5, 69
work page 2011
-
[13]
Pargett, M., Umulis, D. M. (2013). Quantitative model analysis with diverse biological data: applications in developmental pattern formation. Methods, 62, 56–67
work page 2013
-
[14]
Pargett, M., Rundell, A. E., Buzzard, G. T., Umulis, D. M. (2014). Model-based analysis for qualitative data: an application in Drosophila germline stem cell regulation. PLOS Computational Biology, 10, e1003498
work page 2014
-
[15]
Schmiester, L., Weindl, D., Hasenauer, J. (2020). Parameterization of mechanistic models from qualitative data using an efficient optimal scaling approach. Journal of Mathematical Biology, 81, 603–623
work page 2020
-
[16]
Schmiester, L., Weindl, D., Hasenauer, J. (2021). Efficient gradient-based parameter estimation for dynamic models using qualitative data. Bioinformatics, 37, 4493–4500
work page 2021
-
[17]
Dorešić, D., Grein, S., Hasenauer, J. (2024). Efficient parameter estimation for ODE models of cellular processes using semi-quantitative data. Bioinformatics, 40, i558–i566 (btae210)
work page 2024
-
[18]
Oguz, C., Laomettachit, T., Chen, K. C., Watson, L. T., Baumann, W. T., Tyson, J. J. (2013). Optimization and model reduction in the high dimensional parameter space of a budding yeast cell cycle model. BMC Systems Biology, 7, 1–17
work page 2013
-
[19]
Mitra, E. D., Dias, R., Posner, R. G., Hlavacek, W. S. (2018). Using both qualitative and quantitative data in parameter identification for systems biology models. Nature Communications, 9, 3901
work page 2018
-
[20]
Mitra, E. D., Hlavacek, W. S. (2020). Bayesian inference using qualitative observations of underlying continuous variables. Bioinformatics, 36, 3177–3184
work page 2020
-
[21]
D., Suderman, R., Colvin, J., Ionkov, A., Hu, A., Sauro, H
Mitra, E. D., Suderman, R., Colvin, J., Ionkov, A., Hu, A., Sauro, H. M., Posner, R. G., Hlavacek, W. S. (2019). PyBioNetFit and the Biological Property Specification Language. iScience, 19, 1012–1036
work page 2019
-
[22]
Schälte, Y., Fröhlich, F., Jost, P. J., Vanhoefer, J., Pathirana, D., Stapor, P., Lakrisenko, P., Wang, D., Raimúndez, E., Merkt, S., Schmiester, L., Städter, P., Grein, S., Dudkin, E., Dorešić, D., Weindl, D., Hasenauer, J. (2023). pyPESTO: A modular and scalable tool for parameter estimation for dynamic models. Bioinformatics, 39, btad711
work page 2023
-
[23]
Kocieniewski, P., Lipniacki, T. (2013). MEK1 and MEK2 differentially control the duration and amplitude of the ERK cascade response. Physical Biology, 10, 035006
work page 2013
-
[24]
Catalanotti, F., Reyes, G., Jesenberger, V., Galabova-Kovacs, G., de Matos Simoes, R., Carugo, O., Baccarini, M. (2009). A Mek1–Mek2 heterodimer determines the strength and duration of the Erk signal. Nature Structural & Molecular Biology, 16, 294–303
work page 2009
-
[25]
Kamioka, Y., Yasuda, S., Fujita, Y., Aoki, K., Matsuda, M. (2010). Multiple decisive phosphorylation sites for the negative feedback regulation of SOS1 via ERK. Journal of Biological Chemistry, 285, 33540–33548
work page 2010
-
[26]
Kreutz, C., Raue, A., Kaschek, D., Timmer, J. (2013). Profile likelihood in systems biology. FEBS Journal, 280, 2564–2571
work page 2013
-
[27]
Andrieu, C. and Thoms, J. (2008). A tutorial on adaptive MCMC. Statistics and computing, 18, 343–373
work page 2008
-
[28]
Neumann, J., Lin, Y. T., Mallela, A., Miller, E. F., Colvin, J., Duprat, A. T., Chen, Y., Hlavacek, W. S., Posner, R. G. (2022). Implementation of a practical Markov chain Monte Carlo sampling algorithm in PyBioNetFit. Bioinformatics, 38, 1770–1772
work page 2022
-
[29]
Faeder, J. R., Blinov, M. L., Hlavacek, W. S. (2009). Rule-based modeling of biochemical systems with BioNetGen. Methods in Molecular Biology, 500, 113–167. 13
work page 2009
-
[30]
M., Waltemath, D., König, M., Zhang, F., Dräger, A., Chaouiya, C., Bergmann, F
Keating, S. M., Waltemath, D., König, M., Zhang, F., Dräger, A., Chaouiya, C., Bergmann, F. T., Finney, A., Gillespie, C. S., Helikar, T., Hoops, S., Malik-Sheriff, R. S., Moodie, S. L., Moraru, I. I., Myers, C. J., Naldi, A., Olivier, B. G., Sahle, S., Schaff, J. C., Smith, L. P., Swat, M. J., Thieffry, D., Watanabe, L., Wilkinson, D. J., Blinov, M. L., ...
work page 2020
-
[31]
Harris, L. A., Hogg, J. S., Tapia, J.J., Sekar, J. A. P., Gupta, S., Korsunsky, I., Arora, A., Barua, D., Sheehan, R. P., Faeder, J. R. (2016). BioNetGen 2.2: advances in rule-based modeling. Bioinformatics, 32, 3366–3368
work page 2016
-
[32]
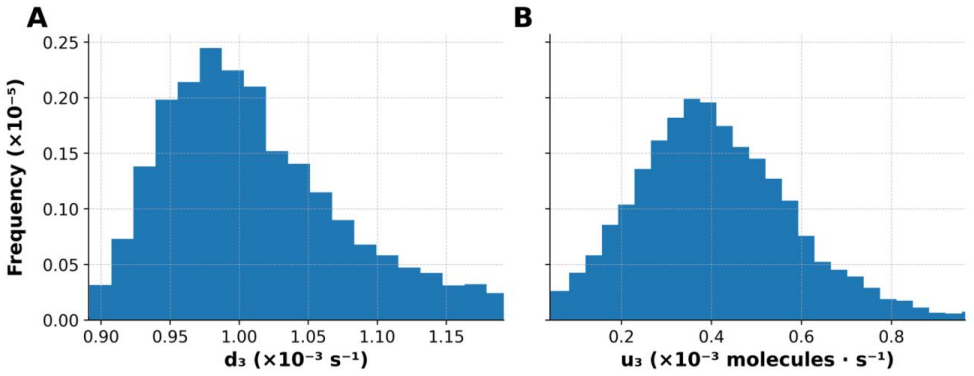
Vehtari, A., Gelman, A., Simpson, D., Carpenter, B., Bürkner, P. C. (2021). Rank- normalization, folding, and localization: an improved 𝑅̂ for assessing convergence of MCMC (with discussion). Bayesian Analysis, 16, 667–718. 9 Tables Parameter Original Parameter Value Parameter Description c1L 2.0x10⁻² c1 value after stimulation with ligand c2 2.0x10⁻⁷ EGF...
work page 2021
discussion (0)
Sign in with ORCID, Apple, or X to comment. Anyone can read and Pith papers without signing in.