REVIEW 3 major objections 6 minor 1 cited by
Rewarding Engagement and Personalization in Popularity-Based Rankings Amplifies Extremism and Polarization
T0 review · 3 major / 6 minor · reviewed 2026-08-15 · deepseek-v4-flash
Pith's one-line read Rewarding active engagement and personalizing popularity rankings amplifies consumption extremism and polarization, via a feedback loop the paper models and tests with human participants.
desk verdict A genuinely new human-in-the-loop experiment supports a plausible mechanism, but the click-level tests overstate significance because clicks within a run are not independent. read the letter →
The pith
A machine-rendered reading of the paper's core claim, the machinery that carries it, and where it could break.
The reading
What carries the argument
The carrying object is the group-specific popularity score $p^g_n(t)$ updated by the rule in Eq. (5): a click from a user in group $g$ adds 1 to item $n$'s popularity in that group, or $1+\eta$ if the item was highlighted, while clicks from users outside $g$ contribute only $(1-\lambda)$ as much. The ranking shown to group $g$ orders items by $p^g_n$, so $\lambda$ is the personalization dial (how little other groups' behavior matters) and $\eta$ is the active-engagement reward. Click probabilities are the product of a position-bias factor $R(r_n)=\beta^{N-r_n}$ and a stance-conditioned click matrix $C_{s_n,s_u}$, normalized over the list. What this machinery does is convert individual behavioral tendencies into a visibility feedback loop: engagement-weighted, group-specific popularity makes extreme, like-minded content rise for the users most likely to click it.
What would settle it
Collect the dynamic-condition data and test whether the observed click and highlight rates by rank and stance still match the static estimates: if a goodness-of-fit test rejects the model's predicted stationary click distribution under ($\lambda=1,\eta=100$), or if a replication of Experiment 2 fails to find higher extremism and polarization in the personalized engagement-reward condition than in the click-only condition, the central claim is falsified.
Extended reading notes
Core claim
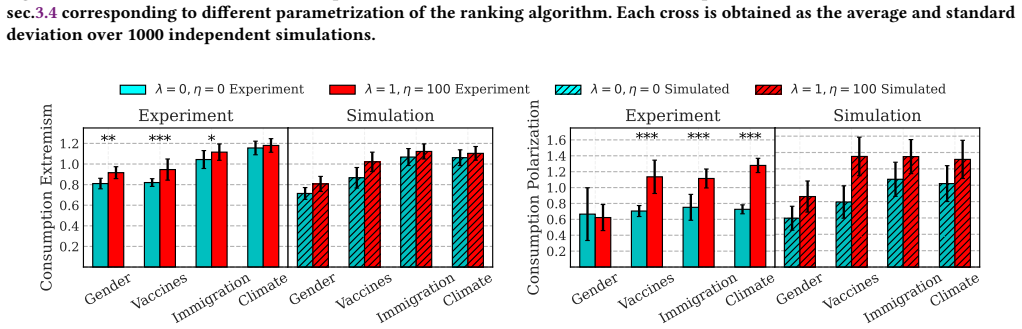
The paper's central claim is that a specific feedback loop, not user preferences alone, drives consumption toward extremism and polarization. It starts from four empirical regularities: users click items higher in a ranking more often; users prefer news aligned with their own stance; users at the ideological extremes engage (like/share) more than moderates; and platforms rank by popularity. The paper formalizes the loop with a discrete-time model in which each user group (left, center, right) maintains its own popularity score per news item; the personalization parameter $\lambda$ controls how much a group's ranking ignores other groups' clicks, and $\eta$ multiplies the popularity boost of highlighted items. Simulations on parameters estimated from a static ranking experiment with 432 participants predict that both metrics rise monotonically with $\lambda$ and $\eta$. A dynamic ranking experiment with 1,534 participants then compares click-based, non-personalized rankings ($\lambda=0,\eta=0$) with personalized rankings that strongly reward highlights ($\lambda=1,\eta=100$). Clicks on extreme same-stance content rose by about 20% and same-stance clicks by 13%, with significant increases in consumption extremism for three of four topics and polarization for three of four, matching the simulated direction.
Load-bearing premise
The click and highlight probabilities estimated from a static, randomized ranking are assumed to remain valid when rankings become personalized and engagement-weighted; if users' response to rank or content changes under the dynamic condition, the mechanism the model describes is not necessarily the one that produced the experimental outcomes.
Editorial extensions
If this is right
- Every increase in personalization ($\lambda$) or active-engagement reward ($\eta$) in the simulated model raises consumption extremism and polarization, with personalization the stronger driver of polarization.
- In the human dynamic experiment, the personalized, engagement-rewarding ranking increased consumption extremism in all four topics (significant except Climate Change) and polarization in all but Gender, with clicks on extreme same-stance content up about 20% and same-stance clicks up 13%.
- Under the engagement-rewarding personalized condition, centrist items are demoted while same-stance extreme items rise, so exposure diversity shrinks even for users whose own preferences did not change.
- Because the two experimental conditions differ only in the ranking algorithm's parameters, the consumption shift is attributable to algorithmic design rather than to a change in user preferences.
- The mechanism offers a possible explanation for engagement-driven changes on real platforms, such as Facebook's 2018 update weighting 'meaningful social interactions' more heavily.
Reading between the lines
- The paper's evidence is about consumption; the paper explicitly stops short of claiming durable attitude change or radicalization, so the natural next test is whether exposure shifts of this size move beliefs over longer horizons.
- If the mechanism is right, an A/B test that lowers $\eta$ or $\lambda$ on a real feed should measurably reduce extreme-content consumption without any change in user beliefs — a testable design intervention the paper does not run.
- The model predicts weaker amplification on platforms or topics where extreme users are not the most active; comparing the same ranking algorithm across such contexts could separate the engagement-profile assumption from the algorithm parameters.
- Because $\lambda=1$ creates three parallel popularity contests, a natural extension is to ask whether even a small amount of cross-group mixing ($0<\lambda<1$) breaks the loop; the paper's monotone simulations suggest it does not, but this was not tested experimentally.
Signed reviews
Editorial analysis
A structured set of objections, weighed in public.
Referee Report
Summary. This paper proposes and tests a mechanism by which popularity-based ranking algorithms amplify political extremism and polarization when they reward active engagement and personalize results. The authors specify a dynamical model in which users with a five-point political stance click on ranked news items with position-biased, stance-conditional probabilities, and sometimes 'highlight' items with a probability that depends on both stances; item popularities are updated per stance group via Eq. (5) with parameters λ (personalization) and η (active-engagement reward). The model inputs (user stance distribution, β, C, H) are estimated by maximum likelihood from a static ranking experiment with 432 participants. Simulations across a grid of (λ, η) predict that both consumption extremism and polarization increase with λ and η. A dynamic experiment with 1,534 participants compares the corner conditions (λ=0, η=0) and (λ=1, η=100), reporting increases in extremism and polarization under the personalized, engagement-rewarding condition, and the paper concludes with claims of statistical significance and of a 'causal link' between algorithmic design and amplification.
Significance. If the statistical concerns below are addressed, this is a useful contribution: it provides a transparent, minimal model of user–algorithm feedback whose parameters are estimated from human data and whose qualitative predictions are validated in an independent human-in-the-loop experiment. The calibrated-then-confirmed design is a genuine strength, as is the honest Limitations section, which concedes that only the two corner configurations were tested, that the simulations are not designed for quantitative predictions, and that the outcome measures concern consumption rather than attitude change. The paper's headline claims — 'inevitably driven' in the Abstract and the 'causal link' statement in Section 5 — currently exceed what the evidence supports, mainly because the reported significance rests on a click-level analysis that inflates the effective sample size. With a run-level re-analysis and appropriately hedged wording, the qualitative finding is credible and relevant to debates about platform design and regulation.
major comments (3)
- [§3.5, Fig. 6; §4.3; §5] The unit-of-analysis concern raised in review is confirmed by the text of §3.5. The one-tailed Mann–Whitney U tests reported in Fig. 6 are applied 'considering each individual click,' but clicks within a single run are not independent: Eq. (5) updates group-specific popularities after every interaction, so each run is one trajectory of a shared ranking, and there are only 3 runs per topic-condition. Treating roughly 600 clicks as independent observations overstates the effective replication by about two orders of magnitude. With n1 = n2 = 3 runs, the smallest achievable one-tailed Mann–Whitney p is 0.05, so the reported per-topic p < 0.001 values cannot be obtained from any valid run-level test. The chi-square tests in Fig. 7 have the same nesting problem, and the 20%/13% effect sizes stated in §4.3.2 and §5 inherit it. I ask the authors to re-analyze at the run level (e.g., exact permutation tests on the 3 vs. 3 runs per topic, mixed models with run as a random effect, or a null distribution generated by simulating the ranking dynamics), and to restate the significance claims in Sections 4.3 and 5 accordingly.
- [§3.5 and Appendix D] The measurement window is inconsistent with the paper's own convergence analysis. Appendix D states that steady state is reached 'between 200 and 300 interactions,' yet the dynamic experiment has about 253 interactions per run, discards only the first 50 periods, and computes metrics over a window of size w = 200 — i.e., roughly clicks 53–253, most of which lie in the transient regime identified by the authors. The claim in §3.1.3 that metrics are computed 'when the probability distribution in Eq. (4) is approximately stationary' is therefore not satisfied, and the reported effect magnitudes are averages over non-stationary trajectories. Averaging over the transient will attenuate rather than inflate the between-condition differences, so this may not invalidate the qualitative direction, but it does undermine the quantitative claims. Please report a sensitivity analysis using only interactions after the convergence time identified in Fig. D5, and reconcile the design description in §3.5 with Appendix D.
- [Abstract, §4.2, Fig. 4, Limitations] The claims that the mechanism makes amplification 'inevitable' (Abstract) and that 'any increase in personalization or highlight reward can produce a shift' (§4.2) go beyond what is tested. Experimentally, only the two extreme corners (λ=0, η=0) and (λ=1, η=100) are compared — a limitation the authors explicitly acknowledge in the Limitations section. The monotonic grid in Fig. 4 is reported as cell means over 1,000 simulations without error bars or statistical comparison between adjacent cells, so the 'any increase' claim is not quantified, and the simulation is a projection of the fitted parameters (β, C, H) and the update rule rather than an independent derivation. I recommend adding uncertainty quantification to Fig. 4, softening 'inevitably' and 'any increase' to claims that match the two-corner experiment plus simulation, and stating explicitly in the Conclusions which parts of the claim rest on experiment and which rest on simulation.
minor comments (6)
- [§3.5] The assignment of participants to the two parameterizations, and to the three repetitions within each topic-condition, is not described; please state the randomization procedure and confirm that the two conditions were balanced on participant characteristics.
- [Fig. 4 caption] The caption calls the increases 'small,' but the η axis runs from at most 1.0 to 100.0 in logarithmic scale, so the smallest displayed reward is a doubling of popularity for a highlight; clarify whether η=0 is included in the grid (a log axis cannot display zero) and re-word 'small increases' accordingly.
- [§4.1, Fig. 3(d)] The text states that the U-shaped engagement pattern is 'statistically significant' without reporting a test; please provide the test used and its p-value.
- [§4.3.1] 'The simulations reproduce the main experimental effects with surprising accuracy' is a visual judgment; please report a quantitative agreement measure (e.g., mean absolute deviation between simulated and experimental metric values per topic-condition).
- [Reference list, Appendix F] Reference [7] contains a corrupted author name ('Michaundefined'), and Appendix F contains a typo ('finaly'); both should be corrected.
- [Table 1 and §3.1] Table 1 lists only D_stu as estimated from data, but the text of §3.1 states that the news-stance distribution D_sn is uniform by assumption; please make this asymmetry explicit in the table or its footnote for clarity.
Circularity Check
No significant circularity: the dynamic-ranking experiment is an independent out-of-sample benchmark, while the simulation is a projection of behavior fitted in the static experiment rather than a circular validation.
full rationale
The paper's derivation chain is not circular in the sense prohibited here. Behavioral parameters (D_su, beta, C_sn_su, H_sn_su) are estimated from the static ranking experiment (Section 3.3) and then used to simulate the dynamical model (Section 3.4). The simulations are indeed mathematical consequences of those fitted parameters and the assumed feedback rule in Eq. (5), so the simulated amplification is a projection of the measured static behavior rather than a parameter-free derivation. However, the paper does not rest its empirical claim on the simulation alone: Experiment 2 (Section 3.5, Section 4.3) is a separate dynamic-ranking experiment with 1,534 human participants and 24 independent runs that was not used to fit any model parameter. Comparing the simulated outcomes with this experiment is a genuine out-of-sample check, and the paper explicitly tempers its claim: 'Although our simulations are not designed for quantitative predictions, they reproduce the qualitative patterns observed in the experiment well.' The self-citations to [20,21,22,23,48] appear in related-work and discussion contexts and are not load-bearing for the mechanism or for excluding alternative explanations; no uniqueness theorem or ansatz is imported from the authors' prior work. The main methodological weakness is statistical rather than circular: the one-tailed Mann-Whitney tests 'considering each individual click' (Section 3.5) ignore the fact that clicks within a run share a dynamically updated ranking, so the effective replication is 3 runs per topic-condition rather than hundreds of clicks. This is a validity concern about p-values, not a circularity of the derivation, and it does not raise the circularity score. Overall, the central empirical result is an independent experimental benchmark, so the paper is self-contained against external data and merits a low circularity score.
Assumptions & free parameters
free parameters (6)
- beta (position bias strength) =
1.09 plus/minus 0.01 overall; per-topic values in Fig. E8
- C(s_n, s_u), stance-conditioned click probabilities =
5x5 matrices per topic, shown in Fig. E9
- H(s_n, s_u), highlight probabilities after click =
5x5 matrices per topic, shown in Fig. E10
- D_su, user stance distribution =
Empirical distribution over the 5 stances, Fig. E7
- eta (active engagement relevance) =
0 or 100 in experiments; grid from 0.1 to 100 in Fig. 4
- lambda (personalization degree) =
0 or 1 in experiments; grid from 0 to 1 in Fig. 4
assumptions (6)
- domain assumption Position bias: users prefer items displayed higher in the ranking (H1, Eq. 2).
- domain assumption Like-minded preference: users are more likely to click content aligned with their own stance (H2, Eq. 3).
- domain assumption U-shaped engagement: users with more extreme views are more likely to actively engage (H3).
- domain assumption User stances are fixed during the interaction and drawn from D_su.
- domain assumption Ranking is popularity-based: items with higher popularity are displayed higher.
- domain assumption News stance labels from Ground.news are accurate enough for stance-specific analysis.
Cite this review
Pith. "Pith review of Rewarding Engagement and Personalization in Popularity-Based Rankings Amplifies Extremism and Polarization." pith.science (2026). https://pith.science/paper/6XF5UTY2
@misc{pith2026251024354,
  author       = {Pith},
  title        = {Pith review of: Rewarding Engagement and Personalization in Popularity-Based Rankings Amplifies Extremism and Polarization},
  year         = {2026},
  howpublished = {\url{https://pith.science/paper/6XF5UTY2}},
  note         = {Machine review of arXiv:2510.24354}
}
read the original abstract
Despite extensive research, the mechanisms through which online platforms shape extremism and polarization remain poorly understood. We identify and test a mechanism, grounded in empirical evidence, that explains how ranking algorithms can amplify both phenomena. This mechanism is based on well-documented assumptions: (i) users exhibit position bias and tend to prefer items displayed higher in the ranking, (ii) users prefer like-minded content, (iii) users with more extreme views are more likely to engage actively, and (iv) ranking algorithms are popularity-based, assigning higher positions to items that attract more clicks. Under these conditions, when platforms additionally reward \emph{active} engagement and implement \emph{personalized} rankings, users are inevitably driven toward more extremist and polarized news consumption. We formalize this mechanism in a dynamical model, which we evaluate by means of simulations and interactive experiments with hundreds of human participants, where the rankings are updated dynamically in response to user activity.
Figures


Figures from the paper (4 more)



Forward citations
Cited by 1 Pith paper
-
Stable Sentiment and Persistent Dynamics in U.S. Economic News over 45 Years
U.S. economic news sentiment has shifted from a reactive to a persistent process over 45 years, with longer residence times in optimistic or pessimistic regimes.
Reference graph
Works this paper leans on
-
[1]
Daron Acemoglu, Asuman Ozdaglar, and James Siderius. 2024. A model of online misinformation.Review of Economic Studies91, 6 (2024), 3117–3150
work page 2024
-
[2]
Hunt Allcott, Matthew Gentzkow, Winter Mason, Arjun Wilkins, Pablo Barberá, Taylor Brown, Juan Carlos Cisneros, Adriana Crespo-Tenorio, Drew Dimmery, Deen Freelon, et al. 2024. The effects of Facebook and Instagram on the 2020 election: A deactivation experiment.Proceedings of the National Academy of Sciences121, 21 (2024), e2321584121
work page 2024
-
[3]
Chhandak Bagchi, Filippo Menczer, Jennifer Lundquist, Monideepa Tarafdar, Anthony Paik, and Przemyslaw A Grabowicz. 2024. Social media algorithms can curb misinformation, but do they?arXiv preprint arXiv:2409.18393(2024)
work page Pith review arXiv 2024
-
[4]
Christopher A Bail, Lisa P Argyle, Taylor W Brown, John P Bumpus, Haohan Chen, MB Fallin Hunzaker, Jaemin Lee, Marcus Mann, Friedolin Merhout, and Alexander Volfovsky. 2018. Exposure to opposing views on social media can increase political polarization.Proceedings of the National Academy of Sciences 115, 37 (2018), 9216–9221
work page 2018
-
[5]
Joseph B Bak-Coleman, Mark Alfano, Wolfram Barfuss, Carl T Bergstrom, Miguel A Centeno, Iain D Couzin, Jonathan F Donges, Mirta Galesic, Andrew S Gersick, Jennifer Jacquet, et al. 2021. Stewardship of global collective behavior. Proceedings of the National Academy of Sciences118, 27 (2021), e2025764118
work page 2021
-
[6]
Eytan Bakshy, Solomon Messing, and Lada A Adamic. 2015. Exposure to ideologi- cally diverse news and opinion on Facebook.Science348, 6239 (2015), 1130–1132
2015
-
[7]
Leonhard Balduf, Saidu Sokoto, Onur Ascigil, Gareth Tyson, Björn Scheuermann, Maciej Korczyński, Ignacio Castro, and Michaundefined Król. 2024. Looking AT the Blue Skies of Bluesky. InProceedings of the 2024 ACM on Internet Measurement Conference(Madrid, Spain)(IMC ’24). Association for Computing Machinery, New York, NY, USA, 76–91
work page 2024
-
[8]
Saumya Bhadani, Shun Yamaya, Alessandro Flammini, Filippo Menczer, Gio- vanni Luca Ciampaglia, and Brendan Nyhan. 2022. Political audience diversity and news reliability in algorithmic ranking.Nature Human Behaviour6, 4 (2022), 495–505
work page 2022
Show all 58 references
-
[9]
2019.Are filter bubbles real?Polity Press, Cambridge
Axel Bruns. 2019.Are filter bubbles real?Polity Press, Cambridge
2019
-
[10]
Lucy H Butler, Padraig Lamont, Dean Law Yim Wan, Toby Prike, Mehwish Nasim, Bradley Walker, Nicolas Fay, and Ullrich KH Ecker. 2024. The (mis) information game: A social media simulator.Behavior Research Methods56, 3 (2024), 2376– 2397
2024
-
[11]
David Chavalarias, Paul Bouchaud, and Maziyar Panahi. 2023. Can Few Lines of Code Change Society? Beyond fack-checking and moderation: how recommender systems toxifies social networking sites.arXiv preprint arXiv:2303.15035(2023)
2023
-
[12]
Jerry Chee, Shankar Kalyanaraman, Sindhu Kiranmai Ernala, Udi Weinsberg, Sarah Dean, and Stratis Ioannidis. 2024. Harm Mitigation in Recommender Systems under User Preference Dynamics. InProceedings of the 30th ACM SIGKDD Conference on Knowledge Discovery and Data Mining. 255–265
2024
-
[13]
Aidan Combs, Graham Tierney, Brian Guay, Friedolin Merhout, Christopher A Bail, D Sunshine Hillygus, and Alexander Volfovsky. 2023. Reducing political polarization in the United States with a mobile chat platform.Nature human behaviour7, 9 (2023), 1454–1461
2023
-
[14]
Giovanni De Toni, Erasmo Purificato, Emilia Gomez, Andrea Passerini, Bruno Lepri, and Cristian Consonni. 2025. You Don’t Bring Me Flowers: Mitigating Unwanted Recommendations Through Conformal Risk Control. InProceedings of the Nineteenth ACM Conference on Recommender Systems ...
2025
-
[15]
Dominic DiFranzo, Samuel Hardman Taylor, Franccesca Kazerooni, Olivia D Wherry, and Natalya N Bazarova. 2018. Upstanding by design: Bystander inter- vention in cyberbullying. InProceedings of the 2018 CHI conference on human factors in computing systems. 1–12
2018
-
[16]
Robertson
Robert Epstein and Ronald E. Robertson. 2015. The search engine manipulation effect (SEME) and its possible impact on the outcomes of elections.Proceedings of the National Academy of Sciences112, 33 (2015), E4512–E4521
2015
-
[17]
Francesco Fabbri, Yanhao Wang, Francesco Bonchi, Carlos Castillo, and Michael Mathioudakis. 2022. Rewiring what-to-watch-next recommendations to reduce radicalization pathways. InProceedings of the ACM Web Conference 2022. 2719– 2728
2022
-
[18]
Eli J Finkel, Christopher A Bail, Mina Cikara, Peter H Ditto, Shanto Iyengar, Samara Klar, Lilliana Mason, Mary C McGrath, Brendan Nyhan, David G Rand, et al. 2020. Political sectarianism in America.Science370, 6516 (2020), 533–536
2020
-
[19]
Seth Flaxman, Sharad Goel, and Justin M Rao. 2016. Filter bubbles, echo chambers, and online news consumption.Public opinion quarterly80, S1 (2016), 298–320
2016
-
[20]
Emma Fraxanet, Andreas Kaltenbrunner, Fabrizio Germano, and Vicenç Gómez
-
[21]
Fabrizio Germano, Vicenç Gómez, and Gaël Le Mens. 2019. The few-get-richer: a surprising consequence of popularity-based rankings. InThe World Wide Web Conference. 2764–2770
2019
-
[22]
Fabrizio Germano, Vicenç Gómez, and Francesco Sobbrio. 2025. Ranking for Engagement: How Social Media Algorithms Fuel Misinformation and Polarization. CESifo Working Paper10011 (2025). Available at SSRN: https://ssrn.com/abstract= 4257210 or http://dx.doi.org/10.2139/ssrn.4257210
2025 doi
-
[23]
Fabrizio Germano and Francesco Sobbrio. 2020. Opinion dynamics via search engines (and other algorithmic gatekeepers).Journal of Public Economics187 (2020), 104188
2020
-
[24]
Sandra González-Bailón, David Lazer, Pablo Barberá, Meiqing Zhang, Hunt All- cott, Taylor Brown, Adriana Crespo-Tenorio, Deen Freelon, Matthew Gentzkow, Andrew M Guess, et al. 2023. Asymmetric ideological segregation in exposure to political news on Facebook.Science381, 6656 (...
2023
-
[25]
2016.Ideological segregation among online collaborators: evidence from Wikipedians
Shane Greenstein, Yuan Gu, and Feng Zhu. 2016.Ideological segregation among online collaborators: evidence from Wikipedians. Technical Report. National Bureau of Economic Research
2016
-
[26]
Andrew M Guess, Neil Malhotra, Jennifer Pan, Pablo Barberá, Hunt Allcott, Taylor Brown, Adriana Crespo-Tenorio, Drew Dimmery, Deen Freelon, Matthew Gentzkow, et al. 2023. How do social media feed algorithms affect attitudes and behavior in an election campaign?Science381, 6656...
2023
-
[27]
Andrew M Guess, Neil Malhotra, Jennifer Pan, Pablo Barberá, Hunt Allcott, Taylor Brown, Adriana Crespo-Tenorio, Drew Dimmery, Deen Freelon, Matthew Gentzkow, et al. 2023. Reshares on social media amplify political news but do not detectably affect beliefs or opinions.Science38...
2023
-
[28]
Keach Hagey and Jeff Horwitz. 2021. Facebook Tried to Make Its Platform a Healthier Place. It Got Angrier Instead.The Wall Street Journal(2021). https: //www.wsj.com/articles/facebook-algorithm-change-zuckerberg-11631654215
2021
-
[29]
Chin-Chia Hsu, Amir Ajorlou, and Ali Jadbabaie. 2025. A game-theoretic model of misinformation spread on social networks.Games and Economic Behavior (2025)
2025
-
[30]
Ferenc Huszar, Sofia Ira Ktena, Conor O’Brien, Luca Belli, Andrew Schlaikjer, and Moritz Hardt. 2022. Algorithmic amplification of politics on Twitter.Proceedings of the National Academy of Sciences119, 1 (2022), e2025334119
2022
-
[31]
2023.User Reputation Indicators to Reduce the Spread of False News on Social Media
Arvin Jagayat. 2023.User Reputation Indicators to Reduce the Spread of False News on Social Media. Ph. D. Dissertation. Toronto Metropolitan University
2023
-
[32]
Thorsten Joachims, Laura Granka, Bing Pan, Helene Hembrooke, and Geri Gay
-
[33]
Elizaveta Konovalova and Gaël Le Mens. 2023. Opinion homogenization and polarization.Sampling in Judgment and Decision Making(2023), 436–464
2023
-
[34]
Elizaveta Konovalova, Gaël Le Mens, and Nikolas Schöll. 2023. Social media feedback and extreme opinion expression.Plos one18, 11 (2023), e0293805
2023
-
[35]
Gaël Le Mens, Balázs Kovács, Judith Avrahami, and Yaakov Kareev. 2018. How endogenous crowd formation undermines the wisdom of the crowd in online ratings.Psychological science29, 9 (2018), 1475–1490
2018
-
[36]
Byunghwee Lee, Hyo-sun Ryu, Jae Kook Lee, Hawoong Jeong, and Beom Jun Kim. 2025. Network analysis reveals news press landscape and asymmetric user polarization.Physica A: Statistical Mechanics and its Applications(2025), 130842
2025
-
[37]
Hongzun Liu, Kang Yin, Tianyu Sun, Rui Huang, Yunsong Li, Xiao Fang, Zhaojie Liu, Weidong Liu, and Guorui Zhou. 2024. De-Anchor: Mitigating Attention Polarization for Lifelong User Behavior Modeling in Click-Through Rate Predic- tion. InCompanion Proceedings of the ACM Web Con...
2024
-
[38]
Ping Liu, Karthik Shivaram, Aron Culotta, Matthew A Shapiro, and Mustafa Bilgic. 2021. The interaction between political typology and filter bubbles in news recommendation algorithms. InProceedings of the web conference 2021. 3791–3801
2021
-
[39]
Philipp Lorenz-Spreen, Lisa Oswald, Stephan Lewandowsky, and Ralph Hertwig
-
[40]
Masoud Mansoury, Himan Abdollahpouri, Mykola Pechenizkiy, Bamshad Mobasher, and Robin Burke. 2020. Feedback loop and bias amplification in recommender systems. InProceedings of the 29th ACM international conference on information & knowledge management. 2145–2148
2020
-
[41]
Brendan Nyhan, Jaime Settle, Emily Thorson, Magdalena Wojcieszak, Pablo Barberá, Annie Y Chen, Hunt Allcott, Taylor Brown, Adriana Crespo-Tenorio, Drew Dimmery, et al. 2023. Like-minded sources on Facebook are prevalent but not polarizing.Nature(2023), 1–8
2023
-
[42]
Jinghua Piao, Jiazhen Liu, Fang Zhang, Jun Su, and Yong Li. 2023. Human–AI adaptive dynamics drives the emergence of information cocoons.Nature Machine Intelligence5, 11 (2023), 1214–1224
2023
-
[43]
Ronald E Robertson, Jon Green, Damian J Ruck, Katherine Ognyanova, Christo Wilson, and David Lazer. 2023. Users choose to engage with more partisan news than they are exposed to on Google Search.Nature618, 7964 (2023), 342–348
2023
-
[44]
Salganik, Peter Sheridan Dodds, and Duncan J
Matthew J. Salganik, Peter Sheridan Dodds, and Duncan J. Watts. 2006. Experi- mental Study of Inequality and Unpredictability in an Artificial Cultural Market. Science311, 5762 (2006), 854–856
2006
-
[45]
Fernando P Santos, Yphtach Lelkes, and Simon A Levin. 2021. Link recom- mendation algorithms and dynamics of polarization in online social networks. Proceedings of the National Academy of Sciences118, 50 (2021), e2102141118
2021
-
[46]
Nikolas Schöll, Aina Gallego, and Gaël Le Mens. 2024. How Politicians Learn from Citizens’ Feedback: The Case of Gender on Twitter.American Journal of Political Science68, 2 (2024), 557–574. doi:10.1111/ajps.12772
2024 doi
-
[47]
Karthik Shivaram, Ping Liu, Matthew Shapiro, Mustafa Bilgic, and Aron Culotta
-
[48]
Francesco Sobbrio. 2014. Citizen-editors’ endogenous information acquisition and news accuracy.Journal of Public Economics113 (2014), 43–53
2014
-
[49]
Behzad Tabibian, Vicenç Gomez, Abir De, Bernhard Schölkopf, and Manuel Gomez Rodriguez. 2020. On the design of consequential rank- ing algorithms. InConference on Uncertainty in Artificial Intelligence. PMLR, 171–180
2020
-
[50]
Emily Theophilou, Davinia Hernández-Leo, and Vicenç Gómez. 2024. Gender- based learning and behavioural differences in an educational social media plat- form.Journal of Computer Assisted Learning40, 6 (2024), 2544–2557
2024
-
[51]
Petter Törnberg, Diliara Valeeva, Justus Uitermark, and Christopher Bail. 2023. Simulating social media using large language models to evaluate alternative news feed algorithms.arXiv preprint arXiv:2310.05984(2023)
2023 arXiv
-
[52]
Isaac Waller and Ashton Anderson. 2021. Quantifying social organization and political polarization in online platforms.Nature600, 7888 (2021), 264–268
2021
-
[53]
Ryen W White and Eric Horvitz. 2015. Belief dynamics and biases in web search. ACM Transactions on Information Systems33, 4 (2015), 1–46
2015
-
[54]
User Positioning
Joe Whittaker, Seán Looney, Alastair Reed, and Fabio Votta. 2021. Recommender systems and the amplification of extremist content.Internet Policy Review10, 2 (2021). A Survey Screenshots In each of the topic-specific tasks, users are shown a screen for: (1) revealing their opin...
2021
-
[2005]
InPro- ceedings of the 28th Annual International ACM SIGIR Conference on Research and Development in Information Retrieval
Accurately interpreting clickthrough data as implicit feedback. InPro- ceedings of the 28th Annual International ACM SIGIR Conference on Research and Development in Information Retrieval. Association for Computing Machinery, 154–161
-
[2022]
InProceedings of the 16th ACM conference on Recommender Systems
Reducing cross-topic political homogenization in content-based news recommendation. InProceedings of the 16th ACM conference on Recommender Systems. 220–228
-
[2023]
A systematic review of worldwide causal and correlational evidence on 9 digital media and democracy.Nature human behaviour7, 1 (2023), 74–101
2023
-
[2025]
https://doi.org/10.1140/epjds/s13688- 025-00585-3
Engagement, Content Quality and Ideology over Time on the Facebook URL Dataset.EPJ Data Science15, 73 (2025). https://doi.org/10.1140/epjds/s13688- 025-00585-3
2025 doi
Reviewed August 15, 2026 · model on record in the stance chip above.
Discussion (0). Continue with ORCID to comment.