REVIEW 4 major objections 4 minor 47 references
Correlative Ultrafast Imaging of a Propagating Photo-Driven Phase Transition Using 4D STEM
T0 review · 4 major / 4 minor · reviewed 2026-08-03 · deepseek-v4-flash
Pith's one-line read Ultrafast 4D STEM maps the strain generated by a propagating photo-driven phase transition in vanadium dioxide, showing the lattice distortion is a product of the M1-to-rutile transition rather than laser heating.
desk verdict Genuinely new U-4D STEM capability, but the strain–order-parameter correlation is weaker than claimed because the strain fit may be reading phase fraction. read the letter →
The pith
A machine-rendered reading of the paper's core claim, the machinery that carries it, and where it could break.
The reading
What carries the argument
The central mechanism is the transient optical grating: a femtosecond pump and its reflection interfere on the sample to create a 1 µm periodic excitation pattern. This imposes a well-defined geometry that separates phase-transition regions from unexcited regions. The measurement machinery is ultrafast 4D STEM with a quasi-parallel nano-beam electron probe; virtual apertures in diffraction space give Bragg-resolved dark-field images of the M1 superstructure, and peak-tracking analysis converts shifts of strong shared reflections into strain maps. The correlation between these two outputs is what carries the argument.
What would settle it
If a pump–probe measurement on the same lamella, using a zone-axis tilt series or a probe small enough to resolve bend contours, showed the ~1% εxx shifts accompanied by spot shape or intensity changes characteristic of bending rather than a uniform lattice contraction — or if the strain rise time matched the ~50 ps thermal simulation instead of the ~20 ps structural rise — the central claim would be undercut.
Extended reading notes
Core claim
Using nano-beam electron diffraction in ultrafast 4D STEM with a spatially patterned optical pump, the authors directly image a photo-induced M1→rutile phase transition propagating across a VO2 lamella. Virtual dark-field masks on the M1-exclusive superstructure spots track the structural order parameter, while shifts of strong Bragg peaks shared by both phases provide εxx strain maps from the same scan. The M1-specific signal and strain are positively correlated (r≈0.6) and modulated by the grating period, and the ~1% strain amplitude is an order of magnitude larger than finite-element heating simulations produce. The authors conclude that the measured strain is primarily a consequence of t
Load-bearing premise
The strain numbers are shifts of strong Bragg peaks that both phases share, normalized to zero at negative delay; the interpretation assumes those peak shifts are clean in-plane lattice strain rather than a mix of local bending, tilt, or thickness artifacts.
Editorial extensions
If this is right
- Strain and structural order parameter can be extracted from a single ultrafast 4D STEM dataset, so one no longer needs separate dark-field and strain measurements with different alignment.
- If the strain is a transition product, then in this excitation regime the phase transition launches the mechanical response, meaning device design should treat the strain as a fast, intrinsic companion of switching rather than a slow thermal effect.
- Bright-field contrast is not a reliable proxy for the phase transition; only Bragg-resolved signals track the order parameter, so previous ultrafast imaging based on bright-field contrast may mix unrelated scattering channels.
- The photo-induced M1→R transition creates a transient transmission grating with picosecond contrast, a route to ultrafast reconfigurable diffractive optics; engineering the band gap could push it toward telecom wavelengths.
- Thermal-only finite-element models reported in the paper predict an order-of-magnitude smaller strain, strengthening the conclusion that the structural transition, not heating, dominates strain formation in these experiments.
Reading between the lines
- Beyond the paper, the grating-geometry approach could be used to test causality: varying the grating period would show whether the strain front velocity and phase-front velocity track each other, giving a direct readout of how the mechanical response feeds back into the transition.
- The same correlative analysis could be applied to other correlated oxides or heterostructures; if the strain–order-parameter correlation holds there, strain mapping might serve as a general non-destructive probe of hidden order parameters.
- One testable extension is to compare the measured strain with a strain map computed from the phase fraction alone; if they disagree locally, the residual would reveal additional contributions such as acoustic waves or boundary effects that the paper does not separate.
- The claim that strain does not trigger the transition here is regime-specific; at higher fluences or in clamped geometries, strain-mediated feedback could become dominant, and the same experimental setup could probe where that crossover occurs.
Signed reviews
Editorial analysis
A structured set of objections, weighed in public.
Referee Report
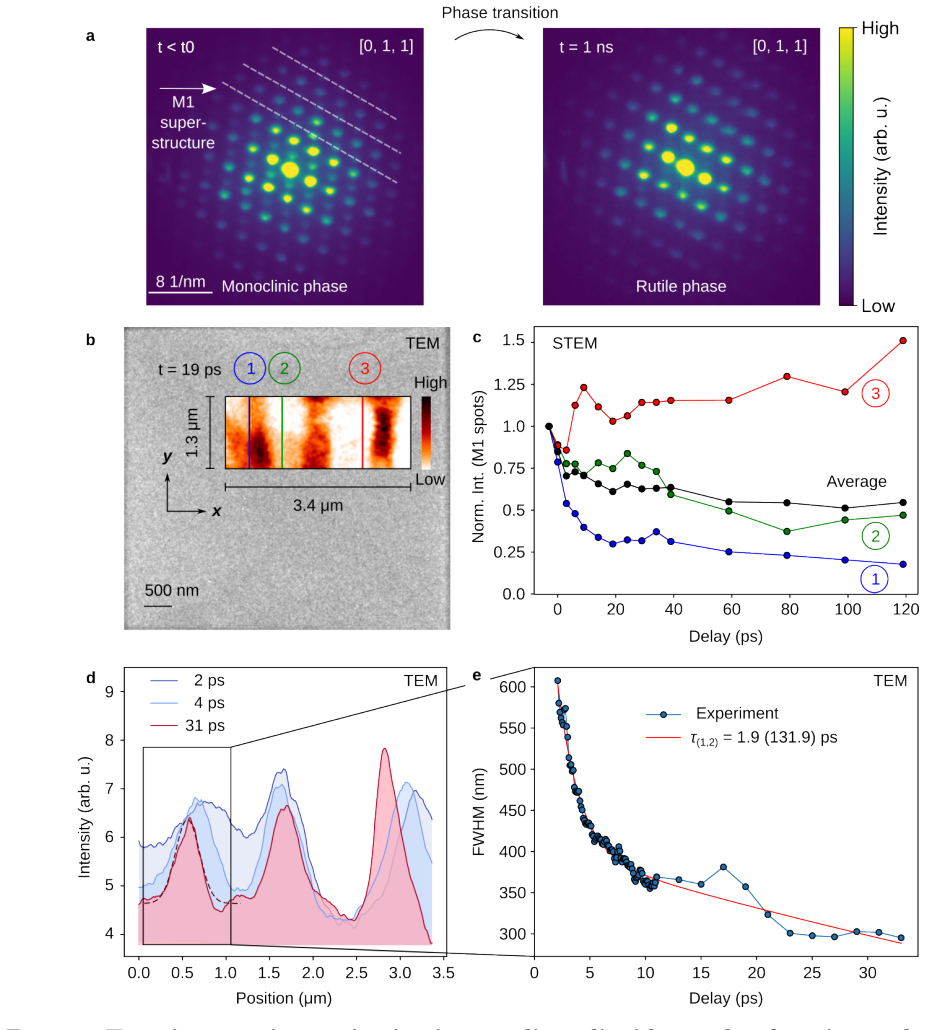
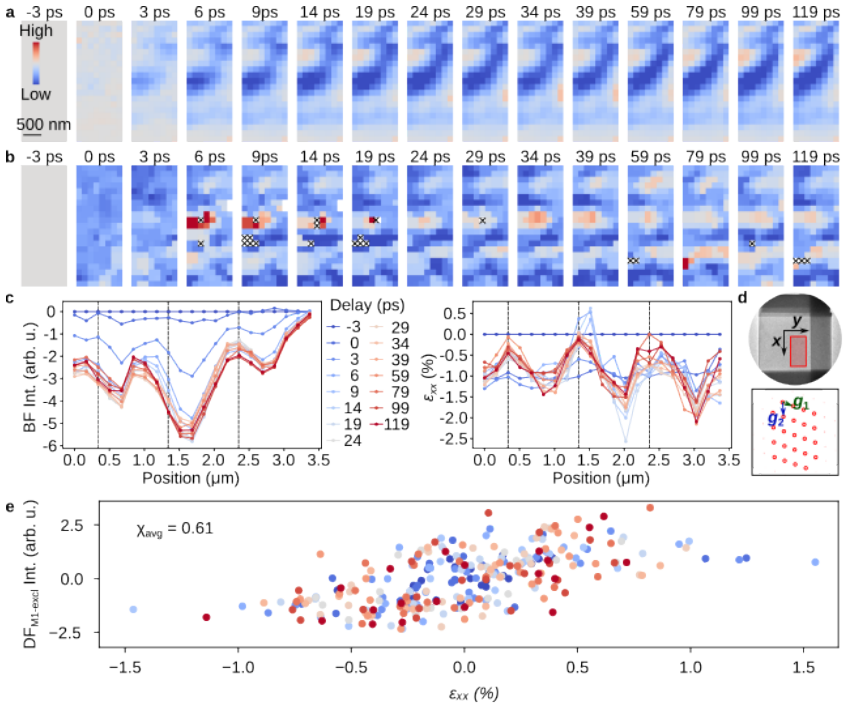
Summary. The paper reports ultrafast 4D scanning transmission electron microscopy (U-4D STEM) of a VO2 lamella excited by a transient optical grating. From the same pump–probe dataset the authors extract time-resolved virtual dark-field images using M1-exclusive superstructure reflections, virtual bright-field images, and quantitative strain maps (εxx) from a single-lattice py4DSTEM fit to shared Bragg peaks. They observe a photoinduced M1→R phase transition that propagates on picosecond timescales, and report a correlation coefficient of approximately 0.6 between the M1-specific dark-field signal and εxx (Fig. 4e, Fig. 11e). They interpret the measured ~1% strain as a consequence of the structural phase transition rather than laser-induced heating, and support this with a COMSOL heating-only simulation that yields ~0.1% thermal strain.
Significance. If the central claim holds, the paper would demonstrate a substantial methodological advance: simultaneous, spatially resolved strain mapping and Bragg-resolved order-parameter imaging within a single ultrafast 4D STEM dataset. The use of M1-exclusive superstructure spots for phase tracking, the same-dataset registration of virtual imaging and strain analysis, and the transient-grating geometry for reproducible excitation are genuine strengths, as is the explicit attempt to provide a heating-only counterfactual via COMSOL. However, the current evidence for the central claim is weakened by the likely mixing of M1 and R contributions in the shared-peak strain retrieval, by the absence of uncertainty quantification for the central correlation, and by an internal inconsistency in the heating-only simulation (it reaches 500 K, above Tc, while forbidding the phase transition). These issues are load-bearing for the conclusion that the measured strain is a distinct mechanical consequence of the phase transition rather than a phase-fraction artifact or a thermal effect.
major comments (4)
- [SI, 'Ultrafast strain mapping'; Figs. 8, 11e] The strain analysis fits a single lattice to strong Bragg peaks shared by M1 and R phases, explicitly disregarding M1-exclusive superstructure spots. With a probe size of ~400 nm and a grating period of 1 µm, each diffraction pattern averages over a mixture of M1 and R domains. The shared peaks have slightly different d-spacings in the two phases, so the fitted centroid will shift with the local R-phase fraction even in the absence of elastic strain. Thus εxx may partly measure phase fraction, making the reported r≈0.61 correlation with the M1-specific dark-field signal a partially expected consequence rather than independent confirmation. The authors should demonstrate insensitivity to two-phase mixing, for example by simulating diffraction patterns from mixed M1/R regions with known phase fractions and zero elastic strain, or by fitting two lattices; otherwise the central interpretatio
- [Fig. 4e; Fig. 11e; main text 'Correlative ultrafast imaging'] The central quantitative evidence—correlation coefficients of ≈0.6 (and ≈−0.25 for VBF)—is reported without error bars, p-values, effective sample sizes, or details of the detrending procedure. Because the VDF and εxx maps are derived from the same diffraction patterns and are spatially autocorrelated over a ~400 nm probe, the number of independent samples is far smaller than the nominal 168 pixels. The authors should provide uncertainty estimates (e.g., bootstrap over pixels or line profiles), a significance test, and a clear definition of the reported correlation coefficient and the detrending operation.
- [Discussion; SI 'COMSOL simulations'; Fig. 6] The heating-only COMSOL model reaches a maximum temperature of ~500 K, which exceeds the bulk VO2 transition temperature (~340 K), yet the model does not include the phase transition. The statement that 'even at elevated temperatures, the resulting strain is insufficient to ... trigger the phase transition' is inconsistent with the model's own thermal prediction. The simulation can only bound thermal expansion in the M1 phase; it cannot exclude a thermally driven M1→R transition. To support the claim that the measured strain is not thermal in origin, the simulation should either include the phase transition and its transformation strain, or be complemented by a control experiment with controlled sample temperature. As written, the heating-only counterfactual is not a valid exclusion of thermal mechanisms.
- [Abstract; SI 'Ultrafast 4D-STEM Acquisition', Fig. 7] The abstract and text repeatedly claim 'picosecond-nanometer resolution', but the effective probe size is estimated at ~400 nm (SI Fig. 7), and the pixel spacing is 160 nm. This is not nanometer resolution in the usual sense. The spatial-resolution claims should be qualified to avoid overstating the technique's capability; for the present grating period of 1 µm, a 400 nm probe still resolves the grating, but the language should match the measured beam size.
minor comments (4)
- [Main text, 'Correlative ultrafast imaging'] The text refers to 'Fig. 4c' when discussing the correlation between M1-specific dark-field signal and strain; the correlation plot appears to be Fig. 4e, while Fig. 4c shows virtual bright-field line profiles. Please correct the cross-reference.
- [SI, Fig. 11] The correlation coefficient is denoted χ in the SI but 'correlation coefficient' in the main text. Define χ (e.g., Pearson r) and use consistent notation.
- [SI, 'COMSOL simulations'] Typo: 'softare' should be 'software'.
- [SI, 'Ultrafast strain mapping'] The statement that M1-exclusive spots are disregarded 'due to their low intensity' is central to the two-phase concern; please provide the intensity ratio or a justification for why these spots cannot be used in the strain fit.
Circularity Check
Strain retrieval from shared M1/R peaks makes the strain–M1 correlation partly tautological.
-
self definitional
[SI Fig. 8 caption; SI 'Correlation of strain with virtual BF and DF imaging' (Fig. 11e); main text 'Correlative ultrafast imaging']
"Diffraction peaks are identified for strain analysis. The M1-exclusive diffraction spots are disregarded due to their low intensity. ... In Fig. 11e, the strong positive correlation between the VDF signal associated with the M1 Bragg reflections and the extracted strain (χ≈0.61) indicates that both observables probe the same underlying structural order parameter."
Strain is retrieved by fitting a single lattice to the strong spots common to M1 and R, while M1-exclusive spots are discarded. With a ~400 nm probe and 1 µm grating period, each diffraction pattern averages over coexisting M1 and R domains; the shared peaks differ by the ~1% a-axis contraction, so the fitted peak centroid shifts with local R-phase fraction even without elastic strain. The M1 dark-field signal is likewise a measure of M1 fraction. Hence the χ≈0.61 correlation is expected from the shared phase fraction by construction; using it to confirm that 'the measured strain arises as a direct consequence of the structural phase transition' is measuring the same order parameter twice.
full rationale
The paper's central correlative evidence is partly circular. The strain maps are produced by py4DSTEM fitting a single lattice to the strong Bragg peaks common to both M1 and rutile phases, after explicitly discarding M1-exclusive spots (SI Fig. 8). In the experimental geometry (probe ~400 nm, grating period 1 µm), each diffraction pattern averages over coexisting M1 and R domains, whose shared-spot d-spacings differ by the same ~1% a-axis contraction used elsewhere in the paper as the strain scale. A single-peak fit therefore returns an intensity-weighted centroid that shifts with the local R-phase fraction even in the absence of elastic strain. The M1 dark-field virtual image measures the same phase fraction. The paper's own statement that 'both observables probe the same underlying structural order parameter' (SI) concedes this. Consequently, the r≈0.61 correlation cannot independently confirm that the measured strain is a mechanical consequence of the transition rather than a two-phase averaging artifact. The COMSOL heating-only simulation is an independent check on the thermal-strain amplitude and timescale, and the self-citations (Refs 22, 23, 33, 46) are for methodology/setup rather than for the physical conclusion, so the circularity is limited to the correlative confirmation. Positions where strain retrieval failed (black crosses, Fig. 4b) could further bias the analysis toward single-phase regions, but this is a data-selection concern rather than an additional circular step. Overall, partial circularity of the central correlative claim, with an otherwise self-contained technique demonstration.
Assumptions & free parameters
assumptions (5)
- domain assumption VO2 undergoes M1-to-R structural phase transition with ~1% contraction of lattice parameter a (Kucharczyk & Niklewski 1979, Ref 38).
- domain assumption Diffraction peak shifts measured by py4DSTEM represent elastic lattice strain, uncontaminated by bending/tilt or thickness variations.
- domain assumption COMSOL heat-only simulation (no phase transition, material parameters from library/refs) provides a valid counterfactual for 'laser heating without transition'.
- domain assumption Time-zero determined by onset of M1-exclusive spot intensity drop coincides with the structural transition onset.
- domain assumption Normalization of all images to negative-delay static strain/bending removes steady-state artifacts.
Cite this review
Pith. "Pith review of Correlative Ultrafast Imaging of a Propagating Photo-Driven Phase Transition Using 4D STEM." pith.science (2026). https://pith.science/paper/ILHTKDV3
@misc{pith2026260105018,
  author       = {Pith},
  title        = {Pith review of: Correlative Ultrafast Imaging of a Propagating Photo-Driven Phase Transition Using 4D STEM},
  year         = {2026},
  howpublished = {\url{https://pith.science/paper/ILHTKDV3}},
  note         = {Machine review of arXiv:2601.05018}
}
read the original abstract
Oxides exhibiting insulator-metal transitions are promising candidates for next generation ultrafast electronic switching devices. However, critical gaps remain in understanding the onset of strain and its dynamics as these materials undergo structural transitions, particularly in nanostructured configurations. Here, we present ultrafast four-dimensional scanning transmission electron microscopy enabling virtual imaging and strain mapping at every point in space and time. Using this technique, we directly probe a laser-excited phase transition in the prototypical material vanadium dioxide (VO2), recording its spatiotemporal propagation. This direct imaging capability reveals the dynamics of the structural phase transition and connects it to the resulting strain formation on picosecond timescales. This correlation reveals how atomic-scale symmetry breaking inherently generates lattice distortions, which then propagate to govern macroscopic property changes. Our findings provide new insights into the coupling between electronic, structural, and mechanical responses in correlated oxides under non-equilibrium conditions.
Figures


Figures from the paper (9 more)


Reference graph
Works this paper leans on
-
[1]
R.; Jaksch, D.; Cavalleri, A
Mitrano, M.; Cantaluppi, A.; Nicoletti, D.; Kaiser, S.; Perucchi, A.; Lupi, S.; Di Pietro, P.; Pontiroli, D.; Riccò, M.; Clark, S. R.; Jaksch, D.; Cavalleri, A. Possible light-induced superconductivity in K3C60 at high temperature. Nature 2016, 530, 461--464, Publisher: Nature Publishing Group
2016
-
[2]
Samizadeh Nikoo, M.; Soleimanzadeh, R.; Krammer, A.; Migliato Marega, G.; Park, Y.; Son, J.; Schueler, A.; Kis, A.; Moll, P. J. W.; Matioli, E. Electrical control of glass-like dynamics in vanadium dioxide for data storage and processing. Nat Electron 2022, 5, 596--603, Number: 9 Publisher: Nature Publishing Group
2022
-
[3]
Synthesis of a metal oxide with a room-temperature photoreversible phase transition
Ohkoshi, S.-i.; Tsunobuchi, Y.; Matsuda, T.; Hashimoto, K.; Namai, A.; Hakoe, F.; Tokoro, H. Synthesis of a metal oxide with a room-temperature photoreversible phase transition. Nature Chem 2010, 2, 539--545, Publisher: Nature Publishing Group
2010
-
[4]
Oxide Electronics Utilizing Ultrafast Metal - Insulator Transitions
Yang, Z.; Ko, C.; Ramanathan, S. Oxide Electronics Utilizing Ultrafast Metal - Insulator Transitions . Annu. Rev. Mater. Res. 2011, 41, 337--367
2011
-
[5]
Current- Driven Phase Oscillation and Domain - Wall Propagation in WxV1 - xO2 Nanobeams
Gu, Q.; Falk, A.; Wu, J.; Ouyang, L.; Park, H. Current- Driven Phase Oscillation and Domain - Wall Propagation in WxV1 - xO2 Nanobeams . Nano Lett. 2007, 7, 363--366, Publisher: American Chemical Society
2007
-
[6]
W.; Chae, B.-G.; Yun, S
Kim, B.-J.; Lee, Y. W.; Chae, B.-G.; Yun, S. J.; Oh, S.-Y.; Kim, H.-T.; Lim, Y.-S. Temperature dependence of the first-order metal-insulator transition in VO2 and programmable critical temperature sensor. Applied Physics Letters 2007, 90, 023515
2007
-
[7]
J.; Aydin, K.; Pryce, I
Dicken, M. J.; Aydin, K.; Pryce, I. M.; Sweatlock, L. A.; Boyd, E. M.; Walavalkar, S.; Ma, J.; Atwater, H. A. Frequency tunable near-infrared metamaterials based on VO \_2 phase transition. Opt. Express 2009, 17, 18330
2009
-
[8]
Driscoll, T.; Kim, H.-T.; Chae, B.-G.; Di Ventra, M.; Basov, D. N. Phase-transition driven memristive system. Applied Physics Letters 2009, 95, 043503
2009
Show all 47 references
-
[9]
Electrical triggering of metal-insulator transition in nanoscale vanadium oxide junctions
Ruzmetov, D.; Gopalakrishnan, G.; Deng, J.; Narayanamurti, V.; Ramanathan, S. Electrical triggering of metal-insulator transition in nanoscale vanadium oxide junctions. Journal of Applied Physics 2009, 106, 083702
2009
-
[10]
Gas Sensor Based on Metal Insulator Transition in VO2 Nanowire Thermistor
Strelcov, E.; Lilach, Y.; Kolmakov, A. Gas Sensor Based on Metal Insulator Transition in VO2 Nanowire Thermistor . Nano Lett. 2009, 9, 2322--2326, Publisher: American Chemical Society
2009
-
[11]
M.; Pryce, I
Briggs, R. M.; Pryce, I. M.; Atwater, H. A. Compact silicon photonic waveguide modulator based on the vanadium dioxide metal-insulator phase transition. Opt. Express 2010, 18, 11192
2010
-
[12]
Three-terminal field effect devices utilizing thin film vanadium oxide as the channel layer
Ruzmetov, D.; Gopalakrishnan, G.; Ko, C.; Narayanamurti, V.; Ramanathan, S. Three-terminal field effect devices utilizing thin film vanadium oxide as the channel layer. Journal of Applied Physics 2010, 107, 114516
2010
-
[13]
J.; Zajac, M.; Sun, Y.; Chen, L.-Q.; Ramanathan, S.; Wang, X.; Chueh, W
Sood, A.; Shen, X.; Shi, Y.; Kumar, S.; Park, S. J.; Zajac, M.; Sun, Y.; Chen, L.-Q.; Ramanathan, S.; Wang, X.; Chueh, W. C.; Lindenberg, A. M. Universal phase dynamics in VO _ 2 switches revealed by ultrafast operando diffraction. Science 2021, 373, 352--355
2021
-
[14]
Elastically driven cooperative response of a molecular material impacted by a laser pulse
Bertoni, R.; Lorenc, M.; Cailleau, H.; Tissot, A.; Laisney, J.; Boillot, M.-L.; Stoleriu, L.; Stancu, A.; Enachescu, C.; Collet, E. Elastically driven cooperative response of a molecular material impacted by a laser pulse. Nature Mater 2016, 15, 606--610, Publisher: Nature Pub...
2016
-
[15]
H.; Coy, J
Park, J. H.; Coy, J. M.; Kasirga, T. S.; Huang, C.; Fei, Z.; Hunter, S.; Cobden, D. H. Measurement of a solid-state triple point at the metal–insulator transition in VO2 . Nature 2013, 500, 431--434, Number: 7463 Publisher: Nature Publishing Group
2013
-
[16]
Johnson, A. S. et al. Ultrafast X -ray imaging of the light-induced phase transition in VO2 . Nat. Phys. 2022, 1--6, Publisher: Nature Publishing Group
2022
-
[17]
T.; Jones, A
O’Callahan, B. T.; Jones, A. C.; Hyung Park, J.; Cobden, D. H.; Atkin, J. M.; Raschke, M. B. Inhomogeneity of the ultrafast insulator-to-metal transition dynamics of VO2 . Nat Commun 2015, 6, 6849, Number: 1 Publisher: Nature Publishing Group
2015
-
[18]
J.; Eliason, J
McKenna, A. J.; Eliason, J. K.; Flannigan, D. J. Spatiotemporal Evolution of Coherent Elastic Strain Waves in a Single MoS2 Flake . Nano Lett. 2017, 17, 3952--3958, Publisher: American Chemical Society
2017
-
[19]
Zhang, Y.; Flannigan, D. J. Observation of Anisotropic Strain - Wave Dynamics and Few - Layer Dephasing in MoS _ 2 with Ultrafast Electron Microscopy . Nano Lett. 2019, 19, 8216--8224
2019
-
[20]
X.; Flannigan, D
Du, D. X.; Flannigan, D. J. Imaging phonon dynamics with ultrafast electron microscopy: Kinematical and dynamical simulations. Structural Dynamics 2020, 7, 024103
2020
-
[21]
Zhang, Y.; Flannigan, D. J. Imaging Nanometer Phonon Softening at Crystal Surface Steps with 4D Ultrafast Electron Microscopy . Nano Lett. 2021, 21, 7332--7338
2021
-
[22]
Influence of strain on an ultrafast phase transition
Ji, S.; Grånäs, O.; Kumar Prasad, A.; Weissenrieder, J. Influence of strain on an ultrafast phase transition. Nanoscale 2023, 15, 304--312
2023
-
[23]
K.; Balatsky, A.; Weissenrieder, J
Wu, J.; Prasad, A. K.; Balatsky, A.; Weissenrieder, J. Spatiotemporal determination of photoinduced strain in a Weyl semimetal. Structural Dynamics 2024, 11, 054301
2024
-
[24]
A.; Plankl, M.; Eisele, M.; Marvel, R
Huber, M. A.; Plankl, M.; Eisele, M.; Marvel, R. E.; Sandner, F.; Korn, T.; Schüller, C.; Haglund, R. F. J.; Huber, R.; Cocker, T. L. Ultrafast Mid - Infrared Nanoscopy of Strained Vanadium Dioxide Nanobeams . Nano Lett. 2016, 16, 1421--1427, Publisher: American Chemical Society
2016
-
[25]
A.; Khatib, O.; O’Callahan, B
Dönges, S. A.; Khatib, O.; O’Callahan, B. T.; Atkin, J. M.; Park, J. H.; Cobden, D.; Raschke, M. B. Ultrafast Nanoimaging of the Photoinduced Phase Transition Dynamics in VO2 . Nano Lett. 2016, 16, 3029--3035, Publisher: American Chemical Society
2016
-
[26]
Zewail, A. H. 4D ULTRAFAST ELECTRON DIFFRACTION , CRYSTALLOGRAPHY , AND MICROSCOPY . Annu. Rev. Phys. Chem. 2006, 57, 65--103
2006
-
[27]
High-resolution correlative imaging in ultrafast electron microscopy
Kim, Y.-J.; , P., Won-Woo; , N., Hak-Won; ; Kwon, O.-H. High-resolution correlative imaging in ultrafast electron microscopy. Advances in Physics: X 2024, 9, 2316710, Publisher: Taylor & Francis \_eprint: https://doi.org/10.1080/23746149.2024.2316710
2024
-
[28]
Nanoscale diffractive probing of strain dynamics in ultrafast transmission electron microscopy
Feist, A.; Rubiano Da Silva, N.; Liang, W.; Ropers, C.; Schäfer, S. Nanoscale diffractive probing of strain dynamics in ultrafast transmission electron microscopy. Structural Dynamics 2018, 5, 014302
2018
-
[29]
Visualizing optically-induced strains by five-dimensional ultrafast electron microscopy
Nakamura, A.; Shimojima, T.; Ishizaka, K. Visualizing optically-induced strains by five-dimensional ultrafast electron microscopy. Faraday Discuss. 2022, 237, 27--39
2022
-
[30]
Development of five-dimensional scanning transmission electron microscopy
Shimojima, T.; Nakamura, A.; Ishizaka, K. Development of five-dimensional scanning transmission electron microscopy. Review of Scientific Instruments 2023, 94, 023705
2023
-
[31]
J.; Howe, J
Rozeveld, S. J.; Howe, J. M. Determination of multiple lattice parameters from convergent-beam electron diffraction patterns. Ultramicroscopy 1993, 50, 41--56
1993
-
[32]
Four- Dimensional Scanning Transmission Electron Microscopy ( 4D - STEM ): From Scanning Nanodiffraction to Ptychography and Beyond
Ophus, C. Four- Dimensional Scanning Transmission Electron Microscopy ( 4D - STEM ): From Scanning Nanodiffraction to Ptychography and Beyond . Microsc Microanal 2019, 25, 563--582
2019
-
[33]
Femtosecond laser driven precessing magnetic gratings
Cao, G.; Jiang, S.; Åkerman, J.; Weissenrieder, J. Femtosecond laser driven precessing magnetic gratings. Nanoscale 2021, 13, 3746--3756
2021
-
[34]
Baum, P.; Yang, D.-S.; Zewail, A. H. 4D Visualization of Transitional Structures in Phase Transformations by Electron Diffraction . Science 2007, 318, 788--792
2007
-
[35]
Savitzky, B. H. et al. py4DSTEM : A Software Package for Four - Dimensional Scanning Transmission Electron Microscopy Data Analysis . Microsc Microanal 2021, 27, 712--743
2021
-
[36]
H.; Minor, A
Gammer, C.; Burak Ozdol, V.; Liebscher, C. H.; Minor, A. M. Diffraction contrast imaging using virtual apertures. Ultramicroscopy 2015, 155, 1--10
2015
-
[37]
Ultrafast nanoimaging of the order parameter in a structural phase transition
Danz, T.; Domröse, T.; Ropers, C. Ultrafast nanoimaging of the order parameter in a structural phase transition. Science 2021, 371, 371--374, Publisher: American Association for the Advancement of Science
2021
-
[38]
Accurate X -ray determination of the lattice parameters and the thermal expansion coefficients of VO2 near the transition temperature
Kucharczyk, D.; Niklewski, T. Accurate X -ray determination of the lattice parameters and the thermal expansion coefficients of VO2 near the transition temperature. Journal of Applied Crystallography 1979, 12, 370--373, \_eprint: https://onlinelibrary.wiley.com/doi/pdf/10.1107...
1979 doi
-
[39]
B.; Gray, A
Aetukuri, N. B.; Gray, A. X.; Drouard, M.; Cossale, M.; Gao, L.; Reid, A. H.; Kukreja, R.; Ohldag, H.; Jenkins, C. A.; Arenholz, E.; Roche, K. P.; Dürr, H. A.; Samant, M. G.; Parkin, S. S. P. Control of the metal–insulator transition in vanadium dioxide by modifying orbital oc...
2013
-
[40]
M.; Weber, S.; Hÿtch, M
Houdellier, F.; Caruso, G. M.; Weber, S.; Hÿtch, M. J.; Gatel, C.; Arbouet, A. Optimization of off-axis electron holography performed with femtosecond electron pulses. Ultramicroscopy 2019, 202, 26--32
2019
-
[41]
A New Growing Method for VO2 Single Crystals
Sasaki, H.; Watanabe, A. A New Growing Method for VO2 Single Crystals . Journal of the Physical Society of Japan 1964, 19, 1748--1748
1964
-
[42]
Single-crystal growth of VO2 by isothermal flux-evaporation
Aramaki, S.; Roy, R. Single-crystal growth of VO2 by isothermal flux-evaporation. J Mater Sci 1968, 3, 643--645
1968
-
[43]
Polyanskiy, M. N. Refractiveindex.info database of optical constants. Sci Data 2024, 11, 94, Publisher: Nature Publishing Group
2024
-
[44]
Temperature dependence of thermal conductivity of VO2 thin films across metal–insulator transition
Kizuka, H.; Yagi, T.; Jia, J.; Yamashita, Y.; Nakamura, S.; Taketoshi, N.; Shigesato, Y. Temperature dependence of thermal conductivity of VO2 thin films across metal–insulator transition. Jpn. J. Appl. Phys. 2015, 54, 053201, Publisher: IOP Publishing
2015
-
[45]
Elastic properties of VO2 from first-principles calculation
Dong, H.; Liu, H. Elastic properties of VO2 from first-principles calculation. Solid State Communications 2013, 167, 1--4
2013
-
[46]
T.; Reed, B
Ji, S.; Piazza, L.; Cao, G.; Park, S. T.; Reed, B. W.; Masiel, D. J.; Weissenrieder, J. Influence of cathode geometry on electron dynamics in an ultrafast electron microscope. Structural Dynamics 2017, 4, 054303
2017
-
[47]
< 4sϮJ)RJ)jiF7 (RJ)R_'͈DL`1 PJ)RJ)-=DD
Cautaerts, N.; Crout, P.; Ånes, H. W.; Prestat, E.; Jeong, J.; Dehm, G.; Liebscher, C. H. Free, flexible and fast: Orientation mapping using the multi-core and GPU -accelerated template matching capabilities in the Python -based open source 4D - STEM analysis toolbox Pyxem . U...
2022
Reviewed August 3, 2026 · model on record in the stance chip above.
Discussion (0). Continue with ORCID to comment.