TopoFlow: Topography-aware Pollutant Flow Learning for High-Resolution Air Quality Prediction
Pith reviewed 2026-05-15 21:10 UTC · model grok-4.3
The pith
A vision transformer that accounts for terrain shape and wind direction predicts air quality with substantially lower error than prior methods.
A machine-rendered reading of the paper's core claim, the machinery that carries it, and where it could break.
Core claim
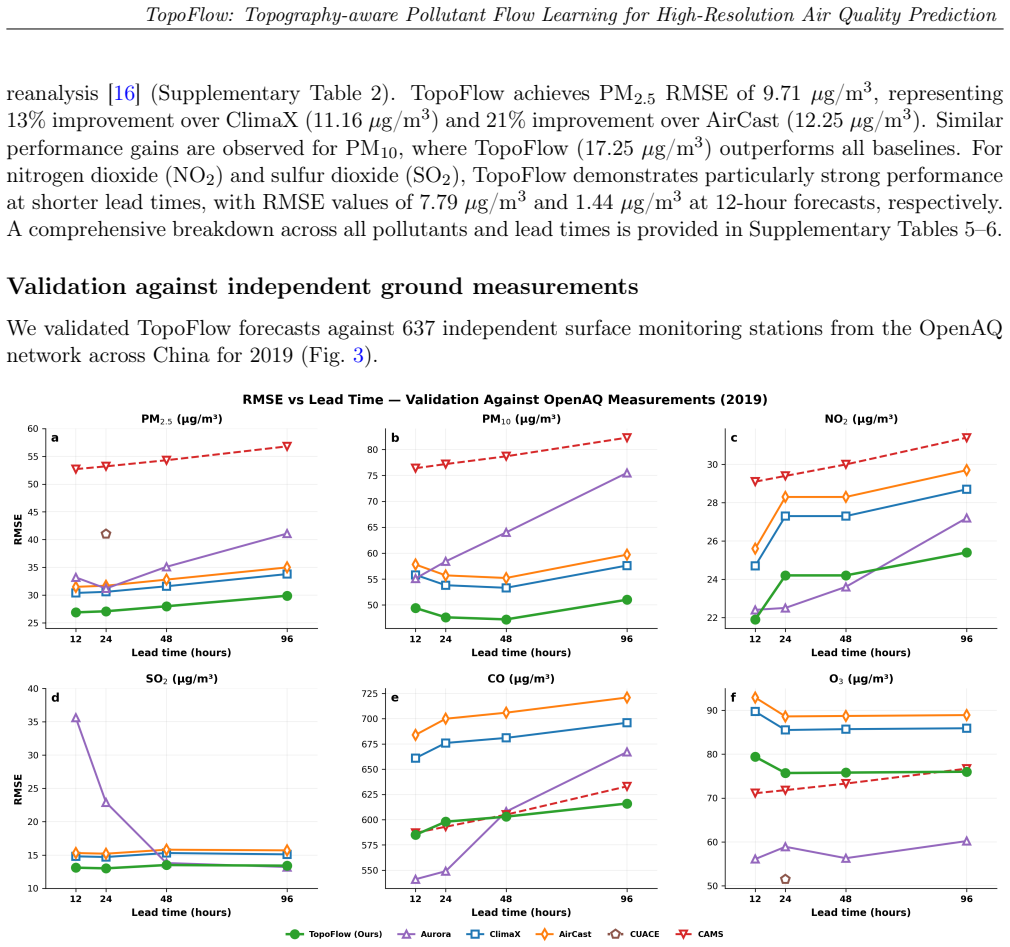
TopoFlow embeds physical processes into a neural network by using topography-aware attention to model terrain effects on flow and wind-guided patch reordering to align representations with wind directions. When trained on six years of high-resolution reanalysis data assimilating observations from over 1,400 stations across China, the model reaches a PM2.5 RMSE of 9.71 ug/m3. This is a 71-80 percent improvement over operational forecasting systems and a 13 percent improvement over state-of-the-art AI baselines. The advantage persists across all four major pollutants and forecast lead times from 12 to 96 hours, with errors staying below China's 75 ug/m3 air quality threshold.
What carries the argument
topography-aware attention and wind-guided patch reordering within a vision transformer that embed terrain channeling and wind transport into the model's spatial processing
Load-bearing premise
The two new mechanisms drive the gains more than any differences in data preparation or model tuning.
What would settle it
An ablation study that removes the topography-aware attention and wind-guided reordering from the model while keeping all other elements identical would show whether the RMSE increases significantly.
Figures


read the original abstract
We propose TopoFlow (Topography-aware pollutant Flow learning), a physics-guided neural network for efficient, high-resolution air quality prediction. To explicitly embed physical processes into the learning framework, we identify two critical factors governing pollutant dynamics: topography and wind direction. Complex terrain can channel, block, and trap pollutants, while wind acts as a primary driver of their transport and dispersion. Building on these insights, TopoFlow leverages a vision transformer architecture with two novel mechanisms: topography-aware attention, which explicitly models terrain-induced flow patterns, and wind-guided patch reordering, which aligns spatial representations with prevailing wind directions. Trained on six years of high-resolution reanalysis data assimilating observations from over 1,400 surface monitoring stations across China, TopoFlow achieves a PM2.5 RMSE of 9.71 ug/m3, representing a 71-80% improvement over operational forecasting systems and a 13% improvement over state-of-the-art AI baselines. Forecast errors remain well below China's 24-hour air quality threshold of 75 ug/m3 (GB 3095-2012), enabling reliable discrimination between clean and polluted conditions. These performance gains are consistent across all four major pollutants and forecast lead times from 12 to 96 hours, demonstrating that principled integration of physical knowledge into neural networks can fundamentally advance air quality prediction.
Editorial analysis
A structured set of objections, weighed in public.
Referee Report
Summary. The manuscript proposes TopoFlow, a vision-transformer architecture for high-resolution air-quality forecasting that augments standard self-attention with a topography-aware attention module and replaces raster patch ordering with wind-guided reordering. Trained on six years of high-resolution reanalysis data assimilating observations from >1,400 Chinese stations, the model reports a PM2.5 RMSE of 9.71 µg m⁻³, corresponding to 71–80 % improvement over operational systems and 13 % over prior AI baselines, with consistent gains across four pollutants and 12–96 h lead times.
Significance. If the reported gains survive controlled ablation of the two novel modules, the work would provide concrete evidence that explicit encoding of terrain-induced flow and wind-driven transport can measurably improve neural forecasts in complex topography, offering a template for physics-informed architectures in other environmental domains.
major comments (2)
- [Experiments] Experiments section (and associated tables/figures): the manuscript presents no ablation experiments that remove topography-aware attention (reverting to standard ViT attention) or wind-guided patch reordering (reverting to raster order) while holding architecture depth, data volume, preprocessing, and training protocol fixed. Without these controls the 13 % margin over AI baselines cannot be causally attributed to the claimed inductive biases rather than differences in training data scale or hyper-parameter search.
- [§3.2 and §4] §3.2 and §4: the description of baseline implementations is insufficient to determine whether the reported 13 % improvement reflects a fair comparison. No details are given on whether the cited state-of-the-art AI models were re-trained on the identical six-year reanalysis corpus, used the same station density, or received equivalent hyper-parameter tuning.
minor comments (2)
- [Figure 3] Figure 3 caption and §4.1: the wind-direction histogram is shown without error bars or sample-size annotation, making it difficult to assess whether the reported alignment statistics are robust across seasons.
- [§3.1] Notation: the symbol for the topography embedding is introduced without an explicit equation; readers must infer its dimensionality from the attention diagram.
Simulated Author's Rebuttal
We thank the referee for the constructive feedback. We agree that the claims would be strengthened by explicit ablation studies isolating the two novel modules and by expanded details on baseline implementations. We will revise the manuscript to incorporate both.
read point-by-point responses
-
Referee: [Experiments] Experiments section (and associated tables/figures): the manuscript presents no ablation experiments that remove topography-aware attention (reverting to standard ViT attention) or wind-guided patch reordering (reverting to raster order) while holding architecture depth, data volume, preprocessing, and training protocol fixed. Without these controls the 13 % margin over AI baselines cannot be causally attributed to the claimed inductive biases rather than differences in training data scale or hyper-parameter search.
Authors: We agree that controlled ablations are required to causally link the reported gains to the topography-aware attention and wind-guided reordering. In the revised manuscript we will add these experiments: variants using standard ViT self-attention (instead of topography-aware attention) and raster patch ordering (instead of wind-guided reordering), with architecture depth, data, preprocessing, and training protocol held fixed. Updated tables and figures will be included in the Experiments section. revision: yes
-
Referee: [§3.2 and §4] §3.2 and §4: the description of baseline implementations is insufficient to determine whether the reported 13 % improvement reflects a fair comparison. No details are given on whether the cited state-of-the-art AI models were re-trained on the identical six-year reanalysis corpus, used the same station density, or received equivalent hyper-parameter tuning.
Authors: We acknowledge that the current text lacks sufficient implementation details for the baselines. In the revision we will expand §§3.2 and 4 to state explicitly that all cited AI baselines were re-implemented and trained on the identical six-year reanalysis corpus with the same station density and preprocessing. We will also document the hyper-parameter search procedure used for each baseline to confirm the comparison is fair. revision: yes
Circularity Check
No significant circularity detected in derivation chain
full rationale
The manuscript presents an empirical neural network (vision transformer with two added mechanisms) trained on reanalysis data and evaluated on held-out forecasts. No equations, self-citations, or uniqueness theorems are invoked to derive the reported RMSE by construction from the inputs. The performance numbers (9.71 µg/m³, 13 % gain) are presented as measured outcomes of training and testing rather than tautological re-statements of fitted parameters or prior self-citations. The architecture choices are described as inductive biases motivated by domain knowledge, not as definitions that force the target metric. This is a standard empirical ML paper whose central claim remains falsifiable by independent replication or ablation.
Axiom & Free-Parameter Ledger
axioms (1)
- domain assumption Topography and wind direction are the two critical factors governing pollutant dynamics
Reference graph
Works this paper leans on
-
[1]
State of Global Air 2024.Health Effects Institute Report, Boston, MA, 2024
Health Effects Institute. State of Global Air 2024.Health Effects Institute Report, Boston, MA, 2024
work page 2024
-
[2]
Nemery, B., Hoet, P. H. M., and Nemmar, A. The Meuse Valley fog of 1930: an air pollution disaster. The Lancet, 357(9257):704–708, 2001. 27 TopoFlow: Topography-aware Pollutant Flow Learning for High-Resolution Air Quality Prediction
work page 1930
-
[3]
Bei, N. et al. Typical synoptic situations and their impacts on the wintertime air pollution in the Guanzhong basin, China.Atmospheric Chemistry and Physics, 16:7373–7387, 2016
work page 2016
-
[4]
Wang, Y. et al. Aggravated air pollution events and high secondary aerosol formation potential in the Sichuan Basin, China.Journal of Geophysical Research: Atmospheres, 123:4292–4308, 2018
work page 2018
-
[5]
D.Mountain Meteorology: Fundamentals and Applications
Whiteman, C. D.Mountain Meteorology: Fundamentals and Applications. Oxford University Press, 2000
work page 2000
-
[6]
Ge, C. et al. Validation and calibration of CAMS PM2.5 forecasts using in situ PM2.5 measurements in China and United States.Remote Sensing, 12(22):3813, 2020
work page 2020
-
[7]
Ambient Air Quality Stan- dards
Ministry of Environmental Protection of the People’s Republic of China. Ambient Air Quality Stan- dards. GB 3095-2012, Beijing, China, 2012
work page 2012
-
[8]
Dai, H., Huang, G., Zeng, H., and Yang, F. A Correction Method of Environmental Meteorological Model Based on Long-Short-Term Memory Neural Network.Earth and Space Science, 6(12):2423– 2434, 2019
work page 2019
-
[9]
Qi, H. et al. Multi-model Evaluation and Bayesian Model Averaging in Quantitative Air Quality Forecasting in Central China.Aerosol and Air Quality Research, 22(3):210247, 2022
work page 2022
-
[10]
Ali, M. A. et al. Accuracy assessment of CAMS and MERRA-2 reanalysis PM2.5 and PM10 concen- trations over China.Atmospheric Environment, 288:119297, 2022
work page 2022
-
[11]
Jiang, Y. et al. Contribution of Regional PM2.5 Transport to Air Pollution Enhanced by Sub-Basin Topography: A Modeling Case over Central China.Atmosphere, 11(11):1258, 2020
work page 2020
-
[12]
Peng, Z., Liu, H., and Ma, X. Improving WRF-Chem PM2.5 predictions by combining data assimi- lation and deep-learning-based bias correction.Environment International, 195:109186, 2024
work page 2024
-
[13]
Nguyen, T., Brandstetter, J., Kapoor, A., Gupta, J. K., and Grover, A. ClimaX: a foundation model for weather and climate. InInternational Conference on Machine Learning, 2023
work page 2023
-
[14]
Lam, R. et al. Learning skillful medium-range global weather forecasting.Science, 382(6677):1416– 1421, 2023
work page 2023
-
[15]
Bi, K. et al. Accurate medium-range global weather forecasting with 3D neural networks.Nature, 619(7970):533–538, 2023
work page 2023
-
[16]
Bodnar, C. et al. A foundation model for the Earth system.Nature, 641:1180–1181, 2025
work page 2025
-
[17]
Dosovitskiy, A. et al. An Image is Worth 16x16 Words: Transformers for Image Recognition at Scale. InInternational Conference on Learning Representations, 2021
work page 2021
-
[18]
Liang, J. et al. SwinIR: Image Restoration Using Swin Transformer. InIEEE/CVF ICCV Workshops, pages 1833–1844, 2021
work page 2021
-
[19]
Vaswani, A. et al. Attention is all you need. InNeurIPS, pages 6000–6010, 2017
work page 2017
- [20]
-
[21]
Xu, Y. et al. Improving air quality assessment using physics-inspired deep graph learning.npj Climate and Atmospheric Science, 6:152, 2023. 28 TopoFlow: Topography-aware Pollutant Flow Learning for High-Resolution Air Quality Prediction
work page 2023
-
[22]
Deep Spatio-Temporal Neural Network for Air Quality Reanalysis
Kheder, A., Foreback, B., Wang, L., Liu, Z.-S., and Boy, M. Deep Spatio-Temporal Neural Network for Air Quality Reanalysis. In Petersen, J. and Dahl, V. A., editors,Image Analysis (SCIA 2025), pages 74–87. Springer, 2025
work page 2025
-
[23]
Nedungadi, V. et al. AirCast: Improving Air Pollution Forecasting Through Multi-Variable Data Alignment. InICML 2025 Workshop, 2025
work page 2025
-
[24]
Kong, L. et al. A 6-year-long (2013–2018) high-resolution air quality reanalysis dataset in China based on the assimilation of surface observations from CNEMC.Earth System Science Data, 13(2):529–570, 2021
work page 2013
-
[25]
NOAA Technical Memorandum NESDIS NGDC-24, 2009
Amante, C.andEakins, B.W.ETOPO11Arc-MinuteGlobalReliefModel: Procedures, DataSources and Analysis. NOAA Technical Memorandum NESDIS NGDC-24, 2009
work page 2009
-
[26]
Gridded Population of the World, Version 4 (GPWv4): Population Density, Revision 11
Center for International Earth Science Information Network (CIESIN). Gridded Population of the World, Version 4 (GPWv4): Population Density, Revision 11. NASA SEDAC, 2018
work page 2018
-
[27]
OpenAQ – Open Air Quality Data.https://openaq.org, 2024
OpenAQ. OpenAQ – Open Air Quality Data.https://openaq.org, 2024
work page 2024
-
[28]
M.Pattern Recognition and Machine Learning
Bishop, C. M.Pattern Recognition and Machine Learning. Springer, New York, 2006
work page 2006
-
[29]
Inness, A. et al. The CAMS reanalysis of atmospheric composition.Atmospheric Chemistry and Physics, 19(6):3515–3556, 2019
work page 2019
-
[30]
Wu, C., Li, K., and Bai, K. Validation and Calibration of CAMS PM2.5 Forecasts Using In Situ PM2.5 Measurements in China and United States.Remote Sensing, 12(22):3813, 2020
work page 2020
-
[31]
Lin, M. et al. Climate variability modulates western US ozone air quality in spring via deep strato- spheric intrusions.Nature Communications, 6:7105, 2015
work page 2015
-
[32]
Knowland, K. E. et al. Stratospheric intrusion-influenced ozone air quality exceedances investigated in the NASA MERRA-2 reanalysis.Geophysical Research Letters, 44(20):10691–10701, 2017
work page 2017
-
[33]
Zhao, D. et al. Impact of stratospheric intrusions on ozone enhancement in the lower troposphere and implication to air quality in Hong Kong and other South China regions.Journal of Geophysical Research: Atmospheres, 126(3):e2020JD033955, 2021
work page 2021
-
[34]
Lefohn, A. S. et al. Quantifying the importance of stratospheric-tropospheric transport on surface ozone concentrations at high- and low-elevation monitoring sites in the United States.Atmospheric Environment, 62:646–656, 2012
work page 2012
-
[35]
Kar, J. et al. Evidence of vertical transport of carbon monoxide from MOPITT.Geophysical Research Letters, 31(23):L23105, 2004
work page 2004
-
[36]
Park, M. et al. Transport pathways of carbon monoxide in the Asian summer monsoon diagnosed from MOZART.Journal of Geophysical Research: Atmospheres, 114(D8):D08303, 2009
work page 2009
-
[37]
Foreback, B. et al. A Lagrangian view on severe haze in Beijing: local and long-range sources of trace gases and primary and secondary aerosols.Atmospheric Environment, 363:121602, 2025
work page 2025
-
[38]
Xu, H. et al. Permutation Equivariance of Transformers and its Applications. InIEEE/CVF CVPR, pages 5987–5996, 2024
work page 2024
-
[39]
Wilson, R. Air Pollution, the Automobile, and Public Health.Environment: Science and Policy for Sustainable Development, 31(4), 1989. 29
work page 1989
discussion (0)
Sign in with ORCID, Apple, or X to comment. Anyone can read and Pith papers without signing in.