A Python-Based Peeling Framework for Radio Interferometry: Application to uGMRT 650MHz Imaging
Pith reviewed 2026-05-21 12:04 UTC · model grok-4.3
The pith
A Python-based peeling framework subtracts bright radio sources to flatten images and reveal fainter ones.
A machine-rendered reading of the paper's core claim, the machinery that carries it, and where it could break.
Core claim
The framework efficiently subtracts bright-source models and suppresses their associated direction-dependent artifacts, producing significantly flattened backgrounds and improving image fidelity and faint-source detectability. We further introduce an optimized model-restoration strategy that mitigates direction-dependent artifacts while preserving the flux densities and morphologies of bright sources that are themselves of scientific interest. For fields containing multiple bright sources, sequential application of the framework systematically reduces background noise, thereby increasing sensitivity and faint-source detectability.
What carries the argument
A Python-based direction-dependent calibration and peeling framework built on standard CASA tasks that performs bright-source model subtraction and artifact suppression.
Load-bearing premise
Accurate bright-source models can be constructed from the data and sequential peeling does not introduce new systematic errors when multiple bright sources are present.
What would settle it
Apply the framework to a dataset with known bright sources and measure whether background noise or residual artifact levels decrease compared to images made without peeling.
Figures
read the original abstract
Modern radio interferometric arrays offer high sensitivity, wide fields of view, and broad frequency coverage, but also pose significant data calibration challenges. Standard direction-independent calibration is insufficient to correct direction-dependent effects, such as ionospheric phase distortions and primary beam variations, which produce strong artifacts around bright sources and limit achievable image dynamic range. Built on standard CASA tasks, we present a Python-based direction-dependent calibration and peeling framework, demonstrated using radio continuum imaging data from the upgraded Giant Metrewave Radio Telescope (uGMRT). The framework efficiently subtracts bright-source models and suppresses their associated direction-dependent artifacts, producing significantly flattened backgrounds and improving image fidelity and faint-source detectability. We further introduce an optimized ``model-restoration'' strategy that mitigates direction-dependent artifacts while preserving the flux densities and morphologies of bright sources that are themselves of scientific interest. For fields containing multiple bright sources, sequential application of the framework systematically reduces background noise, thereby increasing sensitivity and faint-source detectability. The framework is Python-based, CASA-compatible, and can be readily applied to other mid- and low-frequency interferometric arrays. The code is publicly released with this paper.
Editorial analysis
A structured set of objections, weighed in public.
Referee Report
Summary. The paper presents a Python-based direction-dependent calibration and peeling framework built on CASA tasks for radio interferometry. It demonstrates the method on uGMRT 650 MHz continuum imaging data, claiming that bright-source model subtraction suppresses direction-dependent artifacts (ionospheric phases, beam variations), produces flattened backgrounds, and improves faint-source detectability. An optimized model-restoration strategy is introduced to preserve scientifically interesting bright sources, and sequential peeling is shown to reduce background noise for fields with multiple bright sources. The code is publicly released.
Significance. If the quantitative performance claims hold, the framework would provide a practical, CASA-compatible tool for addressing direction-dependent effects at low and mid frequencies, increasing dynamic range and source detection in wide-field uGMRT and similar array observations. The public code release supports reproducibility and adoption.
major comments (2)
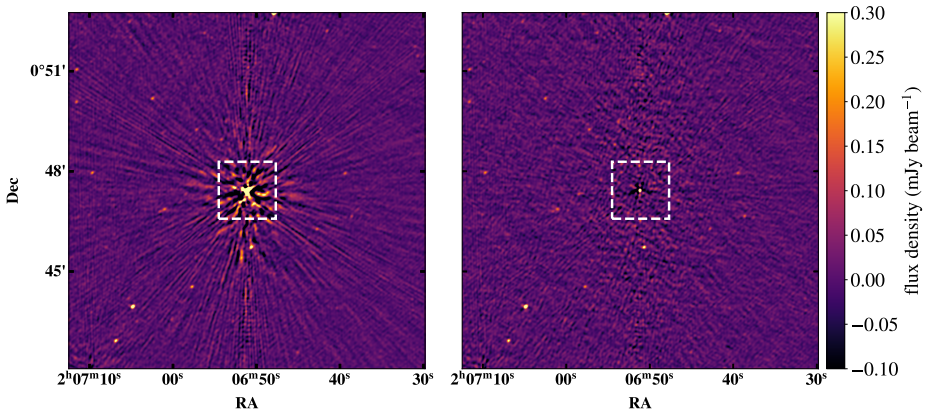
- [uGMRT demonstration / results] In the uGMRT demonstration (results section), claims of 'significantly flattened backgrounds' and 'improving image fidelity and faint-source detectability' rest only on qualitative before-and-after images. No numerical metrics such as dynamic-range improvement factors, residual RMS values, or source-detection statistics are reported, leaving the magnitude of the improvement unquantified.
- [Peeling framework and sequential application] The central claim that sequential peeling for multiple bright sources does not introduce new systematics or cumulative flux biases is unsupported by independent tests. No injected-source simulations, closure-quantity checks, or residual statistics after the second or third peel are presented to verify that model errors do not produce over-subtraction or artifact re-introduction.
minor comments (2)
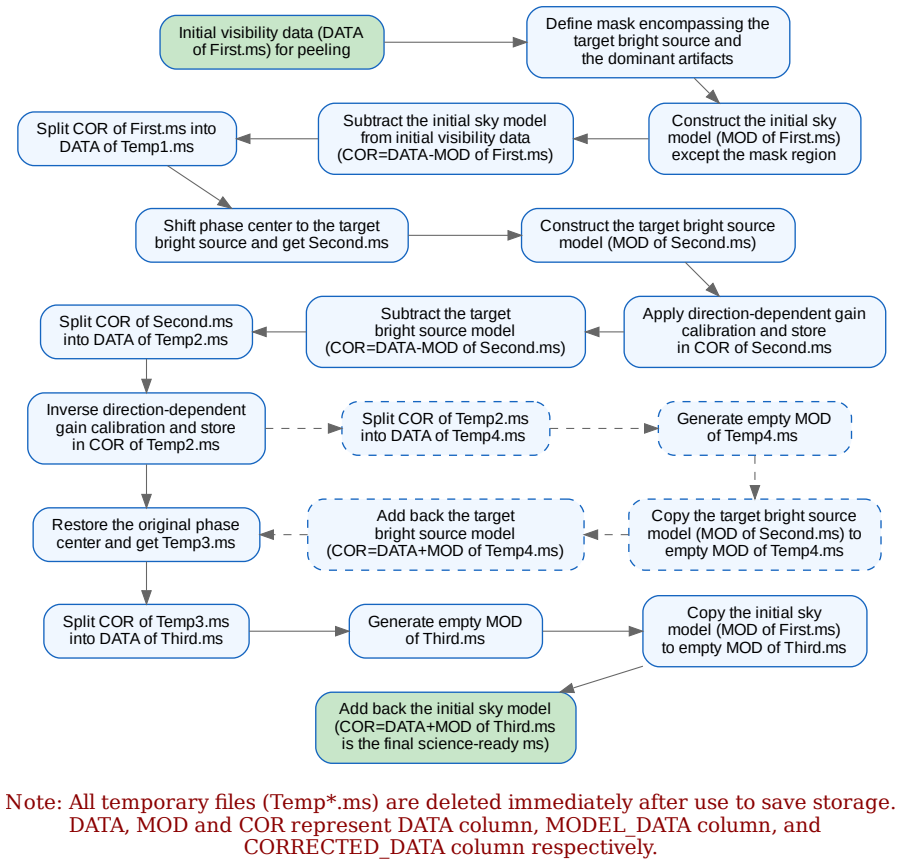
- [Abstract and methods] The abstract and introduction refer to an 'optimized model-restoration strategy' without a clear algorithmic description or comparison to standard peeling; a short pseudocode block or flowchart would improve clarity.
- [Figures] Figure captions for the before-and-after images should explicitly state the exact imaging parameters (weighting, cleaning thresholds) used in each panel to allow direct comparison.
Simulated Author's Rebuttal
We thank the referee for their constructive comments and positive assessment of the framework's potential utility. We address the two major comments below, agreeing that additional quantification and validation will strengthen the manuscript, and we outline the specific revisions planned.
read point-by-point responses
-
Referee: [uGMRT demonstration / results] In the uGMRT demonstration (results section), claims of 'significantly flattened backgrounds' and 'improving image fidelity and faint-source detectability' rest only on qualitative before-and-after images. No numerical metrics such as dynamic-range improvement factors, residual RMS values, or source-detection statistics are reported, leaving the magnitude of the improvement unquantified.
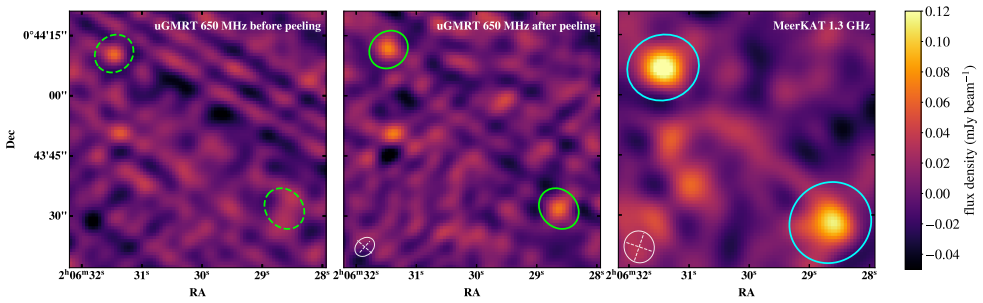
Authors: We agree that the current presentation relies primarily on visual comparison and that quantitative metrics would provide a clearer measure of the improvement. In the revised manuscript we will add explicit measurements of the background RMS (computed in source-free regions) before and after peeling, the achieved dynamic-range ratio for the field, and the number of sources detected above a fixed signal-to-noise threshold in the original versus peeled images. These statistics will be reported in the results section together with a brief discussion of how they support the claims of improved faint-source detectability. revision: yes
-
Referee: [Peeling framework and sequential application] The central claim that sequential peeling for multiple bright sources does not introduce new systematics or cumulative flux biases is unsupported by independent tests. No injected-source simulations, closure-quantity checks, or residual statistics after the second or third peel are presented to verify that model errors do not produce over-subtraction or artifact re-introduction.
Authors: We acknowledge that the manuscript currently demonstrates sequential peeling only on real data and does not include dedicated validation tests. In the revision we will add a short subsection presenting results from injected-source simulations performed on the same uGMRT visibility data. These simulations will quantify flux recovery accuracy and residual statistics after each successive peel, and will be used to verify that no significant over-subtraction or new direction-dependent artifacts are introduced. We will also report closure-phase and closure-amplitude statistics on the residual visibilities after the second and third peels to address potential cumulative biases. revision: yes
Circularity Check
No circularity: software framework and empirical demonstration are self-contained
full rationale
The paper describes a Python-based peeling framework built on standard CASA tasks for direction-dependent calibration and bright-source subtraction in radio interferometry. It reports empirical results from applying this workflow to uGMRT 650 MHz data, showing reduced background noise and improved faint-source detectability. No derivation chain, first-principles predictions, or equations are presented that could reduce by construction to fitted inputs or self-referential definitions. Claims rest on observable outcomes of the implemented procedure rather than any tautological loop or renamed fit. The work is therefore self-contained against external benchmarks with no load-bearing self-citation or ansatz smuggling.
Axiom & Free-Parameter Ledger
Reference graph
Works this paper leans on
-
[1]
Thompson, A. R., Moran, J. M., & Swenson, George W., J. 2017, Interferometry and Synthesis in Radio Astronomy (Springer Cham)
work page 2017
-
[2]
van Haarlem, M. P., Wise, M. W., Gunst, A. W., et al. 2013. LOFAR: The LOw-Frequency ARray. Astronomy and Astrophysics,556, A2
work page 2013
-
[3]
Dzib, S. A., & Jaron, F. 2025. Constraining the nature and Galactic origin of the Be binary MWC 656: New insights from VLA, Gaia, and Fermi-LAT.Astronomy and Astrophysics,704, A139
work page 2025
- [4]
-
[5]
The LOFAR Two-metre Sky Survey: Deep Fields data release 1. V. Survey description, source classifications, and host galaxy properties.Monthly Notices of the RAS,523(2), 1729–1755
-
[6]
Perley, R. A. 1999. High Dynamic Range Imaging. In Astronomical Society of the Pacific Conference Series
work page 1999
-
[7]
Smirnov, O. M. 2011. Revisiting the radio interfer- ometer measurement equation. I. A full-sky Jones formalism.Astronomy and Astrophysics,527, A106
work page 2011
-
[8]
Noordam, J. E. 2004. LOFAR calibration challenges. In Society of Photo-Optical Instrumentation Engineers (SPIE) Conference Series. DOI:10.1117/12.544262
-
[9]
T., van der Tol, S., Cotton, W
Intema, H. T., van der Tol, S., Cotton, W. D., et al. 2009. Ionospheric calibration of low frequency radio interferometric observations using the peel- ing scheme. I. Method description and first results. Astronomy and Astrophysics,501(3), 1185–1205
work page 2009
-
[10]
Cotton, W. D. 2021. Multisource Peeling in Obit
work page 2021
-
[11]
Williams, P. K. G., Allers, K. N., Biller, B. A., et al
-
[12]
A Tool and Workflow for Radio Astronomical “Peeling” in CASA.Research Notes of the American Astronomical Society,3(7), 110
-
[13]
Cai, Z., Fan, X., Peirani, S., et al. 2016. Mapping the Most Massive Overdensity Through Hydrogen (MAMMOTH) I: Methodology.The Astrophysical Journal,833(2), 135
work page 2016
-
[14]
Cai, Z., Fan, X., Bian, F., et al. 2017. Mapping the Most Massive Overdensities through Hydrogen (MAMMOTH). II. Discovery of the Extremely Massive Overdensity BOSS1441 at z = 2.32.The Astrophysical Journal,839(2), 131
work page 2017
-
[15]
Zheng, X. Z., Cai, Z., An, F. X., et al. 2021. MAMMOTH: confirmation of two massive galaxy overdensities at z = 2.24 with Hαemitters.Monthly Notices of the RAS,500(4), 4354–4364
work page 2021
-
[16]
Zhang, Y., Zheng, X. Z., Shi, D. D., et al. 2022. Submillimetre galaxies in two massive protoclusters at z = 2.24: witnessing the enrichment of extreme starbursts in the outskirts of HAE density peaks. Monthly Notices of the RAS,512(4), 4893–4908
work page 2022
-
[17]
Shi, D. D., Cai, Z., Fan, X., et al. 2021. Spectroscopic Confirmation of Two Extremely Massive Protoclusters, BOSS1244 and BOSS1542, at z = 2.24.The Astrophysical Journal,915(1), 32
work page 2021
-
[18]
Liang, Y., Kashikawa, N., Cai, Z., et al. 2021. Statistical Correlation between the Distribution of LyαEmitters and Intergalactic Medium H I at z∼ 2.2 Mapped by the Subaru/Hyper Suprime-Cam.The Astrophysical Journal,907(1), 3
work page 2021
-
[19]
Liang, Y., Ouchi, M., Sun, D., et al. 2025. Cosmic Himalayas: The Highest Quasar Density Peak Identified in a 10,000 deg 2 Sky with Spatial Discrepancies between Galaxies, Quasars, and IGM H I.The Astrophysical Journal,986(1), 60
work page 2025
-
[20]
CASA Team, Bean, B., Bhatnagar, S., et al
-
[21]
CASA, the Common Astronomy Software Applications for Radio Astronomy.Publications of Astronomical Society of the Pacific,134(1041), 114501
-
[22]
V., Taylor, R., Sekhar, S., et al
Lal, D. V., Taylor, R., Sekhar, S., et al. 2025. The superMIGHTEE Project: MeerKAT and GMRT Together to Unveil the Deep Radio Sky.The Astrophysical Journal,991(1), 9
work page 2025
-
[23]
Kale, R., & Ishwara-Chandra, C. H. 2021. CAPTURE: a continuum imaging pipeline for the uGMRT.Experimental Astronomy,51(1), 95–108
work page 2021
-
[24]
Dokara, R., Roy, N., Menten, K., et al. 2023. Metrewave Galactic Plane with the uGMRT (MeGaPluG) Survey: Lessons from the pilot study. Astronomy and Astrophysics,678, A72
work page 2023
-
[25]
Sinha, A., & Datta, A. 2023. Detailed study of the Bo¨ otes field using 300-500 MHz uGMRT observa- tions: source properties and radio-infrared correla- tions.Monthly Notices of the RAS,525(4), 5311– 5327
work page 2023
-
[26]
Salunkhe, S., Santra, R., & Kale, R. 2025. Discovery of a Radio Megahalo in the Cluster PLCKG287.0+32.9 Using the uGMRT.The Astrophysical Journal (Letters),984(1), L26
work page 2025
-
[27]
Bhatnagar, S., Cornwell, T. J., Golap, K., et al. 2008. Correcting direction-dependent gains in the deconvo- lution of radio interferometric images.Astronomy and Astrophysics,487(1), 419–429
work page 2008
-
[28]
Mohan, N., & Rafferty, D. 2015, PyBDSF: Python Blob Detection and Source Finder, ascl:1502.007 Astronomical Techniques and Instruments,X(X), xx–xx, 202613
work page 2015
discussion (0)
Sign in with ORCID, Apple, or X to comment. Anyone can read and Pith papers without signing in.