A Comprehensive Atmospheric Retrieval Analysis of 22 James Webb Space Telescope Spectral Energy Distributions of Cool Brown Dwarfs
Pith reviewed 2026-05-10 19:22 UTC · model grok-4.3
The pith
Retrieval analysis of JWST spectra from 22 cool brown dwarfs shows H2O and CH4 abundances trace bulk oxygen and carbon content.
A machine-rendered reading of the paper's core claim, the machinery that carries it, and where it could break.
Core claim
Through retrievals on the first continuous 0.95-12 um JWST spectra of 22 nearby late-T and Y brown dwarfs, the volume mixing ratios of H2O and CH4 are positively correlated and used to derive atmospheric metallicity that itself correlates with those ratios, allowing effective measurement of bulk (O/H) and (C/H); tentative PH3 detections in roughly half the objects point to vertical mixing or non-equilibrium chemistry, while retrieved thermal profiles show systematic offsets from Elf-Owl forward models likely due to differences in chemistry treatment.
What carries the argument
The uniform atmospheric retrieval framework that solves simultaneously for parameterized thermal profiles and volume mixing ratios of H2O, CH4, CO, CO2, NH3, H2S, K, Na, and PH3 from the spectra.
Load-bearing premise
The chosen atmospheric model and its opacity sources plus chemistry options fully capture the physics needed to interpret the spectra without large unmodeled effects or parameter degeneracies.
What would settle it
Finding no positive correlation between retrieved H2O/CH4 abundances and derived metallicity in an independent sample of similar brown dwarfs observed with the same wavelength coverage.
Figures


read the original abstract
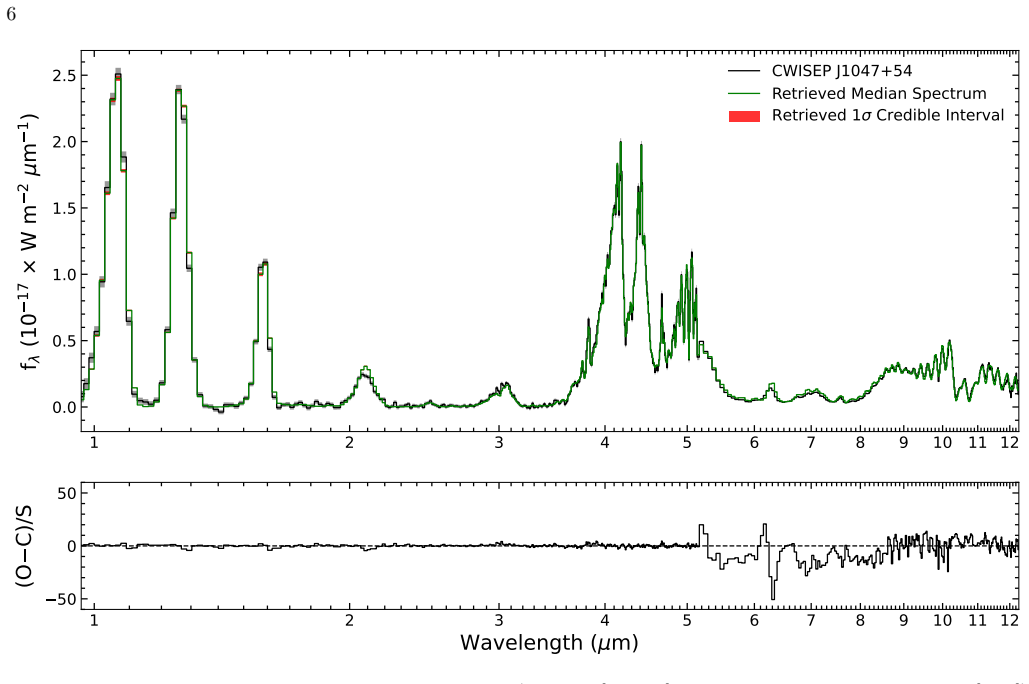
We present a uniform atmospheric retrieval analysis of 22 late-T and Y-type brown dwarfs within 20 pc, observed with the James Webb Space Telescope NIRSpec PRISM and MIRI LRS. This dataset provides the first continuous 0.95-12 um spectroscopic coverage of late-T and Y-type brown dwarfs, which in turn enables precise constraints on their thermal structures and volume mixing ratios (VMRs) of H2O, CH4, CO, CO2, NH3, H2S, K, Na, and PH3. We find positive correlations between the VMR of H2O and CH4, and CO and CO2, consistent with thermochemical equilibrium chemistry. Using the VMRs, we derive atmospheric metallicity, which is positively correlated with H2O and CH4, showing H2O and CH4 trace oxygen and carbon content, respectively, allowing us to effectively measure (O/H)bulk and (C/H)bulk. We also report tentative PH3 detections in roughly half the sample, suggesting potential vertical mixing or non-equilibrium chemistry. Apart from chemical properties, we retrieve masses and radii spanning approximately 6-77 M_Jup and 0.66-1.53 R_Jup, respectively. We compare the derived log10(g) values of about 4-5.5 cm s^-2 and Teff values of about 350-1100 K with Sonora Bobcat evolutionary models and find an age range of 0.4 to 10 Gyr across the sample. Comparing our retrieved thermal profiles with the Elf-Owl forward-model thermal profiles, we find a systematic difference between the two, likely arising from differences in chemistry treatment.
Editorial analysis
A structured set of objections, weighed in public.
Referee Report
Summary. The manuscript presents a uniform atmospheric retrieval analysis of continuous 0.95-12 μm JWST NIRSpec PRISM and MIRI LRS spectra for 22 late-T and Y-type brown dwarfs. It reports positive correlations between the retrieved volume mixing ratios (VMRs) of H2O and CH4 and of CO and CO2, interprets these as signatures of thermochemical equilibrium chemistry, derives atmospheric metallicities from the VMRs that correlate with H2O and CH4 (taken to trace bulk (O/H) and (C/H)), reports tentative PH3 detections in roughly half the sample, retrieves masses (6-77 M_Jup) and radii (0.66-1.53 R_Jup), compares log g and T_eff to Sonora Bobcat evolutionary models to infer ages (0.4-10 Gyr), and notes a systematic offset between retrieved thermal profiles and Elf-Owl forward-model profiles attributed to differences in chemistry treatment.
Significance. If the VMR correlations and metallicity derivations prove robust, the work supplies one of the largest uniform JWST-based constraints on the atmospheric chemistry and thermal structures of cool brown dwarfs, with direct implications for equilibrium vs. non-equilibrium processes, vertical mixing, and the use of atmospheric abundances to infer bulk composition. The broad wavelength coverage and sample size are clear strengths that could benchmark retrieval methods for future exoplanet atmosphere studies.
major comments (2)
- [Abstract and results] Abstract and results: The central claims rest on the positive H2O–CH4 and CO–CO2 VMR correlations being physical signatures of equilibrium chemistry and on using those VMRs to derive bulk metallicities. However, the retrieval treats thermal-profile parameters as free alongside the nine VMRs, mass, and radius, and the manuscript itself reports a systematic difference between the retrieved thermal profiles and Elf-Owl forward-model profiles. No test is described that demonstrates the correlations survive under alternative thermal-profile assumptions or on synthetic spectra with injected equilibrium chemistry; without such a test the correlations could be induced by temperature–abundance trade-offs rather than thermochemistry.
- [Methods/results] Methods/results: The abstract and summary provide no quantitative fit statistics (e.g., reduced χ², posterior predictive checks, or Bayesian evidence ratios), no error budgets on the reported correlations, and no validation against synthetic data with known input VMRs and thermal profiles. Given the large number of free parameters, these omissions make it impossible to assess whether the derived correlations and metallicities are statistically significant or affected by unmodeled degeneracies.
minor comments (2)
- [Abstract] The abstract states 'tentative PH3 detections in roughly half the sample' but does not specify the detection threshold (e.g., 3σ or 5σ) or the exact number of objects.
- [Results] The comparison of retrieved log g and T_eff to Sonora Bobcat models for age estimation would benefit from an explicit description of the matching procedure and any interpolation or uncertainty propagation used.
Simulated Author's Rebuttal
We thank the referee for their thorough and constructive review of our manuscript. We appreciate the emphasis on validating the robustness of the reported VMR correlations and on providing quantitative assessments of fit quality. We address each major comment below and outline planned revisions to strengthen the paper.
read point-by-point responses
-
Referee: [Abstract and results] The central claims rest on the positive H2O–CH4 and CO–CO2 VMR correlations being physical signatures of equilibrium chemistry and on using those VMRs to derive bulk metallicities. However, the retrieval treats thermal-profile parameters as free alongside the nine VMRs, mass, and radius, and the manuscript itself reports a systematic difference between the retrieved thermal profiles and Elf-Owl forward-model profiles. No test is described that demonstrates the correlations survive under alternative thermal-profile assumptions or on synthetic spectra with injected equilibrium chemistry; without such a test the correlations could be induced by temperature–abundance trade-offs rather than thermochemistry.
Authors: We agree that explicit validation tests are necessary to rule out temperature-abundance degeneracies as the source of the observed correlations. While the retrieval allows independent thermal profiles for each object and the correlations appear consistently across the 22-object sample, we did not perform the specific synthetic-data injections or alternative parameterization tests in the submitted version. In the revised manuscript we will add (i) retrievals on synthetic spectra generated with equilibrium chemistry and known thermal profiles to verify recovery of the input VMR correlations, and (ii) a sensitivity analysis using alternative thermal-profile parameterizations (e.g., fixed lapse rates or Elf-Owl-inspired priors) to confirm the correlations persist. We will also expand discussion of how the reported systematic offset with Elf-Owl profiles may affect abundance retrievals. revision: yes
-
Referee: [Methods/results] The abstract and summary provide no quantitative fit statistics (e.g., reduced χ², posterior predictive checks, or Bayesian evidence ratios), no error budgets on the reported correlations, and no validation against synthetic data with known input VMRs and thermal profiles. Given the large number of free parameters, these omissions make it impossible to assess whether the derived correlations and metallicities are statistically significant or affected by unmodeled degeneracies.
Authors: We acknowledge that the submitted manuscript lacks explicit quantitative fit metrics and validation statistics. In the revision we will report reduced χ² values for each object, include posterior predictive checks for a representative subset, and provide uncertainty estimates on the correlation coefficients (e.g., via bootstrap resampling or posterior sampling). We will also incorporate the synthetic-data validation described in the response to the first comment. Bayesian evidence ratios are computationally prohibitive for the full retrieval grid but can be approximated via nested sampling on a few test cases if space permits; otherwise we will note this limitation explicitly. revision: yes
Circularity Check
Metallicity derived from VMRs renders its reported correlation with H2O/CH4 VMRs tautological by construction
specific steps
-
self definitional
[Abstract]
"Using the VMRs, we derive atmospheric metallicity, which is positively correlated with H2O and CH4, showing H2O and CH4 trace oxygen and carbon content, respectively, allowing us to effectively measure (O/H)bulk and (C/H)bulk."
Atmospheric metallicity is explicitly constructed from the retrieved VMRs of H2O and CH4 (as proxies for bulk O and C content). A positive correlation between this derived metallicity and the input VMRs therefore holds by algebraic construction rather than as an independent result from the data.
full rationale
The paper performs independent retrievals on external JWST spectra for 22 objects, yielding VMRs and thermal profiles that are then compared to external forward models. The inter-VMR correlations (H2O–CH4, CO–CO2) across the sample are empirical and not forced by definition. However, the central claim that derived metallicity correlates positively with H2O and CH4 VMRs reduces directly to the post-processing step that constructs metallicity from those same VMRs as O/C tracers. This is a minor but load-bearing self-definitional element; the remainder of the analysis chain remains independent of the paper's own inputs.
Axiom & Free-Parameter Ledger
free parameters (3)
- Volume mixing ratios (VMRs) for H2O, CH4, CO, CO2, NH3, H2S, K, Na, PH3
- Thermal profile parameters
- Mass and radius
axioms (2)
- domain assumption Thermochemical equilibrium chemistry governs the observed positive correlations between VMR pairs
- domain assumption The retrieval model grid and opacity sources are adequate to produce unbiased VMR and thermal-profile solutions
Reference graph
Works this paper leans on
-
[1]
, " * write output.state after.block = add.period write newline
ENTRY address archivePrefix author booktitle chapter doi edition editor eprint howpublished institution journal key month number organization pages publisher school series title misctitle type volume year version url label extra.label sort.label short.list INTEGERS output.state before.all mid.sentence after.sentence after.block FUNCTION init.state.consts ...
-
[2]
" write newline "" before.all 'output.state := FUNCTION format.url url empty "" new.block "" url * "" * if FUNCTION format.eprint eprint empty "" archivePrefix empty "" archivePrefix "arXiv" = new.block " " eprint * " " * new.block " " eprint * " " * if if if FUNCTION format.doi doi empty "" " " doi * " " * if FUNCTION format.pid doi empty eprint empty ur...
-
[3]
z X oyZO <Zf(Xo ,CtkQ@`Ua2Fe VkQh1M/ +Q oHR.w 0MAώ0OSkApA3
thebibliography [1] 20pt to REFERENCES 6pt =0pt \@twocolumntrue 12pt -12pt 10pt plus 3pt =0pt =0pt =1pt plus 1pt =0pt =0pt -12pt =13pt plus 1pt =20pt =13pt plus 1pt \@M =10000 =-1.0em =0pt =0pt 0pt =0pt =1.0em @enumiv\@empty 10000 10000 `\.\@m \@noitemerr \@latex@warning Empty `thebibliography' environment \@ifnextchar \@reference \@latexerr Missing key o...
discussion (0)
Sign in with ORCID, Apple, or X to comment. Anyone can read and Pith papers without signing in.