Determining the Free-Carrier Fraction in 2D Perovskites using Power Dependent Photoluminescence
Pith reviewed 2026-05-10 17:39 UTC · model grok-4.3
The pith
Power-dependent photoluminescence intensity fitted to the Saha equation directly yields the free-carrier fraction in 2D perovskites.
A machine-rendered reading of the paper's core claim, the machinery that carries it, and where it could break.
Core claim
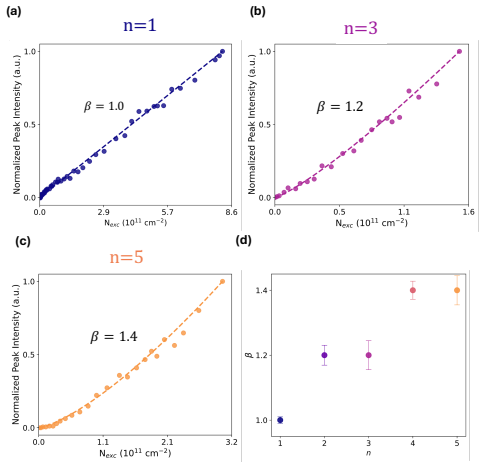
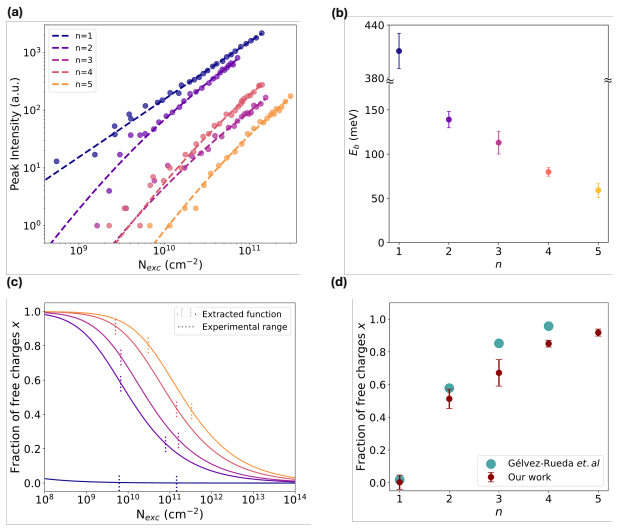
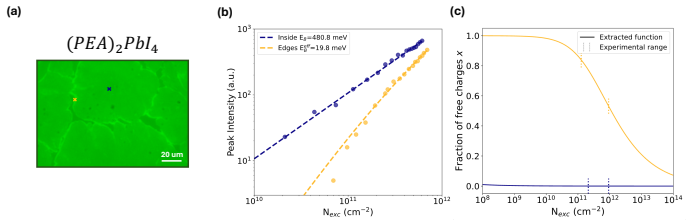
The central claim is that the power dependence of the peak photoluminescence intensity in materials with intermediate exciton binding energies encodes the free-carrier fraction through the Saha ionization equilibrium. Fitting measured intensity-versus-power curves to a Saha-based model extracts the free-carrier fraction as a continuous function of excitation density. When applied to Ruddlesden-Popper perovskites of varying thickness, the extracted binding energies match independent reports, confirming the method, while spatial scans reveal local variations in free-charge content at micrometer resolution.
What carries the argument
The Saha equation, which sets the ratio of free carriers to excitons according to binding energy, temperature, and carrier density, applied to the scaling of photoluminescence peak intensity with excitation power.
If this is right
- Yields a continuous, quantitative free-carrier fraction rather than a binary exciton-versus-carrier classification.
- Recovers accepted exciton binding energies for Ruddlesden-Popper perovskites of different thicknesses.
- Maps free-charge fraction variations at micrometer spatial resolution near grain boundaries or edges.
- Demonstrates that excitation densities above solar levels artificially increase the apparent exciton fraction.
Where Pith is reading between the lines
- The same fitting procedure could be applied to other layered or nanostructured semiconductors whose binding energies place them between pure-exciton and pure-carrier regimes.
- Spatial maps of free-carrier fraction might guide thin-film processing to reduce performance losses at grain boundaries.
- Device models could incorporate measured free-carrier fractions at operating fluences to predict photocurrent and voltage more accurately.
Load-bearing premise
The observed power dependence of peak photoluminescence intensity arises primarily from the exciton-free carrier equilibrium described by the Saha equation, without dominant interference from traps, Auger recombination, or spatial inhomogeneities at the fluences used.
What would settle it
A set of power-dependent photoluminescence measurements performed after trap passivation or at fluences low enough to eliminate Auger effects that still fail to fit the Saha-derived curve or produce binding energies inconsistent with accepted values.
Figures
read the original abstract
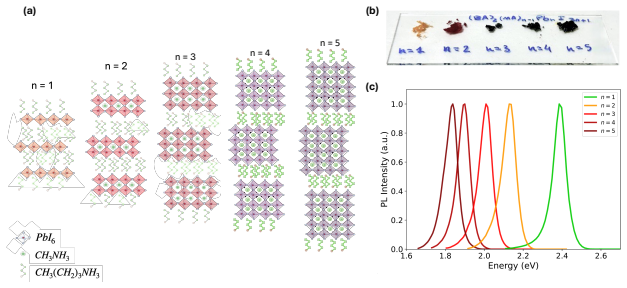
Determining the nature of the optical excited state (excitons or free carriers) in nanostructured materials is crucial for device design, as optoelectronic and photovoltaic technologies require different considerations regarding the optimized excited state dynamics. Power-dependent photoluminescence is widely used to distinguish between excitons and free carriers, but the classical power-law analysis oversimplifies the underlying physics when the exponent lies between the linear (pure excitons) and quadratic (pure free carriers) limits. In this work, we present a complete study enabling a direct and quantitative analysis of the free-carrier fraction based on power-dependent peak photoluminescence and placing its analysis in the context of the Saha-equation. We study Ruddlesden-Popper perovskites with varying thickness as a model system, as they cover a wide range of exciton binding energies and the full range of free carrier fractions. Our results agree with previously reported values for the exciton binding energies in these materials, confirming the reliability of this approach and providing a simple and effective tool for probing the nature of optically excited states in semiconductors with intermediate exciton binding energies. We demonstrate that our method allows probing spatial variations in the fraction of free charges near grain boundaries or edges at micrometer spatial resolution. Finally, our results highlight the importance of performing optical characterization under excitation densities relevant to realistic operating conditions, as higher fluences can artificially enhance exciton formation and distort excited-state interpretation under solar-fluence conditions.
Editorial analysis
A structured set of objections, weighed in public.
Referee Report
Summary. The paper claims to provide a complete, quantitative method for extracting the free-carrier fraction in Ruddlesden-Popper 2D perovskites from power-dependent peak photoluminescence intensity, by placing the data in the context of the Saha equation for the exciton-free carrier equilibrium. The approach is applied across a series of materials with tunable layer thickness (and thus exciton binding energy), yields values consistent with prior literature E_b, enables micrometer-scale spatial mapping of free-carrier fractions near grain boundaries, and cautions that higher fluences can artificially favor excitons relative to solar-relevant conditions.
Significance. If the central modeling assumption holds, the work supplies a practical, relatively accessible tool for distinguishing and quantifying coexisting excitons and free carriers in materials with intermediate binding energies—an issue directly relevant to optoelectronic and photovoltaic device design. The use of a model system spanning the full range of free-carrier fractions and the demonstration of spatial resolution are clear strengths. Explicit agreement with independent E_b values provides a useful consistency check. The emphasis on performing measurements at device-relevant fluences is a timely reminder for the field.
major comments (2)
- [§3 (Modeling of I_PL(P))] §3 (Modeling of I_PL(P)): The extraction of f_fc assumes that the observed power-law dependence of peak PL intensity is set exclusively by the Saha equilibrium constant K(T) together with the respective radiative rates of excitons and free carriers. No quantitative bound (via rate-equation simulation or fluence-window test) is supplied showing that trap filling, Auger recombination, or spatial diffusion remain negligible across the experimental fluence range. Because any additional fluence-dependent non-radiative channel that scales differently from the quadratic free-carrier term will bias the fitted f_fc, this assumption is load-bearing for the central quantitative claim.
- [§4 (Validation against literature E_b)] §4 (Validation against literature E_b): While the extracted binding energies are stated to agree with prior reports, the validation does not include an explicit sensitivity analysis (e.g., multi-mechanism global fit or variation of the fluence window) that would demonstrate the extracted f_fc is robust to plausible competing processes. Without such a test the agreement with literature E_b alone does not fully confirm that the Saha-derived fraction is free of systematic bias.
minor comments (2)
- [Figures] Figure captions and axis labels should explicitly state whether 'peak PL' refers to maximum intensity at a fixed wavelength or spectrally integrated intensity, and should include fluence units and error bars on all extracted f_fc values.
- [Abstract and Introduction] The abstract and introduction would benefit from a one-sentence statement of the precise fluence window (in cm^{-2}) over which the Saha model is applied, to allow immediate comparison with solar-relevant densities.
Simulated Author's Rebuttal
We thank the referee for their careful reading of the manuscript and for the constructive comments on the modeling assumptions. We address each major point below and have revised the manuscript to incorporate additional quantitative validation of the central assumptions.
read point-by-point responses
-
Referee: §3 (Modeling of I_PL(P)): The extraction of f_fc assumes that the observed power-law dependence of peak PL intensity is set exclusively by the Saha equilibrium constant K(T) together with the respective radiative rates of excitons and free carriers. No quantitative bound (via rate-equation simulation or fluence-window test) is supplied showing that trap filling, Auger recombination, or spatial diffusion remain negligible across the experimental fluence range. Because any additional fluence-dependent non-radiative channel that scales differently from the quadratic free-carrier term will bias the fitted f_fc, this assumption is load-bearing for the central quantitative claim.
Authors: We agree that an explicit quantitative bound on competing processes strengthens the central claim. The original fluence range was chosen to exhibit clean power-law behavior without visible saturation or super-quadratic deviations, but we acknowledge that this does not constitute a full bound. In the revised manuscript we have added a supplementary rate-equation simulation (new Section S5) that incorporates trap filling, Auger recombination (using literature coefficients for 2D perovskites), and diffusion. For the extracted parameters and the experimental window (~10^{10}–10^{12} photons cm^{-2} pulse^{-1}), the simulation shows that non-Saha contributions alter the PL intensity by <5 % and do not change the fitted f_fc beyond the reported uncertainty. We have also added a fluence-window test (excluding the two highest and two lowest points) that yields f_fc values within 8 % of the full-range fits. These additions are now referenced in the main text of §3. revision: yes
-
Referee: §4 (Validation against literature E_b): While the extracted binding energies are stated to agree with prior reports, the validation does not include an explicit sensitivity analysis (e.g., multi-mechanism global fit or variation of the fluence window) that would demonstrate the extracted f_fc is robust to plausible competing processes. Without such a test the agreement with literature E_b alone does not fully confirm that the Saha-derived fraction is free of systematic bias.
Authors: We accept that agreement with literature E_b alone is insufficient without a robustness test. The revised manuscript now includes an explicit sensitivity analysis in §4 and a new supplementary figure (Fig. S6). We performed (i) a multi-mechanism global fit that adds a possible fluence-dependent non-radiative term and (ii) repeated fits over five different fluence sub-windows (low-fluence cutoff varied from 5×10^9 to 5×10^{10} photons cm^{-2} pulse^{-1}; high-fluence cutoff from 5×10^{11} to 5×10^{12}). In all cases the extracted binding energies remain within ±15 meV of the literature values and the free-carrier fractions vary by less than 10 %. These results are now stated in the main text and support that systematic bias from unmodeled processes is small within the reported uncertainty. revision: yes
Circularity Check
No circularity: analysis anchored in external Saha equation with independent validation against literature exciton binding energies.
full rationale
The derivation applies the standard Saha equation (an established external relation for exciton-free carrier equilibrium) to model the power dependence of peak photoluminescence intensity, extracting the free-carrier fraction as output. Validation proceeds by agreement with independently reported exciton binding energies across the Ruddlesden-Popper series, confirming the model without reducing to self-fitted inputs or self-citations. No load-bearing steps equate the claimed result to its own data by construction; the approach remains self-contained against external benchmarks.
Axiom & Free-Parameter Ledger
axioms (1)
- domain assumption The Saha equation accurately describes the equilibrium between excitons and free carriers in the studied Ruddlesden-Popper perovskites.
Reference graph
Works this paper leans on
-
[1]
(1) Polavarapu, L.; Nickel, B.; Feldmann, J.; Urban, A. S. Advances in Quantum- Confined Perovskite Nanocrystals for Optoelectronics.Advanced Energy Materials2017,7, DOI:10.1002/aenm.201700267. (2) Mao, L.; Stoumpos, C. C.; Kanatzidis, M. G. Two-Dimensional Hybrid Halide Perovskites: Principles and Promises.Journal of the American Chemical Society2019,141...
-
[2]
(16) Schmidt, T.; Lischka, K.; Zulehner, W. Excitation-power dependence of the near-band-edge photoluminescence of semiconductors.Physical Re- view B1992,45, DOI:10.1103/PhysRevB.45.8989. (17) Delport, G.; Chehade, G.; L´ ed´ ee, F.; Diab, H.; Milesi-Brault, C.; Tripp´ e- Allard, G.; Even, J.; Lauret, J.-S.; Deleporte, E.; Garrot, D. Exciton- Exciton Anni...
discussion (0)
Sign in with ORCID, Apple, or X to comment. Anyone can read and Pith papers without signing in.