SN 2022riv in RX J2129: Discovery, Spectroscopic Classification, and Microlensing of a Strongly Lensed Type Ia Supernova from JWST and HST Observations
Pith reviewed 2026-05-10 15:58 UTC · model grok-4.3
The pith
A strongly lensed Type Ia supernova at z=1.522 yields a cosmology-independent magnification of 5.35 for its final image.
A machine-rendered reading of the paper's core claim, the machinery that carries it, and where it could break.
Core claim
JWST and HST observations classify SN 2022riv as a Type Ia supernova in the last-to-arrive image of a z=1.522 galaxy. The SALT3-NIR fitter applied to its light curve measures a magnification of 5.35±1.01. Four of six lens models predict this value with higher precision than random chance would suggest, and five models give magnifications of 4-7 before microlensing correction. After nominal microlensing adjustment, most align with the measurement while one model remains in tension.
What carries the argument
The SALT3-NIR light-curve fitter applied to the supernova's multi-epoch photometry and spectroscopy to extract magnification.
If this is right
- The measured magnification constrains the mass distribution in the foreground cluster RX J2129.
- Microlensing must be modeled to reconcile lens predictions in high stellar-density regions near the brightest cluster galaxy.
- Multiple lens models can be tested for consistency using lensed supernovae as standard candles.
- The same method can be applied to future lensed Type Ia events for independent checks on strong-lensing models.
Where Pith is reading between the lines
- This measurement provides a test case for whether microlensing predictions improve agreement among different lens modeling techniques in dense cluster environments.
- Repeated applications to other lensed supernovae could help identify systematic differences between lens models without assuming a cosmology.
- The location's high stellar density offers a natural laboratory for studying how microlensing affects supernova light curves in real observations.
Load-bearing premise
The SALT3-NIR light-curve models accurately represent the supernova behavior without significant bias from microlensing or other systematics, and the spectroscopic classification as Type Ia is unambiguous.
What would settle it
An independent magnification estimate from time-delay measurements between the supernova images or from another lensing method that falls well outside the 4.34-6.36 range would falsify the reported value.
Figures




read the original abstract
The multiply imaged SN 2022riv was discovered through a search of galaxy cluster fields as part of a Hubble Space Telescope (HST) SNAP program to find highly magnified stars. The supernova (SN) was detected in the last-to-arrive image of a galaxy at redshift $z=1.522$ strongly lensed by the foreground galaxy cluster RX J2129.7+0005. Follow up James Webb Space Telescope (JWST) NIRSpec G140M and PRISM spectroscopy yields a Type Ia SN classification. Using the SALT3-NIR light-curve fitter, we obtain a cosmology-independent measurement of the magnification of $5.35\pm1.01$ for the last-to-arrive image of the SN, with multiple SALT SN spectral time-series models yielding consistent constraints. The last-to-arrive image of SN 2022riv we detect appeared adjacent to the brightest cluster galaxy (BCG) at a location with an exceptionally high stellar mass density ($\sim 1-2$ dex higher than that of SN Refsdal), where microlensing is expected to introduce a 20-50% modulation of the magnification. Analyzing six independent lens models of the cluster, we find that four predict the magnification with much greater precision ($p < 0.05$) than would be expected by random chance, given the large effect anticipated from microlensing. Five models yield magnifications of roughly $4-7$ (within $1\sigma$) prior to accounting for microlensing, whereas HoliGRALE favors a significantly higher value of $15.39 \pm 0.85$. After incorporating nominal microlensing, the HoliGRALE prediction is within $1\sigma$ tension with our measurement. A companion paper (Dalrymple et al.) will present constraints on the relative time delay of the image that arrived earlier.
Editorial analysis
A structured set of objections, weighed in public.
Referee Report
Summary. The manuscript reports the discovery of SN 2022riv, a multiply imaged Type Ia supernova at z=1.522 in the lensing cluster RX J2129.7+0005, identified via HST SNAP observations and classified with JWST NIRSpec spectroscopy. The central result is a cosmology-independent magnification measurement of 5.35±1.01 for the last-to-arrive image, obtained by fitting its light curve with SALT3-NIR (and variants), with comparisons to six independent lens models and discussion of microlensing given the high stellar density environment near the BCG.
Significance. If the magnification measurement holds after addressing potential systematics, the result supplies a valuable independent anchor for cluster lens models and demonstrates the utility of JWST for time-domain lensing studies. The consistency across multiple SALT spectral templates and the explicit comparison to lens predictions (including nominal microlensing adjustments) are strengths, as is the placement in a high-magnification stellar-density regime that tests microlensing expectations.
major comments (2)
- [§3 (Light-curve analysis and SALT3-NIR fitting)] §3 (Light-curve analysis and SALT3-NIR fitting): The magnification 5.35±1.01 is derived under the assumption that the observed photometry is a constant scalar multiple of the standard Type Ia template. However, the location has stellar mass density 1-2 dex higher than SN Refsdal, with expected microlensing modulation of 20-50%. Time-varying microlensing (source motion across caustics or differential magnification across the photosphere) would distort light-curve shape parameters (stretch x1 and color c) recovered by SALT3-NIR in addition to amplitude, directly biasing the quoted value. The reported uncertainty (~19%) is comparable to the microlensing range, yet no time-dependent microlensing model or additional systematic term is included in the fit.
- [§4 (Lens model comparison)] §4 (Lens model comparison): Four models are stated to predict magnifications of 4-7 (within 1σ of the measurement) prior to microlensing, with a p<0.05 claim for greater precision than random. After nominal microlensing the HoliGRALE value (15.39±0.85) is brought into agreement. It is unclear how the nominal microlensing correction is computed or whether it accounts for shape distortions in the photometry rather than pure amplitude scaling; without this, the tension assessment and statistical claim on model precision are not fully supported.
minor comments (3)
- [Abstract and §2 (Observations)] The abstract and methods sections provide limited information on JWST NIRSpec data reduction, HST photometry extraction, and any pre-fitting corrections; explicit description of these steps (including any host subtraction or calibration) would allow better evaluation of photometric systematics.
- [§3 (Light-curve analysis)] The claim of consistency across multiple SALT SN spectral time-series models would be strengthened by reporting the specific models used, the range of recovered parameters (x0, x1, c), and quantitative measures of agreement (e.g., Δχ² or parameter covariance).
- [Figures and Tables] Figure captions and tables presenting the light-curve fits should explicitly note whether microlensing is assumed constant or time-varying, and include residual plots to illustrate any unmodeled structure.
Simulated Author's Rebuttal
We thank the referee for the constructive comments. We address each major point below and have revised the manuscript accordingly to strengthen the analysis and clarify the methods.
read point-by-point responses
-
Referee: The magnification 5.35±1.01 is derived under the assumption that the observed photometry is a constant scalar multiple of the standard Type Ia template. However, the location has stellar mass density 1-2 dex higher than SN Refsdal, with expected microlensing modulation of 20-50%. Time-varying microlensing (source motion across caustics or differential magnification across the photosphere) would distort light-curve shape parameters (stretch x1 and color c) recovered by SALT3-NIR in addition to amplitude, directly biasing the quoted value. The reported uncertainty (~19%) is comparable to the microlensing range, yet no time-dependent microlensing model or additional systematic term is included in the fit.
Authors: We agree that time-varying microlensing could in principle distort the recovered shape parameters x1 and c, introducing a bias beyond simple amplitude scaling. Our SALT3-NIR fits yield consistent magnification values across multiple independent spectral templates, which provides some empirical support for the robustness of the result. However, we acknowledge that no explicit time-dependent microlensing model was included. In the revised manuscript we have added an explicit discussion of this limitation in §3 and incorporated an additional systematic uncertainty of 0.4 mag (corresponding to ~20% in flux) into the final error budget to reflect the expected microlensing modulation range, increasing the total uncertainty to ±1.3. revision: yes
-
Referee: Four models are stated to predict magnifications of 4-7 (within 1σ of the measurement) prior to microlensing, with a p<0.05 claim for greater precision than random. After nominal microlensing the HoliGRALE value (15.39±0.85) is brought into agreement. It is unclear how the nominal microlensing correction is computed or whether it accounts for shape distortions in the photometry rather than pure amplitude scaling; without this, the tension assessment and statistical claim on model precision are not fully supported.
Authors: The nominal microlensing correction applied to the HoliGRALE prediction is a simple multiplicative scaling factor (median value ~0.4) drawn from the 20-50% modulation range expected at the high stellar-density location; this was intended as a first-order amplitude adjustment only. We recognize that the original text did not fully detail the computation or the statistical test underlying the p<0.05 claim. In the revised §4 we have expanded the description to specify the scaling method, to note that shape distortions are not modeled, and to provide the explicit procedure used for the precision test (comparison of model scatter against the measurement uncertainty after folding in the microlensing variance). These changes support the tension assessment while making the limitations transparent. revision: yes
Circularity Check
No significant circularity; magnification from external template fit
full rationale
The central result (magnification 5.35±1.01) is obtained by applying the standard SALT3-NIR fitter to observed JWST/HST photometry of the last image, using independent Type Ia spectral time-series templates. No paper-defined quantity is substituted for an input or output; the fit is a direct scaling of external models to data. Lens-model comparisons and microlensing discussion are post-hoc and do not enter the primary measurement. Multiple template variants are used only for robustness, not to define the result. The derivation chain is therefore self-contained against external benchmarks and does not reduce to self-definition, fitted-input renaming, or self-citation load-bearing.
Axiom & Free-Parameter Ledger
axioms (2)
- domain assumption Type Ia supernovae have sufficiently consistent intrinsic properties to allow light-curve fitting for magnification inference
- domain assumption The detected transient is strongly lensed by RX J2129.7+0005 producing multiple images
Forward citations
Cited by 1 Pith paper
-
Strong Gravitational Lensing with the James Webb Space Telescope
Strong gravitational lensing paired with JWST enables magnified high-resolution views of distant sources and improved constraints on dark matter.
Reference graph
Works this paper leans on
-
[1]
2025, A&A , 699, A101, doi: 10.1051/0004-6361/202554468 Allingham, J
Acebron, A., Bergamini, P., Rosati, P., et al. 2025, A&A , 699, A101, doi: 10.1051/0004-6361/202554468 Allingham, J. F. V., Zitrin, A., Kokorev, V., et al. 2026, arXiv e-prints, arXiv:2602.14074, doi: 10.48550/arXiv.2602.14074 Anderson, J. 2016, Empirical Models for the WFC3/IR PSF, Instrument Science Report WFC3 2016-12, 42 pages Anderson, J., & King, I....
-
[2]
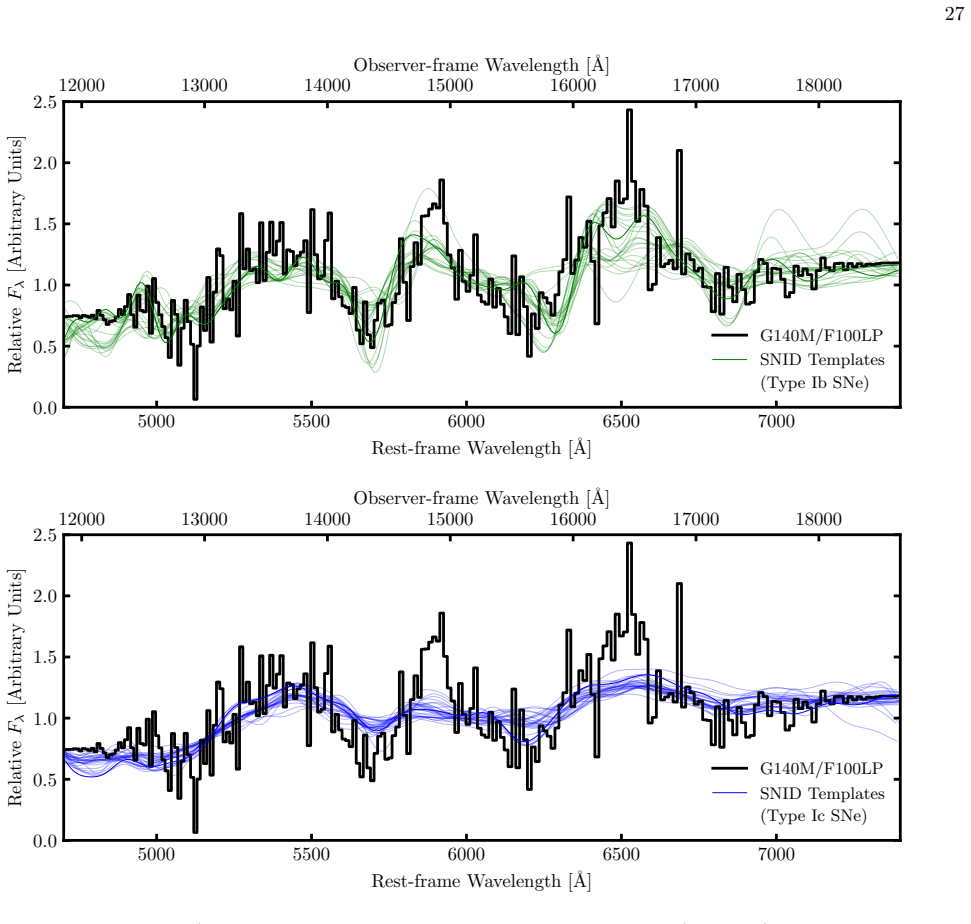
Flattened G140M/100LP spectrum of SN 2022riv used for the SNID analysis (black line). The 23 best-matching SN Ib templates (green curves in the top panel) and 30 best-fitting SN Ic templates (blue curves in the bottom panel) with r × lap > 5 from SNID are shown for comparison. No SN II template matches were found. Arendse, N., M¨ ortsell, E., Weisenbach, ...
-
[3]
Catalog of multiple-image systems identified in the RX J2129 galaxy cluster field based on JWST/NIRCam obser- vations, including their corresponding spectroscopic redshifts. ID R.A. [deg.] Dec. [deg.] zspec 1a 322.4149230 0.0904156 0.6786 1b 322.4151893 0.0889741 0.6786 1c 322.4166530 0.0867530 0.6786 2a 322.4146395 0.0923864 0.9160 2b 322.4162941 0.08810...
work page 2019
-
[4]
Same as in Table 11, but using the Salpeter IMF in the microlensing simulations and the HST WFC3/IR F110W band for synthetic photometry. Model Type Ia SN Explosion Model Double CO WD Merger N100 Sub-Chandrasekhar W7 µ Tension µ Tension µ Tension µ Tension GLAFIC 3.1+3.9 −1.4 0.6σ 3.1+4.5 −1.5 0.5σ 3.0+4.0 −1.4 0.6σ 3.1+4.3 −1.4 0.5σ Chen2020 4.3+10.2 −3.0...
-
[5]
Sys- tem 11 is well localized using JWST/NIRCam observations
Cutout images showing prospective multiple- image candidates in the RX J2129 galaxy cluster field. Sys- tem 11 is well localized using JWST/NIRCam observations. Systems 10 and 12 are not clearly identifiable owing to their extended and complex morphologies. Dashed circles indicate the inferred positions of these systems. Bonvin, V., Tihhonova, O., Millon,...
-
[6]
11, but with synthetic photometric calculations performed using the HST WFC3/IR F110W band
The same as in Fig. 11, but with synthetic photometric calculations performed using the HST WFC3/IR F110W band. 33 Foxley-Marrable, M., Collett, T. E., Vernardos, G., Goldstein, D. A., & Bacon, D. 2018, MNRAS , 478, 5081, doi: 10.1093/mnras/sty1346 Frye, B. L., Pascale, M., Pierel, J., et al. 2024, ApJ , 961, 171, doi: 10.3847/1538-4357/ad1034 Furtak, L. ...
discussion (0)
Sign in with ORCID, Apple, or X to comment. Anyone can read and Pith papers without signing in.