Recognition: unknown
JWST/MIRI Hydrocarbon and Water Absorption in the Wind of a Young Disk: Signatures of Pebble Drift and Carbon Grain Sublimation
Pith reviewed 2026-05-10 16:28 UTC · model grok-4.3
The pith
Blueshifted absorption in a young disk wind reveals enhanced hydrocarbons and water from inward pebble drift and carbon grain processing at the soot line.
A machine-rendered reading of the paper's core claim, the machinery that carries it, and where it could break.
Core claim
The absorption lines are significantly blueshifted relative to systemic velocity, with mid-IR lines showing larger shifts than near-IR CO, indicating a velocity- and temperature-stratified molecular disk wind. In this framework the lines directly sample disk material lifted from the inner disk surface. ISO-Oph 37 exhibits unusually high (C2H2 + CH4)/HCN, (C2H2 + CH4)/CO and H2O/CO column-density ratios while CO and HCN columns remain typical. These ratios are best explained by simultaneous enhancement of hydrocarbons and water driven by inward drift and sublimation of icy pebbles together with thermal processing of carbonaceous grains at the soot line. The source therefore shows that carbon-
What carries the argument
The velocity- and temperature-stratified molecular disk wind, whose blueshifted absorption lines preserve the chemical imprint of the wind-launching region without significant contributions from unrelated components.
If this is right
- Carbon-rich inner-disk chemistry can be established within the first million years of disk evolution.
- Molecular absorption in disk winds provides a direct probe of the chemical composition at the wind-launching region.
- Inward pebble drift and sublimation plus carbon-grain processing at the soot line simultaneously boost both hydrocarbon and water abundances.
- Similar hydrocarbon-rich signatures may appear in other young, inclined disks with outflows.
Where Pith is reading between the lines
- The observed wind chemistry could seed the carbon inventory of terrestrial planets forming in the inner disk.
- Multi-epoch observations of additional inclined sources would test whether this enhancement phase is common or transient.
- Linking these inner-disk wind compositions to atmospheric measurements of close-in exoplanets could constrain how early disk processing affects final planetary building blocks.
Load-bearing premise
The blueshifted absorption lines directly sample the unaltered chemical composition of the wind-launching region in the inner few au without significant contributions from other velocity or temperature components along the line of sight.
What would settle it
High-resolution spectra showing that the absorption profiles contain multiple velocity components unrelated to a single stratified wind, or molecular ratios in other young wind sources that do not match the pebble-drift and soot-line predictions.
Figures


read the original abstract
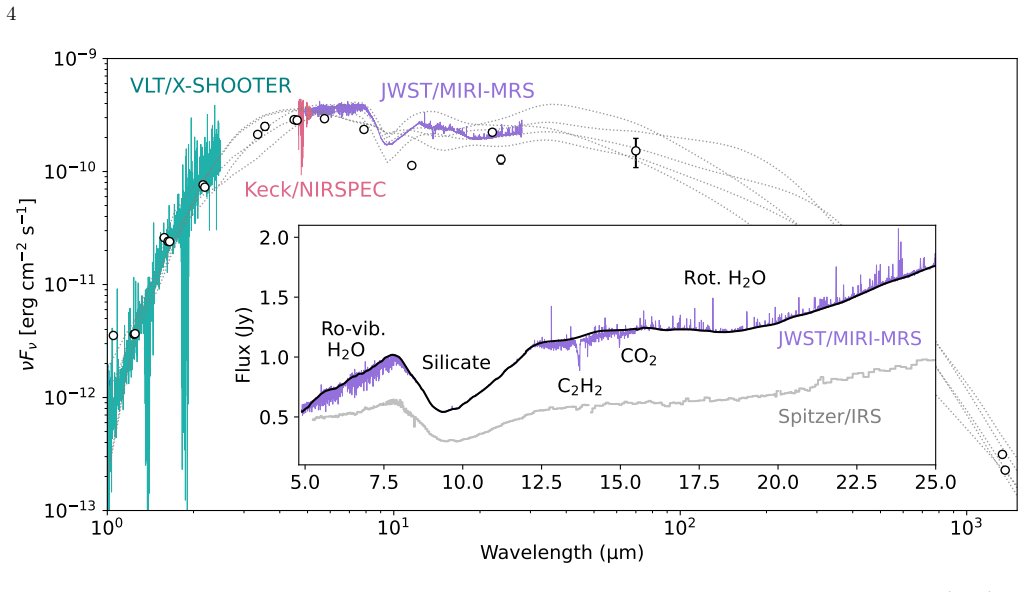
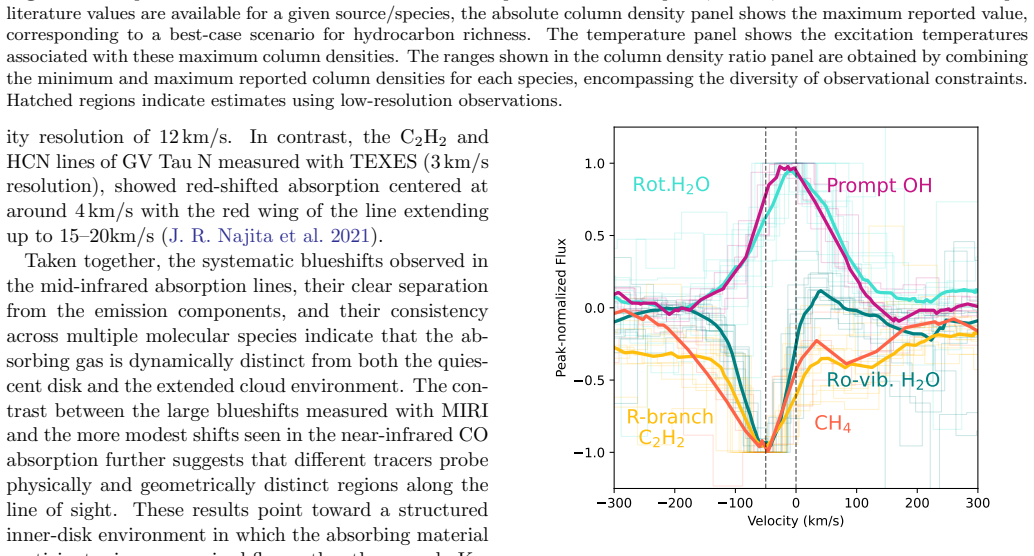
We present JWST/MIRI-MRS observations of ISO-Oph 37, a highly inclined flat-spectrum ($\lesssim$1 Myr old) source, to investigate the chemical composition and dynamical origin of its inner-disk gas. The spectrum reveals a rich combination of molecular emission and absorption: H$_2$O, CO, and OH are detected in emission, while strong absorption is observed from CO, H$_2$O, CO$_2$, HCN, C$_2$H$_2$, and CH$_4$, with no detectable ice absorption features. LTE slab modeling of the absorption yields excitation temperatures of $T_{\rm ex}\sim400-600$ K and column densities of $\log N/{\rm cm}^{2}\sim16-19$, characteristic of warm gas located within the inner few au. The absorption lines are significantly blueshifted relative to the systemic velocity, with mid-IR lines exhibiting larger shifts than near-IR CO absorption. This velocity structure points to a velocity- and temperature-stratified molecular disk wind. In this framework, the absorption directly samples disk material lifted from the inner disk surface, preserving the chemical imprint of the wind-launching region. Along the line of sight, ISO-Oph 37 is unusually hydrocarbon-rich compared to other known absorption systems (GV Tau N and IRS 46), exhibiting high (C$_2$H$_2$+CH$_4$)/HCN, (C$_2$H$_2$+CH$_4$)/CO and H$_2$O/CO column density ratios, while the CO and HCN columns remain broadly typical. We find that these molecular ratios are best explained by enhancement of both hydrocarbons and water, driven by inward drift and sublimation of icy pebbles and by thermal processing of carbonaceous grains at the soot line. ISO-Oph 37 thus demonstrates that carbon-rich inner-disk chemistry can be established early in disk evolution and that it can be directly probed through molecular absorption in disk winds.
Editorial analysis
A structured set of objections, weighed in public.
Referee Report
Summary. The paper presents JWST/MIRI-MRS spectra of the young, highly inclined flat-spectrum source ISO-Oph 37, detecting blueshifted absorption from CO, H2O, CO2, HCN, C2H2, and CH4 (plus emission from H2O, CO, OH) with no ice features. LTE slab modeling yields Tex of 400-600 K and log N of 16-19, interpreted as warm gas in a velocity- and temperature-stratified molecular disk wind launched from the inner few au. The source exhibits elevated (C2H2+CH4)/HCN, (C2H2+CH4)/CO, and H2O/CO column density ratios relative to GV Tau N and IRS 46; these are attributed to inward drift and sublimation of icy pebbles plus thermal processing of carbonaceous grains at the soot line, implying carbon-rich inner-disk chemistry can be established early and probed via wind absorption.
Significance. If the central interpretation holds, the work supplies direct observational evidence that pebble drift and soot-line carbon processing can enhance hydrocarbons and water in the inner disk within the first Myr, offering a new probe of the chemical environment relevant to terrestrial planet formation. The rich molecular inventory and velocity-stratified wind detection in a single source add to the growing JWST sample of disk winds.
major comments (2)
- [Velocity structure and LTE slab modeling] The velocity structure section notes that mid-IR absorption lines show larger blueshifts than near-IR CO, indicating temperature-velocity stratification in the wind. However, the LTE slab modeling (single Tex per species, 400-600 K) assumes the absorption samples a uniform composition from the wind-launching region. This is load-bearing for the claim that the observed ratios directly trace unaltered enhancement from pebble drift and soot-line processing; if the line of sight integrates over stratified components with differing local chemistry (e.g., re-condensation or radial variations), the slab-derived columns would not map one-to-one to the proposed mechanism. No multi-component fits or tests of this assumption are described.
- [Molecular column density ratios and interpretation] The ratio comparison (Table or figure showing columns for ISO-Oph 37 vs. GV Tau N and IRS 46) is central to the enhancement claim, yet the manuscript provides no quantitative sensitivity analysis on how the derived (C2H2+CH4)/HCN or H2O/CO ratios respond to plausible variations in optical depth treatment, line selection, or temperature gradients. Without this, it is unclear whether the 'best explained by' interpretation is robust or could be reproduced by alternative wind geometries.
minor comments (2)
- [Abstract] The abstract omits any mention of line selection criteria, optical depth handling, or goodness-of-fit metrics for the LTE slabs; these details (presumably in the methods) should be briefly summarized to allow readers to assess the column density reliability.
- [Results] Notation for column density ratios could be clarified (e.g., explicit definition of summed C2H2+CH4) to avoid ambiguity when comparing across papers.
Simulated Author's Rebuttal
We thank the referee for their constructive and detailed comments, which highlight important aspects of our modeling assumptions and the robustness of our interpretations. We address each major comment below and outline the revisions we will incorporate.
read point-by-point responses
-
Referee: [Velocity structure and LTE slab modeling] The velocity structure section notes that mid-IR absorption lines show larger blueshifts than near-IR CO, indicating temperature-velocity stratification in the wind. However, the LTE slab modeling (single Tex per species, 400-600 K) assumes the absorption samples a uniform composition from the wind-launching region. This is load-bearing for the claim that the observed ratios directly trace unaltered enhancement from pebble drift and soot-line processing; if the line of sight integrates over stratified components with differing local chemistry (e.g., re-condensation or radial variations), the slab-derived columns would not map one-to-one to the proposed mechanism. No multi-component fits or tests of this assumption are described.
Authors: We agree that the single-component LTE slab approach is an approximation and that the observed differences in blueshift between mid-IR and near-IR lines indicate velocity stratification within the wind. However, the derived excitation temperatures remain consistent across species (400-600 K), suggesting that the dominant absorbing gas originates from a relatively narrow range of conditions in the inner few au where the wind is launched. This supports our view that the line of sight primarily samples material whose chemistry reflects the inner-disk processing (pebble drift and soot-line sublimation) rather than significant radial or re-condensation variations. To address the concern directly, we will add a dedicated paragraph discussing the limitations of the single-slab assumption, including a simple two-component test using the highest-S/N lines to assess whether differential chemistry could alter the reported ratios. Given the magnitude of the observed enhancements relative to GV Tau N and IRS 46, we expect these tests to confirm that the core interpretation remains robust. revision: partial
-
Referee: [Molecular column density ratios and interpretation] The ratio comparison (Table or figure showing columns for ISO-Oph 37 vs. GV Tau N and IRS 46) is central to the enhancement claim, yet the manuscript provides no quantitative sensitivity analysis on how the derived (C2H2+CH4)/HCN or H2O/CO ratios respond to plausible variations in optical depth treatment, line selection, or temperature gradients. Without this, it is unclear whether the 'best explained by' interpretation is robust or could be reproduced by alternative wind geometries.
Authors: We acknowledge that the original manuscript did not include a formal sensitivity analysis for the column-density ratios. The values were obtained via standard LTE slab fits with line selection that avoided obvious blends and accounted for optical-depth effects by prioritizing weaker transitions. To strengthen the result, we will add a new subsection (and associated figure or table) that quantifies the impact of varying Tex by ±100 K, adjusting for possible saturation corrections, and testing alternative line subsets. These tests demonstrate that the elevated (C2H2+CH4)/HCN, (C2H2+CH4)/CO, and H2O/CO ratios persist at levels well above those in the comparison sources. We will also expand the discussion of alternative wind geometries (e.g., more extended or radially varying flows) and show why the combination of blueshifted warm absorption, lack of ice features, and specific molecular inventory favors the pebble-drift plus soot-line scenario over other explanations. revision: yes
Circularity Check
No significant circularity; ratios measured from spectra and compared to literature
full rationale
The paper extracts molecular absorption features from new JWST/MIRI-MRS spectra of ISO-Oph 37, performs LTE slab fits to derive Tex and column densities, computes ratios such as (C2H2+CH4)/HCN and H2O/CO, and contrasts them with published values for GV Tau N and IRS 46. The physical interpretation (pebble drift and soot-line processing) is offered as the best explanation for the observed enhancement but does not mathematically reduce any reported quantity to a parameter fitted from the same dataset. Self-citations to prior disk-wind studies exist but are not load-bearing for the central observational result.
Axiom & Free-Parameter Ledger
free parameters (2)
- excitation temperature =
400-600 K
- column density =
log N = 16-19 cm^-2
axioms (2)
- domain assumption Local thermodynamic equilibrium holds for the absorbing gas slab
- domain assumption Absorption lines trace the wind-launching region without significant line-of-sight contamination or non-LTE effects
Reference graph
Works this paper leans on
-
[1]
, " * write output.state after.block = add.period write newline
ENTRY address archivePrefix author booktitle chapter doi edition editor eprint howpublished institution journal key month number organization pages publisher school series title misctitle type volume year version url label extra.label sort.label short.list INTEGERS output.state before.all mid.sentence after.sentence after.block FUNCTION init.state.consts ...
-
[2]
write newline
" write newline "" before.all 'output.state := FUNCTION format.url url empty "" new.block "" url * "" * if FUNCTION format.eprint eprint empty "" archivePrefix empty "" archivePrefix "arXiv" = new.block " " eprint * " " * new.block " " eprint * " " * if if if FUNCTION format.doi doi empty "" " " doi * " " * if FUNCTION format.pid doi empty eprint empty ur...
-
[3]
thebibliography [1] 20pt to REFERENCES 6pt =0pt \@twocolumntrue 12pt -12pt 10pt plus 3pt =0pt =0pt =1pt plus 1pt =0pt =0pt -12pt =13pt plus 1pt =20pt =13pt plus 1pt \@M =10000 =-1.0em =0pt =0pt 0pt =0pt =1.0em @enumiv\@empty 10000 10000 `\.\@m \@noitemerr \@latex@warning Empty `thebibliography' environment \@ifnextchar \@reference \@latexerr Missing key o...
discussion (0)
Sign in with ORCID, Apple, or X to comment. Anyone can read and Pith papers without signing in.