Estimating effect thresholds and beyond: A flexible framework for multivariate alert detection
Pith reviewed 2026-05-10 14:14 UTC · model grok-4.3
The pith
A GAMLSS parametric model estimates effect alert thresholds in multiple dimensions by fitting to all data and constructing confidence bands or planes.
A machine-rendered reading of the paper's core claim, the machinery that carries it, and where it could break.
Core claim
By fitting a flexible parametric model with GAMLSS, alerts depending on multiple covariates can be estimated even without direct observations at the exact points of interest, with confidence bands for two-dimensional slices or planes for the three-dimensional relationship.
What carries the argument
The GAMLSS (Generalized Additive Models for Location, Scale and Shape) framework, which models the response distribution parameters to capture complex three-dimensional structures and allows construction of confidence bands and planes for the alert thresholds.
Load-bearing premise
That the selected parametric GAMLSS model correctly captures the true data-generating process across the covariate space so that extrapolations remain unbiased.
What would settle it
Compare the model's predicted alert thresholds to those obtained from a separate dense set of measurements at the exact covariate combinations of interest; a significant mismatch would falsify the adequacy of the extrapolation.
Figures


read the original abstract
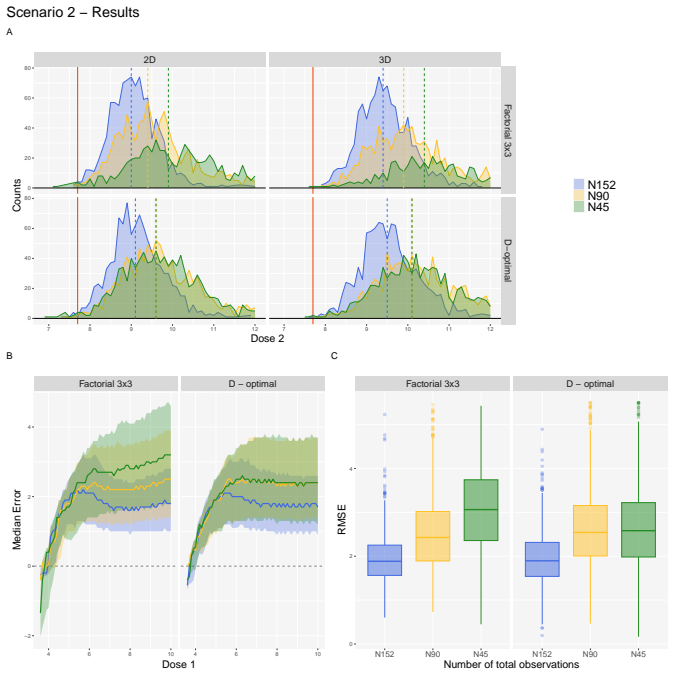
Evaluating the influence of continuous covariates, like exposure time or dose, on a response variable is a pivotal objective in the assessment of a compound's effect, particularly when determining toxicity in pre-clinical research or pharmacokinetics in clinical trials. The determination of an alert, such as the ED50 value, at which a pre-specified threshold of the response variable is crossed, is an important tool for the evaluation process. In practice, response data might be available for combinations of different covariates and the alert depending on both is of interest. In this case, it is crucial to use all available information and extrapolate between cases to ensure the optimal utilization of the data. In this paper, we introduce a parametric approach that allows alerts to be estimated in a multidimensional setting. For time-dose-response data, for instance, alert doses at a given time can be determined, even when there are no measurements available at that exact time. Likewise, it allows estimation of alert times for a given dose. More generally, the method makes it possible to characterize the complete alert relationship between covariates by leveraging all available data. This is achieved by fitting a parametric model and constructing either a confidence band for the two-dimensional curve given for example a fixed time or dose or by constructing a confidence plane for the three-dimensional model fit. The initial model fit is achieved by the flexible framework of Generalized Additive Models for Location, Scale and Shape (GAMLSS), which offers the possibility to account for a plethora of complex three-dimensional data structures. We demonstrate the validity of our approach through a simulation study and present an application to data from a study investigating the relevance of the exposure duration on cytotoxicity in primary human hepatocytes.
Editorial analysis
A structured set of objections, weighed in public.
Referee Report
Summary. The paper proposes a GAMLSS-based parametric framework for estimating multivariate alert thresholds (e.g., ED50 values) in settings such as time-dose-response data. By fitting a single flexible model to all observations, the approach enables extrapolation to unmeasured covariate combinations and constructs either confidence bands around two-dimensional alert curves or confidence planes around three-dimensional alert surfaces. Validity is illustrated through a simulation study and an application to cytotoxicity data in primary human hepatocytes.
Significance. If the GAMLSS model is correctly specified and extrapolation remains valid, the method offers a principled way to pool information across covariate dimensions for threshold estimation, which could improve efficiency in toxicology and pharmacokinetics studies where data are sparse in certain regions. The use of an established GAMLSS framework for this target is a natural extension rather than a circular redefinition.
major comments (2)
- [Simulation study] Simulation study: No diagnostics are reported for GAMLSS fit adequacy (e.g., randomized quantile residuals, worm plots, or out-of-sample predictive checks) in the three-dimensional setting, nor are sensitivity analyses shown for distribution family choice, smoother penalties, or link functions. Without these, it is unclear whether the level-set inversion yielding the alert curve/plane has valid coverage, especially under extrapolation.
- [Application] Application section: The cytotoxicity analysis extrapolates alert times/doses to unmeasured combinations without reporting model-misspecification checks or comparison against nonparametric alternatives (e.g., direct quantile regression surfaces). This leaves open the possibility that apparent alert relationships are driven by parametric assumptions rather than data.
minor comments (2)
- [Abstract] The abstract and introduction would benefit from a brief statement of the precise GAMLSS distribution and smoothing terms ultimately selected for the real-data example.
- [Methods] Notation for the alert surface (e.g., the level-set definition) should be introduced with an equation early in the Methods to clarify the mapping from the fitted GAMLSS parameters to the reported confidence plane.
Simulated Author's Rebuttal
We thank the referee for the constructive comments, which help clarify the presentation of model validation. We address each major point below and indicate the revisions we will make.
read point-by-point responses
-
Referee: [Simulation study] Simulation study: No diagnostics are reported for GAMLSS fit adequacy (e.g., randomized quantile residuals, worm plots, or out-of-sample predictive checks) in the three-dimensional setting, nor are sensitivity analyses shown for distribution family choice, smoother penalties, or link functions. Without these, it is unclear whether the level-set inversion yielding the alert curve/plane has valid coverage, especially under extrapolation.
Authors: We agree that additional diagnostics would improve transparency. In the revised manuscript we will report randomized quantile residuals and worm plots for the three-dimensional GAMLSS fits used in the simulation study. We will also add sensitivity analyses that vary the distribution family, smoother penalties, and link functions, confirming that empirical coverage of the alert thresholds remains close to nominal levels. The existing simulation already demonstrates that the level-set inversion achieves valid coverage when the model is correctly specified, including under extrapolation; the new checks will make this robustness explicit. revision: yes
-
Referee: [Application] Application section: The cytotoxicity analysis extrapolates alert times/doses to unmeasured combinations without reporting model-misspecification checks or comparison against nonparametric alternatives (e.g., direct quantile regression surfaces). This leaves open the possibility that apparent alert relationships are driven by parametric assumptions rather than data.
Authors: We accept that explicit misspecification checks are warranted. The revision will include residual diagnostics and goodness-of-fit assessments for the GAMLSS model fitted to the cytotoxicity data. A direct head-to-head comparison with nonparametric quantile regression surfaces is not straightforward, because the latter does not naturally yield the same alert-threshold inversion or extrapolation capability in three dimensions; we will therefore add a brief discussion of the parametric assumptions justified by the biological context and data range, while acknowledging that the GAMLSS framework is chosen precisely to enable the multivariate extrapolation that is the paper's focus. revision: partial
Circularity Check
No circularity: standard application of external GAMLSS framework to new alert-threshold target
full rationale
The paper's central procedure fits an established GAMLSS model to multivariate response data and then inverts the fitted surface to obtain alert curves or planes with associated confidence bands. No step reduces by construction to a quantity already fitted inside the paper, no parameter is renamed as a prediction, and no load-bearing premise rests on a self-citation chain. The derivation chain therefore consists of external methodology plus ordinary statistical post-processing and remains self-contained.
Axiom & Free-Parameter Ledger
free parameters (1)
- GAMLSS distribution parameters
axioms (1)
- domain assumption Response data can be adequately described by a GAMLSS distribution family across the covariate space
Reference graph
Works this paper leans on
-
[1]
Ameis, L. and M \"o llenhoff, K. (2024). Identification of changes in gene expression. arXiv preprint
work page 2024
-
[2]
o ber, R., Schug, M., Rempel, E., Rahnenf \
Arbo, M., Melega, S., St \"o ber, R., Schug, M., Rempel, E., Rahnenf \"u hrer, J., Godoy, P., Reif, R., Cadenas, C., de Lourdes Bastos , M., et al. (2016). Hepatotoxicity of piperazine designer drugs: up-regulation of key enzymes of cholesterol and lipid biosynthesis. Archives of Toxicology , 90(12):3045--3060
work page 2016
-
[3]
Bornkamp, B., Pinheiro, J., and Bretz, F. (2009). Mcpmod: An r package for the design and analysis of dose-finding studies. Journal of Statistical Software , 29:1--23
work page 2009
-
[4]
Box, G., Jenkins, G., Reinsel, G., and Ljung, G. (2015). Time series analysis: forecasting and control . John Wiley & Sons
work page 2015
-
[5]
Bretz, F., Dette, H., and Pinheiro, J. (2010). Practical considerations for optimal designs in clinical dose finding studies. Statistics in medicine , 29(7-8):731--742
work page 2010
-
[6]
De Bastiani , F., Heller, G., Kneib, T., Mayr, A., Rigby, R., Stasinopoulos, M., et al. (2026). GAMLSS . Accessed February 05, 2026
work page 2026
-
[7]
Delignette-Muller, M.-L., Forfait, C., Billoir, E., and Charles, S. (2011). A new perspective on the Dunnett procedure: Filling the gap between NOEC/LOEC and ECx concepts . Environmental Toxicology and Chemistry , 30(12):2888--2891
work page 2011
-
[8]
Demidenko, E. (2013). Mixed models: theory and applications with R . John Wiley & Sons
work page 2013
-
[9]
Duda, J., Drenda, C., K\"astel, H., Rahnenf\"uhrer, J., and Kappenberg, F. (2023). Benefit of using interaction effects for the analysis of high-dimensional time-response or dose-response data for two-group comparisons. Scientific Reports , 13(1):20804
work page 2023
-
[10]
Duda, J., Hengstler, J., and Rahnenf\"uhrer, J. (2022). td2pll: An intuitive time-dose-response model for cytotoxicity data with varying exposure durations. Computational Toxicology , 23:100234
work page 2022
-
[11]
Efron, B. and Tibshirani, R. (1994). An Introduction to the Bootstrap . CRC Press, 1st ed. edition
work page 1994
-
[12]
Fahrmeir, L., Kneib, T., Lang, S., and Marx, B. (2022). Regression: Models, Methods and Applications . Springer Berlin, Heidelberg, 2nd edition
work page 2022
-
[13]
Fawcett, T. (2006). An introduction to roc analysis. Pattern recognition letters , 27(8):861--874
work page 2006
-
[14]
Ga ecki, A. and Burzykowski, T. (2012). Linear mixed-effects model. In Linear mixed-effects models using R: a step-by-step approach , pages 245--273. Springer
work page 2012
-
[15]
Ghallab, A., Celli \`e re, G., Henkel, S., Driesch, D., Hoehme, S., Hofmann, U., Zellmer, S., Godoy, P., Sachinidis, A., Blaszkewicz, M., et al. (2016). Model-guided identification of a therapeutic strategy to reduce hyperammonemia in liver diseases. Journal of hepatology , 64(4):860--871
work page 2016
-
[16]
Gu, X., Albrecht, W., Edlund, K., Kappenberg, F., Rahnenf \"u hrer, J., Leist, M., Moritz, W., Godoy, P., Cadenas, C., Marchan, R., et al. (2018). Relevance of the incubation period in cytotoxicity testing with primary human hepatocytes. Archives of toxicology , 92(12):3505--3515
work page 2018
-
[17]
Hagemann, N. and M \"o llenhoff, K. (2025). Overcoming model uncertainty—how equivalence tests can benefit from model averaging. Statistics in Medicine , 44(6):e10309
work page 2025
-
[18]
Hothorn, L. (2014). Statistical evaluation of toxicological bioassays - a review. Toxicology Research , 3(6):418--432
work page 2014
-
[19]
Huusari, R., Wang, T., Szedmak, S., Aittokallio, T., and Rousu, J. (2025). Predicting drug combination response surfaces. npj Drug Discovery , 2(1):2
work page 2025
-
[20]
Guidance document on using in vitro data to estimate in vivo starting doses for acute toxicity
ICCVAM (2001). Guidance document on using in vitro data to estimate in vivo starting doses for acute toxicity . Accessed March 18, 2026
work page 2001
-
[21]
Jensen, S., Kluxen, F., and Ritz, C. (2019). A review of recent advances in benchmark dose methodology. Risk Analysis , 39(10):2295--2315
work page 2019
-
[22]
Kappenberg, F., Duda, J., Sch \"u rmeyer, L., G \"u l, O., Brecklinghaus, T., Hengstler, J., Schorning, K., and Rahnenf \"u hrer, J. (2023). Guidance for statistical design and analysis of toxicological dose--response experiments, based on a comprehensive literature review. Archives of Toxicology , 97(10):2741--2761
work page 2023
-
[23]
Kappenberg, F., Grinberg, M., Jiang, X., Kopp-Schneider, A., Hengstler, J., and Rahnenf\"uhrer, J. (2021). Comparison of observation-based and model-based identification of alert concentrations from concentration-expression data. Bioinformatics , 37(14):1990 -- 1996
work page 2021
-
[24]
Lange, M. and Schmidli, H. (2015). Analysis of clinical trials with biologics using dose--time-response models. Statistics in Medicine , 34(22):3017--3028
work page 2015
-
[25]
Lee, S. (2010). Drug interaction: focusing on response surface models. Korean journal of anesthesiology , 58(5):421--434
work page 2010
-
[26]
Loewe, S. (1953). The problem of synergism and antagonism of combined drugs. Arzneimittel-forschung , 3(6):285--290
work page 1953
-
[27]
Manning, C. (2008). Introduction to information retrieval . Syngress Publishing,
work page 2008
-
[28]
Martin-Betancor, K., Ritz, C., Fern \'a ndez-Pi \ n as, F., Legan \'e s, F., and Rodea-Palomares, I. (2015). Defining an additivity framework for mixture research in inducible whole-cell biosensors. Scientific Reports , 5(1):17200
work page 2015
-
[29]
Mokhtari, R., Homayouni, T., Baluch, N., Morgatskaya, E., Kumar, S., Das, B., and Yeger, H. (2017). Combination therapy in combating cancer. Oncotarget , 8(23):38022
work page 2017
-
[30]
M\"ollenhoff, K., Schorning, K., and Kappenberg, F. (2022). Identifying alert concentrations using a model-based bootstrap approach. Biometrics , 79(3):2076--2088
work page 2022
-
[31]
Riddell, R., Panacer, D., Wilde, S., Clothier, R., and Balls, M. (1986). The importance of exposure period and cell type in in vitro cytotoxicity tests. Alternatives to Laboratory Animals , 14(2):86--92
work page 1986
-
[32]
Rigby, R. and Stasinopoulos, D. (2005). Generalized additive models for location, scale and shape. Journal of the Royal Statistical Society Series C: Applied Statistics , 54(3):507--554
work page 2005
-
[33]
Sch \"u rmeyer, L., Sandig, L., Hezler, L., Igl, B.-W., and Schorning, K. (2025). Optimal designs for identifying effective doses in drug combination studies. arXiv preprint
work page 2025
-
[34]
Sch\"uttler, A., Altenburger, R., Ammar, M., Bader-Blukott, M., Jakobs, G., Knapp, J., Krüger, J., Reiche, K., Wu, G., and Busch, W. (2019). Map and model—moving from observation to prediction in toxicogenomics. GigaScience , 8(6):giz057
work page 2019
-
[35]
Sebaugh, J. L. (2011). Guidelines for accurate ec50/ic50 estimation. Pharmaceutical Statistics , 10(2):128--134
work page 2011
-
[36]
Stasinopoulos, D. and Rigby, R. (2008). Generalized additive models for location scale and shape (gamlss) in r. Journal of Statistical Software , 23:1--46
work page 2008
-
[37]
Stasinopoulos, M., Rigby, R., Heller, G., Voudouris, V., and De Bastiani , F. (2017). Flexible Regression and Smoothing: Using GAMLSS in R . Chapman and Hall/CRC
work page 2017
-
[38]
Zhou, Y., Sloan, A., Menon, S., and Wang, L. (2025). Combination mcp-mod for two-drug combination dose-ranging studies. Journal of Biopharmaceutical Statistics , 35(2):257--270
work page 2025
discussion (0)
Sign in with ORCID, Apple, or X to comment. Anyone can read and Pith papers without signing in.