Recognition: unknown
Cloudy with a chance of metals: Indications of CO₂ in the atmosphere of GJ 1214 b from high-resolution K-band spectroscopy
Pith reviewed 2026-05-10 09:41 UTC · model grok-4.3
The pith
High-resolution K-band spectroscopy indicates CO2 absorption in the atmosphere of GJ 1214 b.
A machine-rendered reading of the paper's core claim, the machinery that carries it, and where it could break.
Core claim
The central claim is that a cross-correlation function peak for CO2 appears at S/N ~ 3.6 in the processed transmission spectra, with no clear evidence of origin in correlated noise and a t-test confirming 3.4 sigma separation of in-trail versus out-of-trail values. Retrieval under free chemistry yields volume mixing ratios that correspond to super-solar metallicity, a high-altitude opacity deck, and a temperature intermediate between the day- and night-side profiles from JWST, all compatible with the observed K-band data and prior mid-infrared constraints.
What carries the argument
Cross-correlation of template spectra for individual molecules against the SYSREM-detrended high-resolution transmission spectra to extract molecular signatures.
If this is right
- CO2 must be included at appreciable abundance when modeling the transmission spectrum of GJ 1214 b at both high and low spectral resolution.
- Upper limits on the other searched molecules constrain the possible range of carbon and nitrogen chemistry in the atmosphere.
- The retrieved parameters remain compatible with JWST NIRSpec data within the models' stated uncertainties.
- Further high-resolution observations or mid-infrared data are required to raise the detection significance and tighten compositional constraints.
Where Pith is reading between the lines
- If the CO2 signal holds, ground-based high-resolution spectroscopy can extract compositional information from sub-Neptunes even when space-based low-resolution spectra appear muted.
- Atmospheric formation models for GJ 1214 b would need to accommodate significant CO2 enrichment, possibly linked to the planet's overall metallicity.
- Targeted follow-up at wavelengths where CO2 bands are stronger could provide an independent test of the K-band result.
Load-bearing premise
The detected cross-correlation peak for CO2 is produced by planetary absorption rather than residual correlated noise or over-subtraction artifacts from the data processing steps.
What would settle it
Recovery of a higher-S/N CO2 signal in an independent set of transits observed with the same or another high-resolution instrument, or consistent non-recovery in additional data of comparable quality.
Figures


read the original abstract
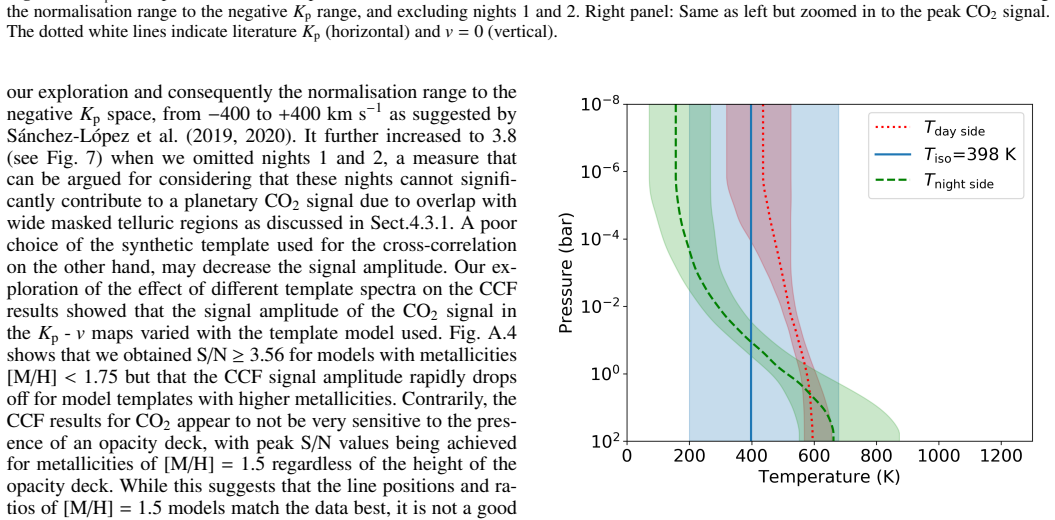
Sub-Neptune exoplanets frequently exhibit muted transmission spectra, with GJ 1214 b being the most prominent example. Following years of intense observing campaigns yielding featureless planetary spectra, recent observations with JWST revealed the first possible atmospheric signatures. We present high-resolution transmission spectroscopy of GJ 1214 b based on eight transits obtained with the CRIRES$^+$ spectrograph in the K band. We used SYSREM to remove telluric and stellar signals and searched for signatures of H2O, CO, CH4, H2S, NH3, and CO2 using the cross-correlation technique. We obtained non-detections for the first five molecules and used injection recovery tests to derive upper limits on the atmosphere. For CO$_2$ we measure a CCF signal at S/N ~ 3.6, with a detailed investigation showing no obvious indication that it is caused by correlated noise. A Welch t-test confirmed the in-trail and out-of-trail distributions to be different at $3.4 \sigma$ confidence. A Bayesian retrieval framework with free chemistry, resulted in volume mixing ratios corresponding to a metallicity of $[\mathrm{M/H}]=0.48^{+0.89}_{-1.70}$, an opacity deck pressure of $\log_{10}(P_\mathrm{c}) = -3.04^{+2.52}_{-1.53}$ and a planet temperature of $T_\mathrm{iso}=398^{+283}_{-197}$ K, consistent with a value intermediate between the day- and night-side T-p's derived from JWST data. While these values correspond to relatively large signal amplitudes predicted for CO2 features in the mid-infrared, they are compatible with JWST NIRSpec observations within the models' $1.5\sigma$ uncertainties. Further modelling and additional data are required to confirm the atmospheric signatures and obtain a comprehensive interpretation of low- and high-resolution data. Overall, our results support previous findings that CO2 is likely to be a significant component of the atmosphere of GJ 1214 b.
Editorial analysis
A structured set of objections, weighed in public.
Referee Report
Summary. The manuscript presents high-resolution K-band transmission spectroscopy of the sub-Neptune GJ 1214 b using eight transits observed with CRIRES+. After SYSREM detrending to remove telluric and stellar lines, cross-correlation functions (CCF) are computed for H2O, CO, CH4, H2S, NH3, and CO2. Non-detections are reported for the first five species with derived upper limits via injection tests; for CO2 a CCF peak at S/N ~3.6 is found, supported by a Welch t-test showing in-trail vs. out-of-trail distributions differ at 3.4σ. A free-chemistry Bayesian retrieval yields [M/H] = 0.48^{+0.89}_{-1.70}, log10(Pc) = -3.04^{+2.52}_{-1.53}, and T_iso = 398^{+283}_{-197} K, stated to be consistent with JWST-derived T-p profiles within 1.5σ. The authors conclude that CO2 is likely a significant atmospheric constituent.
Significance. If the CO2 detection holds, the result would supply the first ground-based high-resolution indication of CO2 in a sub-Neptune atmosphere and demonstrate complementarity between CRIRES+ CCF signals and JWST low-resolution spectra. It would also constrain cloud-deck pressure and metallicity for GJ 1214 b, reinforcing the emerging picture that CO2 may dominate the observable features in this class of planets. The work is technically timely given the recent JWST data, but the marginal statistical significance limits its immediate weight in the literature.
major comments (2)
- [CO2 CCF detection and statistical tests] In the CO2 cross-correlation results: the reported S/N ~3.6 peak and 3.4σ Welch t-test are marginal. The central claim that this constitutes an atmospheric detection rests on the assumption that SYSREM has neither attenuated a real signal nor introduced correlated residuals; without quantitative robustness checks (e.g., CCF behavior across a range of SYSREM iterations or false-alarm rates from phase-shuffled or null datasets), the distinction between planetary absorption and artifact remains uncertain and load-bearing for the paper's conclusion.
- [Bayesian retrieval framework] In the atmospheric retrieval section: the Bayesian fit is performed on the identical dataset that produced the CCF peak, so the retrieved parameters ([M/H], Pc, T_iso) cannot be regarded as an independent confirmation. The posteriors are extremely broad (metallicity spanning >2 dex, Pc and T_iso uncertainties of order 2–3 dex/K), weakening any claim that the retrieval supports the CO2 identification or provides meaningful consistency with JWST.
minor comments (3)
- The abstract states that the retrieval 'resulted in' the quoted parameters; rephrase for grammatical clarity.
- [Cross-correlation methodology] Clarify the precise definition and normalization used for the CCF S/N value (peak height relative to what noise estimate?) and whether it accounts for the number of trials across molecules.
- The injection-recovery tests for upper limits on non-detected species are mentioned but not quantified in the provided text; a table or figure summarizing the recovered S/N versus injected VMR would strengthen the non-detection claims.
Simulated Author's Rebuttal
We thank the referee for their careful reading and constructive comments, which help clarify the statistical limitations of our analysis. We address each major point below and propose revisions to improve the robustness and clarity of the manuscript.
read point-by-point responses
-
Referee: [CO2 CCF detection and statistical tests] In the CO2 cross-correlation results: the reported S/N ~3.6 peak and 3.4σ Welch t-test are marginal. The central claim that this constitutes an atmospheric detection rests on the assumption that SYSREM has neither attenuated a real signal nor introduced correlated residuals; without quantitative robustness checks (e.g., CCF behavior across a range of SYSREM iterations or false-alarm rates from phase-shuffled or null datasets), the distinction between planetary absorption and artifact remains uncertain and load-bearing for the paper's conclusion.
Authors: We agree that the S/N of 3.6 is marginal and that the detection claim depends on SYSREM not having introduced or removed correlated features. The manuscript already includes a detailed investigation ruling out obvious correlated noise artifacts, but we did not quantify behavior across SYSREM iterations or compute false-alarm rates via phase shuffling. We will add these quantitative checks (including CCF maps for a range of SYSREM iterations and false-alarm probabilities from phase-shuffled and null datasets) to a revised version, which will allow readers to better assess the signal reliability. revision: yes
-
Referee: [Bayesian retrieval framework] In the atmospheric retrieval section: the Bayesian fit is performed on the identical dataset that produced the CCF peak, so the retrieved parameters ([M/H], Pc, T_iso) cannot be regarded as an independent confirmation. The posteriors are extremely broad (metallicity spanning >2 dex, Pc and T_iso uncertainties of order 2–3 dex/K), weakening any claim that the retrieval supports the CO2 identification or provides meaningful consistency with JWST.
Authors: We acknowledge that the retrieval uses the same dataset as the CCF analysis and therefore does not provide independent confirmation of the detection. Its purpose is to derive posterior constraints on atmospheric parameters given the observed signal and to test consistency with JWST-derived T-p profiles. The broad posteriors are expected given the marginal signal strength and known degeneracies between metallicity, cloud pressure, and temperature; we already report the 1.5σ consistency with JWST. We will revise the text to explicitly state that the retrieval offers supporting parameter estimates rather than independent verification, while retaining the reported consistency metric. revision: yes
Circularity Check
No significant circularity; analysis chain is self-contained against external benchmarks
full rationale
The paper applies standard SYSREM detrending and cross-correlation to high-resolution spectra to search for molecular signatures, reports a marginal CO2 CCF detection with statistical tests, then performs a Bayesian retrieval on the same spectra to derive atmospheric parameters. These parameters are compared to independent JWST results rather than being presented as predictions derived from the fit itself. No equations or steps reduce by construction to the inputs, no self-citation chains support load-bearing claims, and no ansatzes or uniqueness theorems are invoked from prior author work. The derivation remains independent of its own fitted outputs.
Axiom & Free-Parameter Ledger
free parameters (3)
- metallicity [M/H]
- opacity deck pressure log10(Pc)
- isothermal temperature T_iso
axioms (2)
- domain assumption SYSREM removes telluric and stellar signals without attenuating the planetary CO2 signature.
- domain assumption The 3.6 S/N CCF peak is not produced by correlated noise.
Reference graph
Works this paper leans on
-
[1]
Adams, D., Gao, P., de Pater, I., & Morley, C. V . 2019, ApJ, 874, 61 Allart, R., Lemée-Joliecoeur, P.-B., Jaziri, A. Y ., et al. 2023, A&A, 677, A164 Alonso-Floriano, F. J., Sánchez-López, A., Snellen, I. A. G., et al. 2019, A&A, 621, A74 Banerjee, A., Barstow, J. K., Gressier, A., et al. 2024, ApJ, 975, L11 Bean, J. L., Désert, J.-M., Kabath, P., et al....
-
[2]
or, the more model agnostic approach, to identify the iteration after which the change in the standard deviation of the residu- als from one iteration to the next reaches a plateau (e.g. Herman et al. 2020, 2022; Deibert et al. 2021; Ridden-Harper et al. 2023; Lesjak et al. 2025). Keeping the number ofSYSREMiterations low is considered desirable as progre...
-
[3]
Wenger et al
RV semi-amplitudeK ⋆ (m s−1) 14.36±0.53 (2) References.1. Wenger et al. (2000),
2000
-
[4]
Cloutier et al. (2021),
2021
-
[5]
Kempton et al. (2023),
2023
-
[6]
Charbonneau et al. (2009),
2009
-
[7]
(2020) (the latter work corrects the sign of the value given in 5.) differences in our respective data analysis
Kasper et al. (2020) (the latter work corrects the sign of the value given in 5.) differences in our respective data analysis. To filter the model we needed to bring it into the same format as the data, that is, for each of the 18 wavelength segments a 2D matrix with the two dimensions being time steps (number of exposures in the re- spective night) and w...
2020
-
[8]
M′ =M−Cinstead, as was done by Gibson et al
Since we subtracted eachSYSREMiteration during the iteration process in which we obtained the cumula- tive correction matrix, but then divided instead of subtracted this correction matrix from the data, we also divide our model by our correction term to obtain the filtered model matrix M′ =(M+1)/(C+1)−1.(A.3) We note that applying the correction by subtra...
2022
-
[9]
1 and Sect
We omitted simulations of nights 1 and 2 due to the unfavourable total velocity shift between the planet lines and telluric lines in these nights (see Fig. 1 and Sect. 4.3.1). Our transmission spec- Article number, page 20 of 24 L. Nortmann et al.: Indications of CO 2 in the atmosphere of GJ 1214 b from high-resolution K-band spectroscopy Fig. A.7.K p-vma...
2025
-
[10]
(2019) and using the stellar parameters from Cloutier et al
model spectra first described by Nordlander et al. (2019) and using the stellar parameters from Cloutier et al. (2021). Our telluric spectra were generated from the K band per-molecule (H2O, CH4, N2O, CO2, CO) template transmission spectra computed by Köhler et al. (2025) for thevipersoft- ware package, and we allowed H 2O absorption and slit losses to sm...
2019
-
[11]
aa58512-25corr_appliedArXiv Fig
Article number, page 21 of 24 A&A proofs:manuscript no. aa58512-25corr_appliedArXiv Fig. A.8.Results of the Bayesian retrieval run on our GJ 1214 b high-resolution data. The free parameters of the retrieval were the planet’s temperature,T iso, used to calculate an isothermalT-pprofile, the opacity deck top pressure, log 10(Pc), the C/O ratio and metallici...
2024
discussion (0)
Sign in with ORCID, Apple, or X to comment. Anyone can read and Pith papers without signing in.