Recognition: unknown
The Effect of External Photoevaporation on the Disk Fraction in M17
Pith reviewed 2026-05-10 09:28 UTC · model grok-4.3
The pith
External photoevaporation decreases the average lifetime of protoplanetary disks in high-UV star-forming regions.
A machine-rendered reading of the paper's core claim, the machinery that carries it, and where it could break.
Core claim
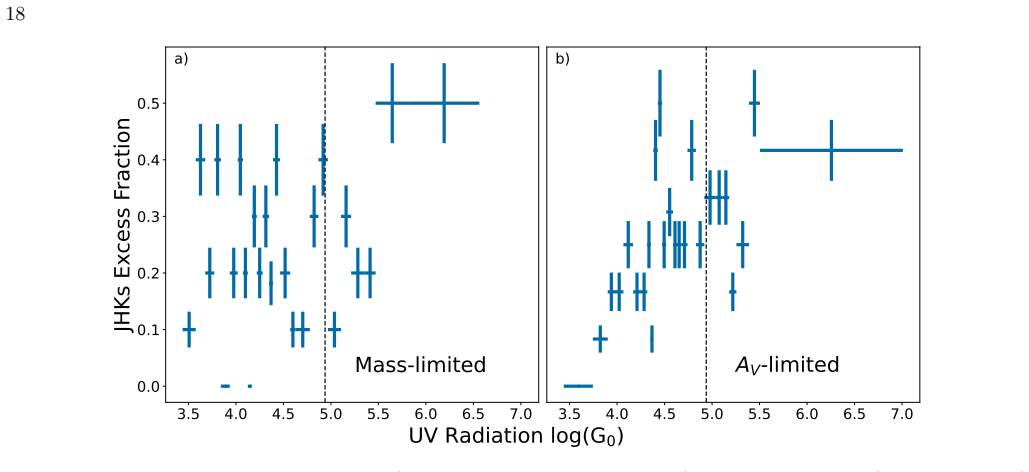
In M17 the authors measure an inner disk fraction of 28±2% from JHK excess among low-mass young stellar objects selected via X-ray and infrared criteria. No correlation appears between disk fraction and incident UV flux within the region, which they attribute to dynamical mixing. When M17 is placed alongside other ~1 Myr-old regions, lower disk fractions are found where the external UV field is stronger. The paper concludes that external photoevaporation reduces the average lifetime of protoplanetary disks.
What carries the argument
Disk fraction measured from near-infrared excess in low-mass YSOs, compared across star-forming regions that experience different levels of external UV radiation.
If this is right
- Disks near massive stars have less time to form planets because external photoevaporation removes material faster.
- Low-mass stars are the most sensitive tracers of this environmental effect.
- Dynamical mixing inside clusters can hide local UV-disk correlations, so global region properties matter.
- Models of disk evolution must incorporate both internal and external photoevaporation to match observed lifetime spreads.
Where Pith is reading between the lines
- Dynamical mixing means that any single region's disk fraction reflects an average over stars that formed in different local UV environments.
- Global cluster properties such as total mass and presence of O stars may set the typical disk survival time more than local conditions alone.
- Targeted simulations of stellar orbits in M17 could test whether mixing fully explains the lack of internal correlation.
Load-bearing premise
Disk fraction measurements can be compared directly across regions once observational biases are removed, and that the regions share comparable ages and initial conditions.
What would settle it
A survey that finds identical disk fractions in regions with different UV intensities after matching ages, stellar mass ranges, and survey sensitivity.
Figures


read the original abstract
A major obstacle to improving models of planet formation is understanding how the local environment influences the lifetime of the disks in which they form. The spread in observed disk lifetimes is caused by effects both observational (e.g., target selection, survey sensitivity) and physical (e.g., disk destruction by internal and external photoevaporation); however, the degree to which each plays a role remains poorly constrained. Isolating the impact of external photoevaporation on the disk lifetime benefits from the inclusion of low-mass ($\lesssim0.5$ M$_{\odot}$) YSOs, for which this effect is most predominant. In this work, we measure the inner disk fraction from JHK excess in the ~6000 M$_{\odot}$, ~1 Myr-old star-forming region M17. Using VLT/HAWK-I, we perform a deep photometric survey of an ~8$^{\prime}\times$8$^{\prime}$ field towards the region. The ~4 times greater sensitivity and ~2-3 times higher resolution than previous surveys of M17 reveal 10,339 sources. We select cluster members using the Massive Young Star-Forming Complex Study in Infrared and X-ray (MYStIX) catalog and find a disk fraction of 28$\pm$2%: the first X-ray-selected disk fraction measurement in M17 to include low-mass YSOs, and only the second such measurement in any high-mass star-forming region. After correcting for observational biases, we find no correlation between disk fraction and incident UV flux within M17, likely due to dynamical mixing within the region. However, when compared to other regions of similar age, we find lower disk fractions in regions with higher UV fields, suggesting that external photoevaporation decreases the average disk lifetime.
Editorial analysis
A structured set of objections, weighed in public.
Referee Report
Summary. The paper reports a deep VLT/HAWK-I JHK photometric survey covering an ~8'×8' field in the ~1 Myr-old, ~6000 M⊙ star-forming region M17. Cluster members are selected from the MYStIX catalog, yielding 10,339 sources and an inner disk fraction of 28±2% measured via JHK excess for low-mass (≲0.5 M⊙) YSOs—the first X-ray-selected such measurement in M17. No correlation is found between disk fraction and incident UV flux within M17, attributed to dynamical mixing. Inter-region comparison to other similar-age regions shows lower disk fractions in higher-UV environments, leading to the conclusion that external photoevaporation shortens average disk lifetimes.
Significance. If the inter-region trend survives rigorous controls for selection and age, the result supplies direct evidence that external photoevaporation is a dominant environmental driver of disk lifetime, with clear implications for planet-formation models in clustered high-mass regions. The X-ray plus low-mass selection in M17 is a concrete methodological advance over prior optical/near-IR-only surveys.
major comments (2)
- [§5] §5 (Discussion): The headline claim that external photoevaporation decreases disk lifetime rests on the inter-region trend. The manuscript does not supply a side-by-side table or quantitative audit confirming that every literature comparison uses (i) X-ray selection, (ii) mass completeness to ≲0.5 M⊙, and (iii) ages matched to ≲0.2 Myr; without this, systematic differences in completeness or age spreads remain viable alternative explanations for the observed trend.
- [§4.2] §4.2 (Results): The statement that the absence of a UV–disk-fraction correlation inside M17 is due to dynamical mixing is presented without supporting numbers (crossing time, velocity dispersion, or mixing timescale relative to the ~1 Myr age). This leaves the intra-region null result open to other interpretations and weakens the contrast drawn with the inter-region result.
minor comments (2)
- [Figure 3] Figure 3 and Table 2: axis labels and error-bar definitions for UV flux and disk fraction should be expanded in the captions so that the bias-correction procedure is immediately reproducible from the figures alone.
- [Abstract] Abstract and §1: the phrasing “the first X-ray-selected disk fraction measurement in M17” should be qualified with the precise mass and wavelength range to avoid any ambiguity with earlier MYStIX papers.
Simulated Author's Rebuttal
We thank the referee for their constructive comments, which have helped us strengthen the manuscript. We address each major comment below and will incorporate the suggested revisions.
read point-by-point responses
-
Referee: [§5] §5 (Discussion): The headline claim that external photoevaporation decreases disk lifetime rests on the inter-region trend. The manuscript does not supply a side-by-side table or quantitative audit confirming that every literature comparison uses (i) X-ray selection, (ii) mass completeness to ≲0.5 M⊙, and (iii) ages matched to ≲0.2 Myr; without this, systematic differences in completeness or age spreads remain viable alternative explanations for the observed trend.
Authors: We agree that a quantitative audit is required to support the inter-region comparison. In the revised manuscript we will add a new table in §5 that lists, for each comparison region, the selection method, mass completeness limit, age estimate with uncertainty, and disk fraction measurement technique. This will allow readers to evaluate potential systematics directly. While not all literature studies are X-ray selected, we restricted our comparison to those with low-mass sensitivity where possible; the trend remains visible in the most comparable subsample. We will also expand the discussion to acknowledge age spreads and selection effects as viable alternative explanations. revision: yes
-
Referee: [§4.2] §4.2 (Results): The statement that the absence of a UV–disk-fraction correlation inside M17 is due to dynamical mixing is presented without supporting numbers (crossing time, velocity dispersion, or mixing timescale relative to the ~1 Myr age). This leaves the intra-region null result open to other interpretations and weakens the contrast drawn with the inter-region result.
Authors: We will revise §4.2 to include quantitative estimates. Adopting a velocity dispersion of ~2.5 km s⁻¹ and a characteristic radius of ~3 pc for the M17 region yields a crossing time of ~1.2 Myr, comparable to the cluster age. We will add these numbers with references and discuss how this timescale supports dynamical mixing as a plausible explanation for the lack of local correlation, while also noting alternative interpretations such as limited UV contrast within the field or observational biases. revision: yes
Circularity Check
No circularity; empirical result from new photometry and literature comparison
full rationale
The paper measures disk fraction directly from new VLT/HAWK-I JHK photometry of 10,339 sources in M17, selects members via the external MYStIX X-ray catalog, computes an observed 28±2% fraction, and compares it to published values from other regions of similar age. No equations, fitted parameters, or ansatzes are introduced that reduce the central claim (lower disk fractions at higher UV) back to the paper's own inputs by construction. Within-M17 null correlation is attributed to dynamical mixing without self-referential fitting. Comparisons rely on external literature rather than self-citations that bear the load of uniqueness or derivation. The analysis is therefore self-contained observational work.
Axiom & Free-Parameter Ledger
free parameters (1)
- Age of M17 =
~1 Myr
axioms (1)
- domain assumption JHK excess reliably indicates the presence of inner disks in low-mass young stellar objects
Reference graph
Works this paper leans on
-
[1]
, " * write output.state after.block = add.period write newline
ENTRY address archivePrefix author booktitle chapter doi edition editor eprint howpublished institution journal key month number organization pages publisher school series title misctitle type volume year version url label extra.label sort.label short.list INTEGERS output.state before.all mid.sentence after.sentence after.block FUNCTION init.state.consts ...
-
[2]
write newline
" write newline "" before.all 'output.state := FUNCTION format.url url empty "" new.block "" url * "" * if FUNCTION format.eprint eprint empty "" archivePrefix empty "" archivePrefix "arXiv" = new.block " " eprint * " " * new.block " " eprint * " " * if if if FUNCTION format.doi doi empty "" " " doi * " " * if FUNCTION format.pid doi empty eprint empty ur...
-
[3]
thebibliography [1] 20pt to REFERENCES 6pt =0pt \@twocolumntrue 12pt -12pt 10pt plus 3pt =0pt =0pt =1pt plus 1pt =0pt =0pt -12pt =13pt plus 1pt =20pt =13pt plus 1pt \@M =10000 =-1.0em =0pt =0pt 0pt =0pt =1.0em @enumiv\@empty 10000 10000 `\.\@m \@noitemerr \@latex@warning Empty `thebibliography' environment \@ifnextchar \@reference \@latexerr Missing key o...
discussion (0)
Sign in with ORCID, Apple, or X to comment. Anyone can read and Pith papers without signing in.