Evaluating quality in synthetic data generation for large tabular health datasets
Pith reviewed 2026-05-10 08:33 UTC · model grok-4.3
The pith
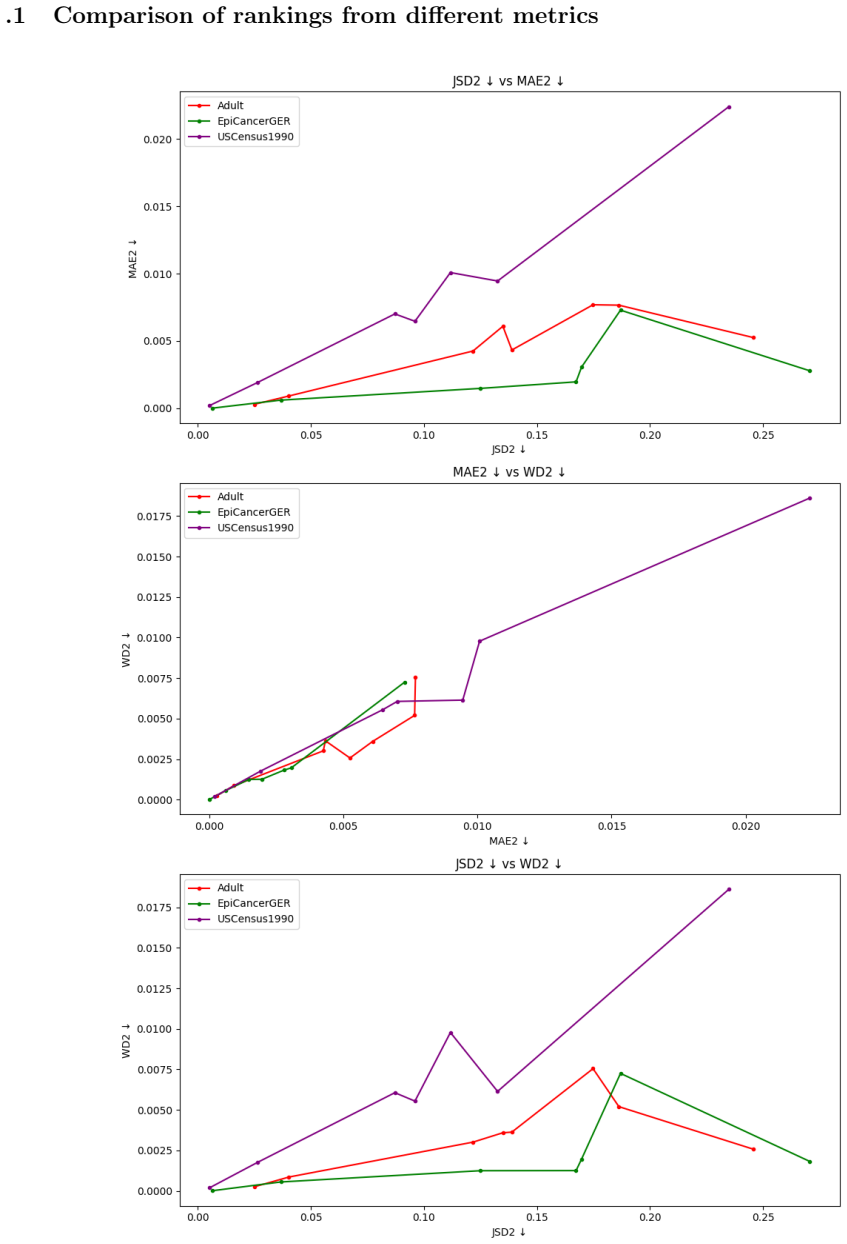
A methodology that aligns fidelity metrics with visualizations on one plot evaluates how well synthetic data preserves joint distributions in tabular health records.
A machine-rendered reading of the paper's core claim, the machinery that carries it, and where it could break.
Core claim
The central claim is that fidelity of synthesized joint distributions can be assessed by a method that places standard metrics and aligned visualizations on a single plot; this method works for any tabular dataset and, when used on the German Cancer Registries data, demonstrates that current models have difficulty strictly respecting medical-domain constraints.
What carries the argument
The aligned-metric-and-visualization plot for joint-distribution fidelity, which combines quantitative scores with graphical checks so that both point to the same departures from the real data.
If this is right
- The same plot-based procedure can be applied to any tabular dataset to guide choice of synthesizer.
- Stakeholders releasing synthetic health data can use the method to check domain adherence before publication.
- The approach supplies a concrete benchmark that future synthesis algorithms can aim to improve.
Where Pith is reading between the lines
- If the method is adopted, comparisons among new synthesis algorithms will become more reproducible across studies.
- The same alignment technique could be tested on non-health tabular data to see whether domain-specific violations appear in other fields.
- Extending the visualization to include conditional distributions might expose additional medical inconsistencies not caught by marginal checks.
Load-bearing premise
That tuning hyperparameters separately for each model and dataset produces a fair comparison and that the chosen metrics plus visualizations are sufficient to detect all medically important violations.
What would settle it
A case in which the aligned plot reports high fidelity scores yet the synthetic records still contain impossible medical combinations, such as a recorded cancer stage that contradicts the patient’s age or diagnosis date.
Figures


read the original abstract
There is no consensus in the field of synthetic data on concise metrics for quality evaluations or benchmarks on large health datasets, such as historical epidemiological data. This study presents an evaluation of seven recent models from major machine learning families. The models were evaluated using four different datasets, each with a distinct scale. To ensure a fair comparison, we systematically tuned the hyperparameters of each model for each dataset. We propose a methodology for evaluating the fidelity of synthesized joint distributions, aligning metrics with visualization on a single plot. This method is applicable to any dataset and is complemented by a domain-specific analysis of the German Cancer Registries' epidemiological dataset. The analysis reveals the challenges models face in strictly adhering to the medical domain. We hope this approach will serve as a foundational framework for guiding the selection of synthesizers and remain accessible to all stakeholders involved in releasing synthetic datasets.
Editorial analysis
A structured set of objections, weighed in public.
Referee Report
Summary. The manuscript evaluates seven recent synthetic data generation models from major ML families on four tabular health datasets of varying scales. Hyperparameters are systematically tuned for each model-dataset pair to enable fair comparison. The core contribution is a methodology for assessing fidelity of synthesized joint distributions that aligns quantitative metrics with visualizations on a single plot; this is presented as applicable to any dataset and is illustrated via a domain-specific analysis of the German Cancer Registries epidemiological data, which is used to demonstrate models' difficulties in strictly respecting medical-domain constraints.
Significance. If the single-plot alignment of metrics and visualizations proves robust and the domain analysis concretely identifies medically implausible combinations (rather than only generic statistical discrepancies), the work could supply a practical, accessible framework for synthetic health-data evaluation where consensus on concise quality metrics is currently lacking. Systematic hyperparameter tuning and the emphasis on large-scale epidemiological data are positive features that could aid reproducibility and stakeholder accessibility.
major comments (2)
- [Domain-specific analysis (complementing the joint-distribution fidelity methodology)] The central claim that the domain-specific analysis 'reveals the challenges models face in strictly adhering to the medical domain' is load-bearing for the paper's contribution, yet the manuscript provides no concrete quantification or examples of medically relevant violations (e.g., inconsistent age-incidence patterns, invalid diagnosis sequences, or epidemiological invariants) that the chosen fidelity metrics successfully surfaced versus those they missed. Without such evidence, it remains unclear whether the metric set is comprehensive enough to support the conclusion rather than serving as an incomplete proxy.
- [Evaluation setup and hyperparameter tuning description] The assertion that systematic hyperparameter tuning produces a fair comparison across the seven models is stated in the abstract and methods, but the manuscript does not detail the tuning procedure, search space, number of trials, or validation criterion used for each model and dataset. This omission directly affects the reliability of the reported model rankings and the claim of fairness.
minor comments (2)
- [Introduction / Datasets] The abstract refers to 'four different datasets, each with a distinct scale' but does not list their names, sizes, or key characteristics; adding a brief table or paragraph in the introduction would improve readability.
- [Proposed methodology section] Notation for the aligned metrics and the single-plot construction is not introduced with sufficient formality; a small diagram or pseudocode would clarify how the quantitative scores are overlaid with visualizations.
Circularity Check
Empirical evaluation with no derivations or self-referential reductions
full rationale
The paper describes an empirical study comparing seven synthetic data models on four tabular health datasets, with systematic hyperparameter tuning for fairness and a proposed methodology that aligns fidelity metrics for joint distributions with visualizations on a single plot. No equations, derivations, fitted parameters renamed as predictions, or load-bearing self-citations appear in the text. The domain-specific analysis of German Cancer Registries data is presented as observational results rather than a closed loop reducing to the inputs by construction. The central claims rest on experimental outcomes and the applicability of the visualization method to any dataset, without tautological self-definition or imported uniqueness theorems.
Axiom & Free-Parameter Ledger
axioms (2)
- domain assumption Hyperparameter tuning yields fair model comparisons across different architectures and dataset scales
- domain assumption Joint distribution fidelity can be meaningfully assessed by aligning quantitative metrics with visualizations
Reference graph
Works this paper leans on
-
[1]
3765067 Hernandez, M., Osorio-Marulanda, P
https://doi.org/10.1145/3719027. 3765067 Hernandez, M., Osorio-Marulanda, P. A., Catalina, M., Loinaz, L., Epelde, G., & Aginako, N. (2025). Comprehensive evaluation framework for synthetic tabular data in health: Fidelity, utilityandprivacyanalysisofgenerativemod- els with and without privacy guarantees. Frontiers in Digital Health,7, 1576290. https: //d...
-
[2]
https://doi.org/10.1038/s41467-022- 35295-1 Yoon, J., Jordon, J., & Schaar, M. v. d. (2019). PATE- GAN: Generating Synthetic Data with Differ- ential Privacy Guarantees.International Con- ference on Learning Representations. https: //openreview.net/forum?id=S1zk9iRqF7 Zhang, Z., Wang, T., Li, N., Honorio, J., Backes, M., He, S., Chen, J., & Zhang, Y. (202...
discussion (0)
Sign in with ORCID, Apple, or X to comment. Anyone can read and Pith papers without signing in.