AI Incident Monitoring through a Public Health Lens
Pith reviewed 2026-05-10 00:57 UTC · model grok-4.3
The pith
Expert panels can classify AI incidents into six emergence phases using statistical tools and domain knowledge, even with incomplete data.
A machine-rendered reading of the paper's core claim, the machinery that carries it, and where it could break.
Core claim
An informed panel of domain experts can combine their domain expertise, incident data, and a collection of statistical and visualization tools to arrive at incident phase determinations serving public needs. This is demonstrated in the autonomous vehicles case study where reliable incident-rate ground truth exists due to mandatory reporting.
What carries the argument
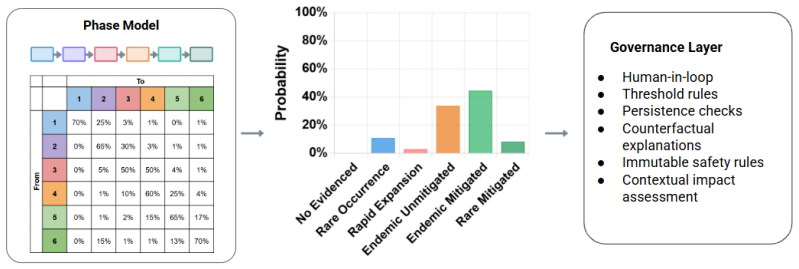
The six phases of incident emergence, which allow classification of events from noisy surveillance data similar to disease monitoring.
Load-bearing premise
The assumption that expert panels can consistently identify the six phases from noisy and incomplete incident data without additional checks against actual prevalence rates.
What would settle it
Finding that different expert panels assign inconsistent phases to the same set of incidents or that the phases do not align with known incident rates in a well-reported area like autonomous driving.
Figures


read the original abstract
Artificial intelligence systems are now deployed at scale across sectors, accompanied by a growing number of real-world incidents ranging from misinformation and cybercrime to autonomous-system failures. Databases of AI incidents index these events, but they cannot measure ``risk'' (i.e., a joint measure of likelihood and severity) without additional data regarding the prevalence of risk-associated systems and their incident reporting rates. As a result, policymakers, companies, and the general public lack a means to weigh the benefits of AI against their in-context risks. Inspired by public-health processes, which presume noisy and incomplete disease surveillance, we identify six phases of incident emergence. We demonstrate the framework through a detailed case study of autonomous vehicles, whose mandatory reporting requirements produces reliable incident-rate ground truth expressed in distance traveled. The case study shows that an informed panel of domain experts (e.g., self-driving experts) can combine their domain expertise, incident data, and a collection of statistical and visualization tools to arrive at incident phase determinations serving public needs. We further demonstrate the approach with a deepfake incident case study and chart a path for future research in incident phase determination.
Editorial analysis
A structured set of objections, weighed in public.
Referee Report
Summary. The paper proposes a public-health-inspired framework of six phases of AI incident emergence to address the gap between incident databases and measurable risk, which requires data on system prevalence and reporting rates. It demonstrates the approach via an autonomous-vehicle case study that uses mandatory-reporting data as ground truth on incident rates per distance traveled, plus a deepfake case study, claiming that informed expert panels can combine domain expertise, incident data, and statistical/visualization tools to produce phase determinations that serve public needs.
Significance. If the phase assignments prove reproducible, the framework could supply a structured method for interpreting noisy AI-incident data in a manner analogous to disease surveillance, enabling better-informed policy on AI risks. The AV case study's use of external mandatory-reporting ground truth is a concrete strength that keeps circularity low and provides a potential calibration anchor for future work.
major comments (3)
- [Autonomous Vehicles case study] Autonomous Vehicles case study: although mandatory-reporting data supplies ground-truth incidence curves, the manuscript reports neither quantitative criteria or thresholds for phase assignment nor inter-rater reliability statistics across panels, nor a post-hoc comparison of assigned phases against the observed incidence trajectory. These omissions leave the central claim that expert panels can reliably determine phases untested.
- [Deepfake incident case study] Deepfake case study: the demonstration likewise provides no operational criteria, agreement metrics, or validation against any external prevalence measure, so the claim that the six-phase lens generalizes beyond the AV setting rests on unvalidated expert judgment.
- [Framework description] Framework section: the six phases are presented as identifiable from noisy data, yet no formal operationalization, decision rules, or sensitivity analysis to data exclusions is supplied; without these the reproducibility required for policy utility cannot be assessed.
minor comments (1)
- [Abstract and case-study sections] The abstract and methods descriptions refer to 'a collection of statistical and visualization tools' without naming them or showing example outputs; explicit listing and figures would improve clarity.
Simulated Author's Rebuttal
We thank the referee for the constructive comments, which identify key opportunities to clarify the scope and limitations of our framework and case studies. We respond to each major comment below and indicate where revisions will strengthen the manuscript.
read point-by-point responses
-
Referee: [Autonomous Vehicles case study] Autonomous Vehicles case study: although mandatory-reporting data supplies ground-truth incidence curves, the manuscript reports neither quantitative criteria or thresholds for phase assignment nor inter-rater reliability statistics across panels, nor a post-hoc comparison of assigned phases against the observed incidence trajectory. These omissions leave the central claim that expert panels can reliably determine phases untested.
Authors: We agree that the AV case study provides no quantitative thresholds, inter-rater reliability statistics, or formal post-hoc comparison. The study is presented as an illustration of how domain experts can apply the framework to real data, not as a statistical validation of reproducibility. The central claim is that such panels can arrive at phase determinations serving public needs, which is shown through the described process. We will revise to add an explicit limitations subsection noting these gaps, outline future empirical work on inter-rater studies and thresholds, and include a qualitative comparison of the assigned phases with the observed incidence trends. revision: partial
-
Referee: [Deepfake incident case study] Deepfake case study: the demonstration likewise provides no operational criteria, agreement metrics, or validation against any external prevalence measure, so the claim that the six-phase lens generalizes beyond the AV setting rests on unvalidated expert judgment.
Authors: We acknowledge that the deepfake case study supplies neither operational criteria, agreement metrics, nor external validation. It functions as a second illustration to show applicability in a domain lacking mandatory reporting. We will revise to clarify the illustrative intent and expand the limitations discussion to highlight the need for quantitative metrics and external benchmarks in future applications of the framework. revision: partial
-
Referee: [Framework description] Framework section: the six phases are presented as identifiable from noisy data, yet no formal operationalization, decision rules, or sensitivity analysis to data exclusions is supplied; without these the reproducibility required for policy utility cannot be assessed.
Authors: The phases are introduced as conceptual categories adapted from public-health surveillance, where expert judgment integrates noisy data rather than following rigid algorithms. We did not supply formal decision rules or sensitivity analysis to maintain accessibility in this initial presentation. We agree this limits immediate reproducibility assessment and will revise the Framework section to add example operationalization approaches, heuristic decision rules drawn from the case studies, and a brief sensitivity note on how data exclusions affect phase assignments. revision: yes
Circularity Check
No circularity: proposed framework demonstrated with external ground-truth data
full rationale
The manuscript proposes a six-phase incident emergence framework inspired by public-health surveillance processes and demonstrates its application through case studies. The autonomous-vehicle case explicitly relies on mandatory external reporting data to supply ground-truth incidence rates per distance traveled, which serves as an independent benchmark rather than a fitted or self-derived input. No equations, parameter estimations, or statistical predictions are described that reduce to the framework's own definitions by construction. No load-bearing self-citations, uniqueness theorems, or ansatzes imported from prior author work are invoked to justify core claims. The central demonstration—that expert panels can apply the framework plus visualization tools—is presented as a methodological illustration, not a closed-loop derivation or renamed empirical pattern. The absence of reported inter-rater metrics or quantitative thresholds affects evidence strength but does not create circularity in the derivation chain.
Axiom & Free-Parameter Ledger
axioms (1)
- domain assumption Public-health processes for handling noisy and incomplete surveillance data can be applied to AI incident reporting despite differences in data generation and regulatory environments.
invented entities (1)
-
Six phases of incident emergence
no independent evidence
Reference graph
Works this paper leans on
-
[1]
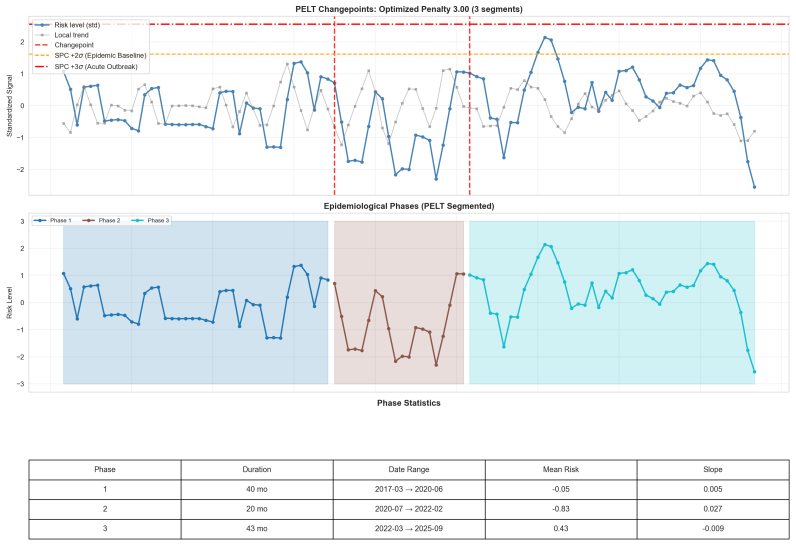
Robustness: If HMM, PELT, and K-means identify similar regime structure despite different algorithmic foundations, confidence in that structure increases
-
[2]
Complementarity: Different methods answer different questions about incident dynamics: • HMM:What latent state is the system in?(probabilistic state assignment) • PELT:When did behavior change?(temporal boundary detection) • K-means:What risk profiles exist?(feature-based clustering) • NB GLM:What is the overall trajectory?(trend estimation) • ARIMA:Where...
-
[3]
Uncertainty quantification: Agreement across methods suggests greater confidence; dis- agreement signals areas requiring caution. Detailed diagnostics and validation results for each method are provided in Appendix B and C. 23 A.3 Connecting Methods to Phase Classification The six-phase framework requires two inputs:risk level(current incident intensity r...
-
[4]
Filtering: subdomain match, valid date fields, non-duplicate records
Ingestion: Extract incidents from AIID by subdomain classification; parse incident and report dates; link reports to parent incidents. Filtering: subdomain match, valid date fields, non-duplicate records. 2We also evaluated zero-inflated models, Bayesian structural time series, and Hawkes processes, but did not adopt them: Negative Binomial adequately cap...
-
[5]
Temporal aggregation: Aggregate report counts by year-month; create continuous time index spanning full observation period; zero-fill gaps for months without incidents
-
[6]
Delay correction: Calculate reporting lag (report_date − incident_date); exclude invalid observations (negative lags or >5 years; typically 8–13% of records); apply nowcasting adjustment to recent months based on expected unreported fraction. Window length is data-driven (95th percentile of empirical lag distribution): 6 months for the A V case; 4 months ...
-
[7]
Exposure integration: Merge domain-specific exposure proxies (California DMV au- tonomous miles for A Vs); compute exposure-adjusted rates where data permit
-
[8]
Feature engineering: Compute standardized risk (z= (x−µ)/σ ), local trend (3-month rolling OLS slope), media intensity (Google Trends index), and apply 6-phase classification rules. A.7 Sensitivity Analysis We assessed robustness of phase classifications to parameter perturbations across both case studies. 25 A V domain.A threshold sensitivity sweep acros...
work page 2014
-
[9]
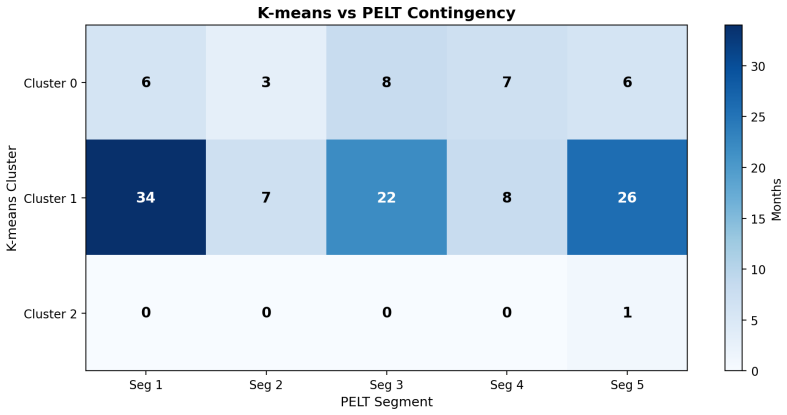
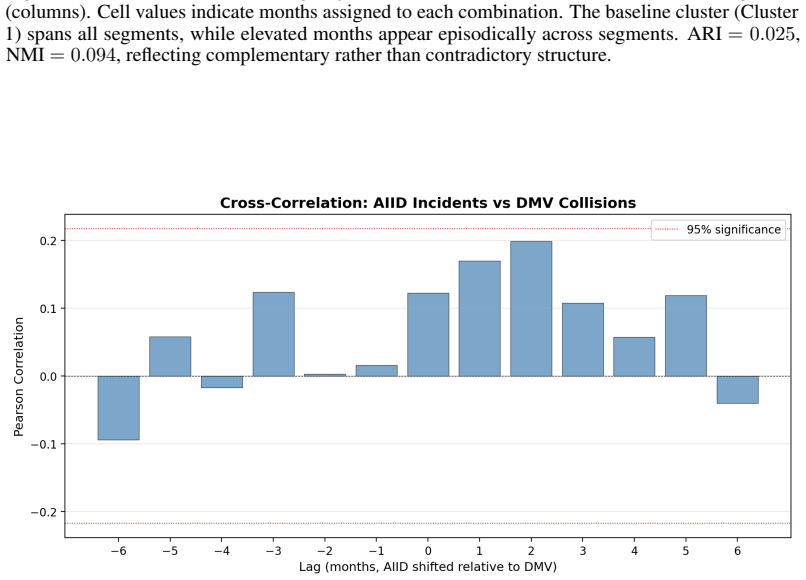
ARI = 0.025, NMI= 0.094, reflecting complementary rather than contradictory structure
spans all segments, while elevated months appear episodically across segments. ARI = 0.025, NMI= 0.094, reflecting complementary rather than contradictory structure. Figure 13: Cross-correlation function between AIID incident counts and DMV collision counts across lags of −6 to +6 months. Positive lags indicate AIID shifted forward (lagging DMV). The peak...
work page 2001
-
[10]
Trend divergence: The count-based trend is flat and non-significant (β= +0.006 /month, p= 0.775 ), while the severity-weighted trend shows marginal positive acceleration (β= +0.011/month,p= 0.078). 32
-
[11]
Moderate correlation: The two series exhibit moderate correlation (r= 0.47 ), indicating that high-count months do not always correspond to high-severity months
-
[12]
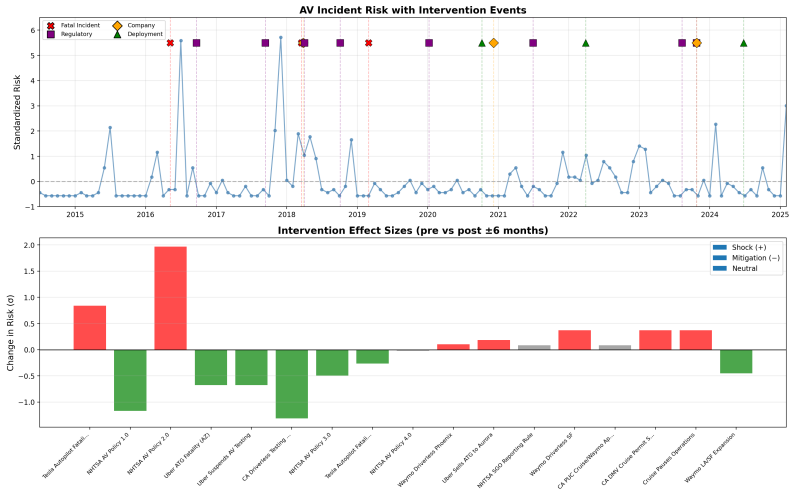
High-severity incidents: Only three incidents were classified as “Substantial” (weight = 10): • Waze wildfire navigation incident (December 2017) • Tesla Autopilot/FSD misrepresentation allegations (May 2021) • Cruise pedestrian dragging incident (January 2023) Figure 17: Comparison of Count-Based and Severity-Weighted A V Incident Series (2014–2025). Pan...
work page 2017
-
[13]
No fatalities coded as “Severe”: Known fatal A V incidents—including the Tesla Autopilot fatality (May 2016) and the Uber ATG fatality (March 2018)—are not classified as “4 Severe” in the available data. This suggests the NatSec field captures regulatory or societal impact rather than physical harm severity
work page 2016
-
[14]
Subjective classification: The NatSec ratings reflect analyst judgment about national security implications, which may not align with traditional crash severity metrics used in transportation safety (e.g., the KABCO scale: K=fatality, A=incapacitating injury, B=non- incapacitating injury, C=possible injury, O=property damage only)
-
[15]
Concentration in low-severity categories: With 96% of incidents rated as Negligible or Minor, the severity-weighted analysis has limited discriminatory power. Implications.Despite these limitations, the severity analysis provides two governance-relevant insights: 33
-
[16]
This warrants continued monitoring even during periods of apparent count stability
Count-based trends may understate risk evolution: The marginally significant positive trend in severity-weighted incidents (p= 0.078 ) suggests that while incident frequency has stabilized, the character of incidents may be shifting toward higher-impact events. This warrants continued monitoring even during periods of apparent count stability
-
[17]
The EU AI Act’s serious incident reporting requirements (Article
Need for standardized severity classification: Future incident reporting frameworks should incorporate validated severity scales (e.g., KABCO, AIS) to enable more precise severity- adjusted trend analysis. The EU AI Act’s serious incident reporting requirements (Article
-
[18]
and NHTSA’s Standing General Order data could provide complementary severity information for cross-validation. B.7 Exposure Data Source The California Department of Motor Vehicles requires companies testing autonomous vehicles to submit annual Autonomous Vehicle Disengagement Reports, which include total miles driven in autonomous mode. We aggregated mont...
work page 2020
-
[19]
Trend divergence: Raw incident counts show a negligible positive trend (β = +0.006/month, p = 0.775), while exposure-adjusted rates show anegativetrend ( β = –0.023 incidents per million miles/month, p = 0.274). Neither trend reaches statistical significance, but the directional divergence is substantively important: it suggests that deployment growth, no...
-
[20]
Rate magnitude: The mean incident rate of 1.67 incidents per million autonomous miles is comparable to human-driven vehicle crash rates (∼2.1 police-reported crashes per million VMT nationally). However, this comparison requires caution—the AIID captures near- misses, software anomalies, and minor incidents that would not trigger police reporting for huma...
-
[21]
Temporal coverage gap: Exposure data covers only December 2020–November 2024 (48 months), while our incident database spans 2014–2025. The pre-2020 period includes formative incidents (e.g., the 2016 Tesla fatality, 2018 Uber fatality) that cannot be exposure- normalized, limiting historical trend analysis. B.9 HMM Model Selection The sparse A V count dis...
work page 2020
-
[22]
Each unit increase in centered time-squared multiplies the expected rate by 1.07
Accelerating Risk: The quadratic time term is positive and borderline significant ( β2 = 0.068, p= 0.055 ), providing suggestive evidence that the rate of incidents isaccelerating. Each unit increase in centered time-squared multiplies the expected rate by 1.07. Over the 103-month observation window, this quadratic structure captures the explosive post-20...
work page 2023
-
[23]
Media Amplification: The standardized media index shows a substantial effect size (β3 = 0.633, rate ratio of 1.88) but does not reach conventional significance ( p= 0.121 ). This implies that a 1-standard-deviation increase in Google Trends search volume (approximately 24 points on the 0–100 scale) is associated with an 88% increase in expected incidents,...
-
[24]
Linear Time Insignificance: The linear time term is non-significant ( β1 = 0.112 , p= 0.526 ). This is consistent with a “hockey stick” growth pattern: once the quadratic component captures the post-2023 acceleration and the exposure offset absorbs baseline growth, the linear term’s marginal contribution vanishes. Media-Adjusted Excess Risk.Using the fitt...
work page 2023
-
[25]
Corresponds to PELT Segments 1–2 and the low-risk K-Means macro-band
Dormant Baseline(Risk <+0.14σ ): The historical incubation period where incidents remained constrained to early technical demonstrations or localized misuse. Corresponds to PELT Segments 1–2 and the low-risk K-Means macro-band
-
[26]
Active Outbreak(Risk ≥+2σ orSlope > τ rapid): Months exhibiting explosive growth or actively breaching the SPC Epidemic Threshold. The slope threshold τrapid = max(P75(slopes),0.05) per month is calibrated to the observed segment distribution; for this datasetτ rapid = 0.05, matching the fixed value used in sensitivity analyses
-
[27]
Endemic Unmitigated(Risk ≥+0.14σ , not meeting Outbreak criteria): The elevated stabilization state where risk persists structurally above the dormant reference distribution but has ceased rapid escalation. Corresponds to PELT Segment 3 and the high-risk K-Means macro-band. 3The SPC reference window extends to end-2022 (< January 2023), which includes the...
work page 2022
-
[28]
both produced statistically null or perverse effects on the risk signal (Appendix C.1), consistent with the hypothesis that macro-level governance cannot reach the distributed user base that generates the risk. This structural asymmetry explains why the same phase-detection pipeline produces qualitatively different outputs from the two domains: • A V: cri...
-
[29]
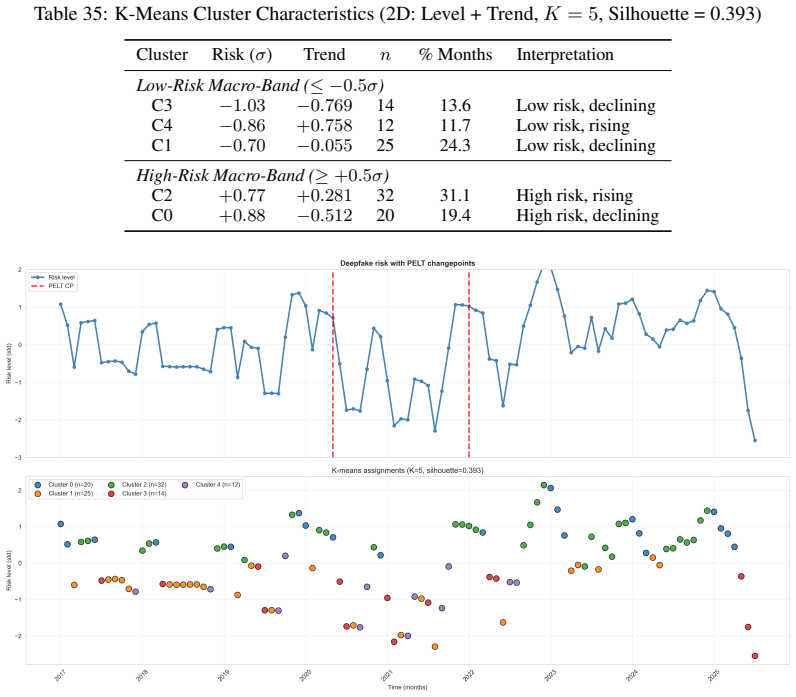
Selection Bias and the “Hype Cycle” Confound: The AI Incident Database relies on voluntary reporting and journalistic discovery. Consequently, the observed incident surge in 2023 is inextricably linked to the intense global media attention surrounding generative AI. Although our Negative Binomial regression framework explicitly controls for public attenti...
work page 2023
-
[30]
Left-Censorship of the Baseline: The period from 2018 to 2022 serves as the historical baseline for calculating the SPC epidemic control limits (±2σ). However, prior to 2023, the majority of deepfake misuses involved localized deployment scattered across underground forums. Because early incidents received less mainstream news coverage than recent politic...
work page 2018
-
[31]
Qualitative Compression and Severity Agnosticism: To enable objective mathematical time-series modeling, our incident-centric pipeline implicitly assigns equal statistical weight to all registered incidents. An early academic demonstration video is mathematically indistinguishable from a coordinated multi-million dollar international fraud campaign. There...
-
[32]
Right-Censoring of the Reporting Tail: Incident databases such as AIID exhibit systematic right-censoring: incidents from the most recent months are underrepresented because the full cycle of occurrence, discovery, reporting, and editorial curation has not yet completed. For the deepfake corpus, the post-2021 empirical lag distribution has a median of 0 m...
work page 2021
discussion (0)
Sign in with ORCID, Apple, or X to comment. Anyone can read and Pith papers without signing in.