Conditional anomaly detection with soft harmonic functions
Pith reviewed 2026-05-09 22:05 UTC · model grok-4.3
The pith
The soft harmonic solution estimates label confidence to identify anomalous mislabeling.
A machine-rendered reading of the paper's core claim, the machinery that carries it, and where it could break.
Core claim
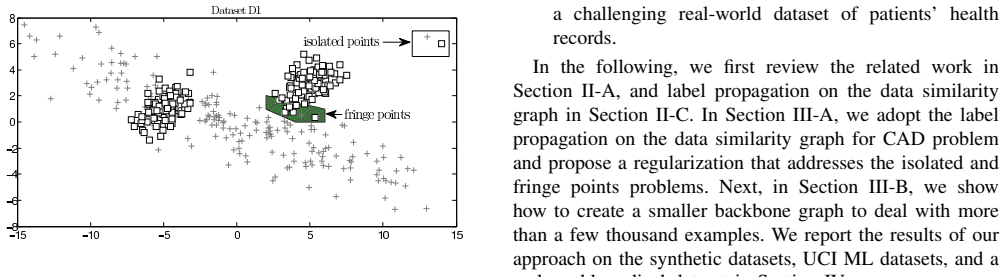
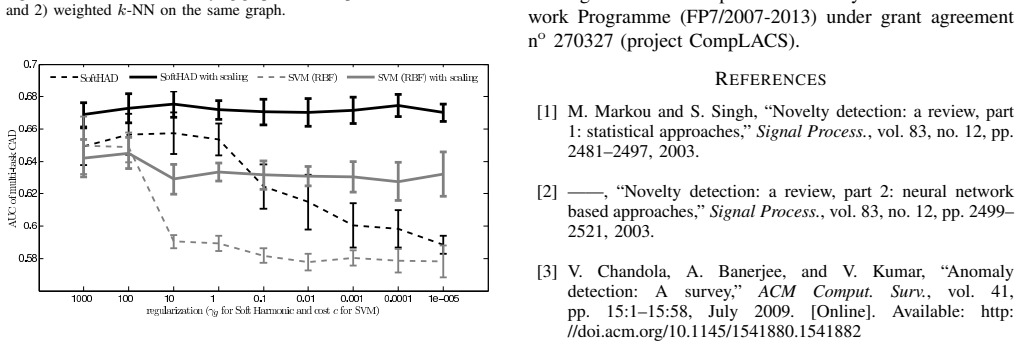
The authors claim that solving the soft harmonic function on a graph constructed from the data yields an estimate of label confidence that can be used to flag conditional anomalies, and that adding regularization terms prevents spurious detections on the support boundary and isolated points. This is shown to work better than several baselines on multiple datasets including a real-world medical one.
What carries the argument
the soft harmonic solution, which computes label confidence by minimizing a regularized quadratic form over a similarity graph of the data points
Load-bearing premise
The soft harmonic solution after regularization separates anomalous mislabeling from normal variation without creating false positives on distribution boundaries or isolated points.
What would settle it
Run the method on a dataset where some labels are deliberately flipped to be anomalous and check if the flagged points match the flipped ones more accurately than baselines, without excess flags on boundary points.
Figures


read the original abstract
In this paper, we consider the problem of conditional anomaly detection that aims to identify data instances with an unusual response or a class label. We develop a new non-parametric approach for conditional anomaly detection based on the soft harmonic solution, with which we estimate the confidence of the label to detect anomalous mislabeling. We further regularize the solution to avoid the detection of isolated examples and examples on the boundary of the distribution support. We demonstrate the efficacy of the proposed method on several synthetic and UCI ML datasets in detecting unusual labels when compared to several baseline approaches. We also evaluate the performance of our method on a real-world electronic health record dataset where we seek to identify unusual patient-management decisions.
Editorial analysis
A structured set of objections, weighed in public.
Referee Report
Summary. The paper proposes a non-parametric method for conditional anomaly detection that adapts the soft harmonic solution to estimate label confidence and thereby identify instances with anomalous (mis)labels. Regularization is added to suppress detections on isolated points and at the support boundary. The approach is evaluated on synthetic data, UCI benchmarks, and a real electronic health-record collection, where it is reported to outperform several baseline detectors.
Significance. If the empirical gains are reproducible and the regularization does not systematically inflate false positives near boundaries, the method would supply a lightweight graph-based alternative for label-anomaly detection in semi-supervised settings. The explicit handling of isolated and boundary cases addresses a known practical weakness of harmonic-function label propagation and could be useful in domains such as clinical decision auditing.
major comments (1)
- The abstract asserts outperformance on synthetic, UCI, and EHR data yet supplies no numerical results, error bars, ablation tables, or description of how regularization parameters were selected. Because the central claim is that the regularized soft-harmonic estimator reliably separates anomalous mislabeling from normal variation, the absence of these quantitative details leaves the efficacy statement only weakly supported.
minor comments (2)
- Notation for the soft-harmonic solution and the added regularization term should be introduced with explicit equations rather than prose descriptions alone.
- The manuscript should clarify whether the graph construction (k-NN, kernel, etc.) is held fixed across all baselines or tuned per method.
Simulated Author's Rebuttal
We thank the referee for the constructive feedback on our submission. We address the major comment below and outline the revisions we will implement to strengthen the empirical presentation.
read point-by-point responses
-
Referee: The abstract asserts outperformance on synthetic, UCI, and EHR data yet supplies no numerical results, error bars, ablation tables, or description of how regularization parameters were selected. Because the central claim is that the regularized soft-harmonic estimator reliably separates anomalous mislabeling from normal variation, the absence of these quantitative details leaves the efficacy statement only weakly supported.
Authors: We agree that the abstract provides only a high-level statement of outperformance without accompanying numbers or methodological details on regularization. Although the body of the manuscript reports comparative results against baselines on the synthetic, UCI, and EHR collections, we acknowledge that the absence of error bars, ablation studies, and an explicit account of parameter selection weakens the support for the central claim. In the revised version we will add error bars derived from repeated runs to all performance tables, include ablation experiments isolating the effect of each regularization term, and describe the regularization-parameter selection procedure (grid search over a validation split). We will also insert a concise quantitative summary into the abstract to give readers immediate evidence of the reported gains. revision: yes
Circularity Check
No significant circularity; derivation remains self-contained
full rationale
The paper describes a non-parametric conditional anomaly detection method that adapts the soft harmonic solution from graph-based label propagation, adds an explicit regularization term targeting isolated points and support boundaries, and uses the resulting label confidence estimates to flag anomalous mislabelings. No equations, derivations, or claims in the abstract reduce the anomaly score to a fitted parameter renamed as a prediction, a self-citation chain that bears the central load, or any other enumerated circular pattern. The regularization step is presented as an independent modification rather than a re-expression of the input data, and the overall construction retains independent content beyond its inputs.
Axiom & Free-Parameter Ledger
Reference graph
Works this paper leans on
-
[1]
Novelty detection: a review, part 1: statistical approaches,
M. Markou and S. Singh, “Novelty detection: a review, part 1: statistical approaches,”Signal Process., vol. 83, no. 12, pp. 2481–2497, 2003
work page 2003
-
[2]
Novelty detection: a review, part 2: neural network based approaches,
——, “Novelty detection: a review, part 2: neural network based approaches,”Signal Process., vol. 83, no. 12, pp. 2499– 2521, 2003
work page 2003
-
[3]
V . Chandola, A. Banerjee, and V . Kumar, “Anomaly detection: A survey,”ACM Comput. Surv., vol. 41, pp. 15:1–15:58, July 2009. [Online]. Available: http: //doi.acm.org/10.1145/1541880.1541882
-
[4]
Evidence-based anomaly detection,
M. Hauskrecht, M. Valko, B. Kveton, S. Visweswaram, and G. Cooper, “Evidence-based anomaly detection,” inAn- nual American Medical Informatics Association Symposium, November 2007, pp. 319–324
work page 2007
-
[5]
Conditional anomaly detection meth- ods for patient-management alert systems,
M. Valko, G. Cooper, A. Seybert, S. Visweswaran, M. Saul, and M. Hauskrecht, “Conditional anomaly detection meth- ods for patient-management alert systems,” inWorkshop on Machine Learning in Health Care Applications in The 25th International Conference on Machine Learning, 2008
work page 2008
-
[6]
Anomaly pattern detec- tion in categorical datasets,
K. Das, J. Schneider, and D. B. Neill, “Anomaly pattern detec- tion in categorical datasets,” inProceeding of the 14th ACM SIGKDD international conference on Knowledge discovery and data mining, ser. KDD ’08. New York, NY , USA: ACM, 2008, pp. 169–176
work page 2008
-
[7]
Conditional outlier detection for clinical alerting,
M. Hauskrecht, M. Valko, I. Batal, G. Clermont, S. Visweswaram, and G. Cooper, “Conditional outlier detection for clinical alerting,”Annual American Medical Informatics Association Symposium, 2010
work page 2010
-
[8]
An auctioning reputation system based on anomaly detection,
S. Rubin, M. Christodorescu, V . Ganapathy, J. T. Giffin, L. Kruger, H. Wang, and N. Kidd, “An auctioning reputation system based on anomaly detection,” inProceedings of the 12th ACM conference on Computer and communications security, ser. CCS ’05. New York, NY , USA: ACM, 2005, pp. 270–279
work page 2005
-
[9]
Detecting outlier sections in us congressional legislation,
E. Aktolga, I. Ros, and Y . Assogba, “Detecting outlier sections in us congressional legislation,” inProceedings of SIGIR, 2010, IR
work page 2010
-
[10]
Bayesian anomaly detection methods for social networks,
N. A. Heard, D. J. Weston, K. Platanioti, and D. J. Hand, “Bayesian anomaly detection methods for social networks,” Annals of Applied Statistics, vol. 4, pp. 645–662, 2010
work page 2010
-
[11]
Estimating time-varying networks,
M. Kolar, L. Song, A. Ahmed, and E. P. Xing, “Estimating time-varying networks,”Annals of Applied Statistics, vol. 4, pp. 94–123, 2010
work page 2010
-
[12]
S. Papadimitriou and C. Faloutsos, “Cross-outlier detection,” inAdvances in Spatial and Temporal Databases, 8th Interna- tional Symposium, SSTD 2003, Santorini Island, Greece, July 24-27, 2003, Proceedings, T. Hadzilacos, Y . Manolopoulos, J. F. Roddick, and Y . Theodoridis, Eds., vol. 2750, 2003, pp. 199–213
work page 2003
-
[13]
Conditional anomaly detection,
X. Song, M. Wu, and C. Jermaine, “Conditional anomaly detection,”IEEE Transactions on Knowledge and Data En- gineering, vol. 19, no. 5, pp. 631–645, 2007, fellow-Sanjay Ranka
work page 2007
-
[14]
Distance metric learning for conditional anomaly detection,
M. Valko and M. Hauskrecht, “Distance metric learning for conditional anomaly detection,” inTwenty-First International Florida Artificial Intelligence Research Society Conference. AAAI Press, 2008
work page 2008
-
[15]
Identifying mislabeled training data,
C. E. Brodley and M. A. Friedl, “Identifying mislabeled training data,”J. Artif. Intell. Res. (JAIR), vol. 11, pp. 131– 167, 1999
work page 1999
-
[16]
Ensemble methods for noise elimination in classification problems
S. Verbaeten and A. V . Assche., “Ensemble methods for noise elimination in classification problems.” inProceeding of 4th International Workshop on Multiple Classifier Systems, 2003
work page 2003
-
[17]
Editing training data for knn classifiers with neural network ensemble
Y . Jiang and Z.-H. Zhou, “Editing training data for knn classifiers with neural network ensemble.” inLecture Notes in Computer Science 3173, 2004, pp. 356–361
work page 2004
-
[18]
Analysis of new techniques to obtain quality training sets
J. Sanchez, R. Barandela, A. I. Marques, R. Alejo, and B. J., “Analysis of new techniques to obtain quality training sets.” Pattern Recognition Letteres 24, pp. 1015–1022, 2003
work page 2003
-
[19]
Kernel based detection of mislabeled training examples,
H. Valizadegan and P.-N. Tan, “Kernel based detection of mislabeled training examples,” inProceedings of the Seventh SIAM International Conference on Data Mining, April 26-28, 2007, Minneapolis, Minnesota, USA, 2007
work page 2007
-
[20]
Learning with local and global consistency,
D. Zhou, O. Bousquet, T. N. Lal, J. Weston, and B. Scholkopf, “Learning with local and global consistency,”Advances in Neural Information Processing Systems, vol. 16, pp. 321–328, 2004
work page 2004
-
[21]
Semi-supervised learning using gaussian fields and harmonic functions,
X. Zhu, Z. Ghahramani, and J. Lafferty, “Semi-supervised learning using gaussian fields and harmonic functions,” in Proceedings of the 20th International Conference on Machine Learning, 2003, pp. 912–919
work page 2003
-
[22]
Stability of transductive regression algorithms,
C. Cortes, M. Mohri, D. Pechyony, and A. Rastogi, “Stability of transductive regression algorithms,” inProceedings of the 25th International Conference on Machine Learning, 2008, pp. 176–183
work page 2008
-
[23]
R. Gray and D. Neuhoff, “Quantization,”IEEE Transactions on Information Theory, vol. 44, no. 6, pp. 2325–2383, 1998
work page 1998
-
[24]
Estimating the support of a high- dimensional distribution,
B. Scholkopf, J. C. Platt, J. Shawe-taylor, A. J. Smola, and R. C. Williamson, “Estimating the support of a high- dimensional distribution,”Neural Computation, vol. 13, p. 2001, 1999
work page 2001
- [25]
-
[26]
V . N. Vapnik,The nature of statistical learning theory. New York, NY , USA: Springer-Verlag New York, Inc., 1995
work page 1995
-
[27]
UCI machine learning repository,
A. Asuncion and D. Newman, “UCI machine learning repository,” 2011. [Online]. Available: http://www.ics.uci. edu/$\sim$mlearn/{MLR}epository.html
work page 2011
-
[28]
The meaning and use of the area under a receiver operating characteristic (roc) curve
J. A. Hanley and B. J. Mcneil, “The meaning and use of the area under a receiver operating characteristic (roc) curve.” Radiology, vol. 143, no. 1, pp. 29–36, April 1982
work page 1982
-
[29]
A tutorial on spectral clustering,
U. Luxburg, “A tutorial on spectral clustering,”Statistics and Computing, vol. 17, no. 4, pp. 395–416, 2007
work page 2007
discussion (0)
Sign in with ORCID, Apple, or X to comment. Anyone can read and Pith papers without signing in.