Dialysis Risk Prediction and Treatment Effect Estimation for AKI patients using Longitudinal Electronic Health Records
Pith reviewed 2026-05-08 04:21 UTC · model grok-4.3
The pith
A transformer model on longitudinal EHR data predicts dialysis risk and estimates medication treatment effects in AKI patients.
A machine-rendered reading of the paper's core claim, the machinery that carries it, and where it could break.
Core claim
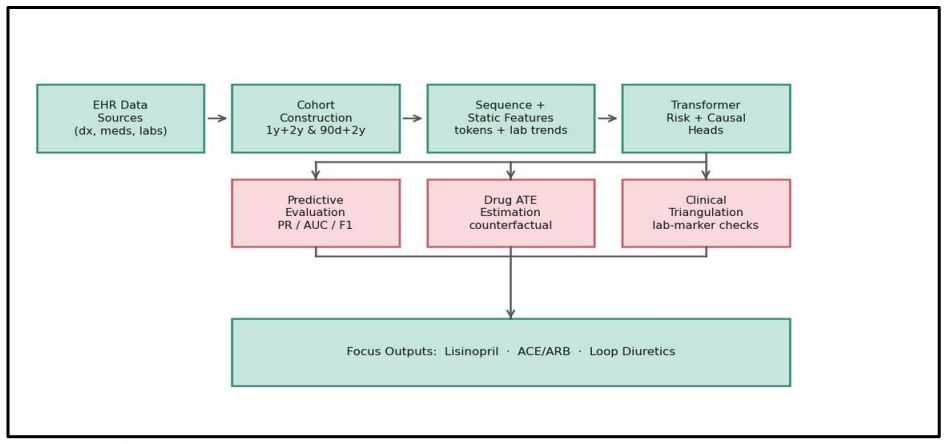
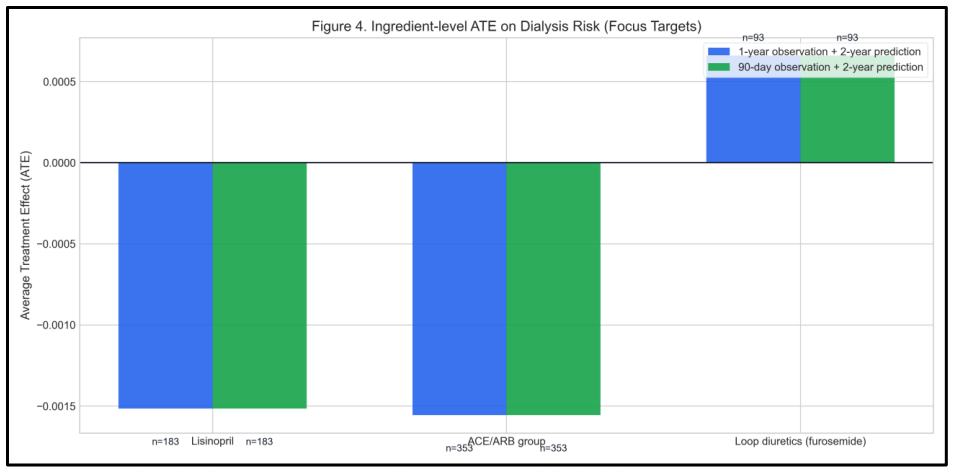
The authors assembled a fixed-window cohort of 81,401 AKI patients with 90-day observation periods and 730-day outcome windows, then trained a transformer-based causal multi-head model on full sequences of medical events and lab values. The model delivers dialysis risk predictions at an AUC of 0.694 while estimating average treatment effects via counterfactual removal and insertion of medication exposures. Post-hoc analyses using IPTW, AIPW, and adjusted regression on changes in eGFR, creatinine, and BUN yield partial support for protective-direction effects from ACE/ARB exposures and worsening-direction signals from loop diuretics.
What carries the argument
The transformer-based causal multi-head model that jointly predicts the binary dialysis outcome and computes treatment effects by generating counterfactual medication histories.
If this is right
- Patients can be stratified by predicted risk of progressing to dialysis within two years.
- Counterfactual medication simulations supply ingredient-level estimates of how exposures alter the probability of the rare outcome.
- Lab-based post-hoc checks provide initial clinical directionality for common drugs used in this population.
- The low prevalence of the outcome (1.1 percent) is explicitly addressed by the chosen performance metrics and decision threshold.
Where Pith is reading between the lines
- The same longitudinal modeling strategy could be applied to other infrequent but high-stakes endpoints in chronic disease where randomized trials are logistically difficult.
- Incorporating dynamic kidney-function trajectories appears central to both the predictive accuracy and the causal estimates, suggesting similar gains in related renal or cardiovascular settings.
- If external validation confirms the directional medication signals, the framework could support decision aids that weigh immediate drug benefits against longer-term dialysis risk.
Load-bearing premise
The causal estimates rest on the premise that no important confounding variables are missing from the records and that altering medication histories in simulation produces valid representations of real-world exposure changes.
What would settle it
A randomized trial that assigns ACE/ARB or loop diuretic exposure to comparable AKI patients and tracks subsequent dialysis rates would contradict the reported directional signals if the trial shows null or reversed effects.
Figures
read the original abstract
Progression to dialysis or end-stage renal disease is a rare but clinically important outcome. Clinicians need evidence on how medication exposures influence downstream risk. We constructed a fixed-window EHR cohort (90-day observation, 730-day prediction; N=81401; dialysis/ESRD prevalence: 1.1%) and modeled sequences of diagnoses, procedures, and medications with kidney laboratory trends (creatinine, BUN, eGFR). A transformer-based causal multi-head model was trained to estimate drug- and ingredient-level average treatment effects (ATEs) using counterfactual exposure removal and insertion under a full medication history setup. On test set, predictive performance reached an AUC of 0.694 and PR-AUC of 0.094. At the selected decision threshold (0.883), the model achieved an F1 score of 0.201 with a Brier score of 0.018. Post-hoc causal analyses of lab changes (eGFR, creatinine, BUN) using IPTW, AIPW, naive, and covariate-adjusted OLS methods assessed clinical directionality. Results showed partial protective-direction support for ACE/ARB exposures and worsening-direction signals for loop diuretics.
Editorial analysis
A structured set of objections, weighed in public.
Referee Report
Summary. The manuscript develops a transformer-based causal multi-head model to predict progression to dialysis or ESRD (1.1% prevalence) in a cohort of 81,401 AKI patients using 90-day longitudinal EHR sequences of diagnoses, procedures, medications, and kidney labs, followed by a 730-day horizon. The model reports test-set AUC 0.694, PR-AUC 0.094, and F1 0.201 at threshold 0.883. It further estimates drug-level ATEs via counterfactual medication-history removal/insertion and post-hoc IPTW/AIPW/OLS analyses on eGFR/creatinine/BUN trajectories, reporting partial protective signals for ACE/ARB exposures and worsening signals for loop diuretics.
Significance. If the causal estimates hold after addressing confounding, the work could inform medication management to reduce dialysis risk in AKI. Combining sequence modeling with counterfactual ATE estimation on large-scale EHR is a relevant direction for clinical ML. The large cohort size and focus on a rare, high-stakes outcome are strengths, but the modest predictive metrics and untested causal assumptions limit immediate clinical significance.
major comments (3)
- Abstract: The reported AUC of 0.694 and PR-AUC of 0.094 are presented without any baseline comparisons (e.g., logistic regression or XGBoost on aggregated features), so it is impossible to determine whether the transformer causal multi-head architecture improves upon standard approaches for this rare-event task.
- Causal analysis section: The ATE estimates for ACE/ARB (protective) and loop diuretics (worsening) rely on IPTW/AIPW/OLS applied to lab changes after counterfactual exposure modification, but no sensitivity analyses for unmeasured confounding (E-values, negative controls, or placebo tests) are reported despite the observational EHR setting where indication bias and incomplete histories are common.
- Methods: The manuscript provides no explicit description of how class imbalance (1.1% prevalence), decision-threshold selection (0.883), or EHR missingness were handled within the transformer training or the counterfactual multi-head setup, which directly affects the reliability of both the F1 score and the reported ATE directions.
minor comments (1)
- Abstract: The Brier score of 0.018 is reported but its relationship to the chosen operating threshold and calibration in the presence of imbalance could be clarified for readers.
Simulated Author's Rebuttal
We thank the referee for their constructive and detailed comments. We address each major comment below, agreeing where revisions are warranted to enhance the manuscript's clarity and rigor.
read point-by-point responses
-
Referee: Abstract: The reported AUC of 0.694 and PR-AUC of 0.094 are presented without any baseline comparisons (e.g., logistic regression or XGBoost on aggregated features), so it is impossible to determine whether the transformer causal multi-head architecture improves upon standard approaches for this rare-event task.
Authors: We agree that baseline comparisons are necessary to contextualize our model's performance. In the revised manuscript, we will include results from logistic regression and XGBoost models trained on aggregated EHR features (e.g., summary statistics of labs, event counts for diagnoses, procedures, and medications). This addition will demonstrate the relative contribution of the sequential transformer architecture for the rare-event prediction task. revision: yes
-
Referee: Causal analysis section: The ATE estimates for ACE/ARB (protective) and loop diuretics (worsening) rely on IPTW/AIPW/OLS applied to lab changes after counterfactual exposure modification, but no sensitivity analyses for unmeasured confounding (E-values, negative controls, or placebo tests) are reported despite the observational EHR setting where indication bias and incomplete histories are common.
Authors: We acknowledge the value of sensitivity analyses for observational causal estimates. Our multi-estimator approach (IPTW, AIPW, OLS) already provides some robustness, but we will add E-value calculations for the key ATEs in the revision to assess the potential impact of unmeasured confounding. Negative controls are challenging given the medication history complexity, but we will include relevant placebo tests where feasible and discuss limitations transparently. revision: yes
-
Referee: Methods: The manuscript provides no explicit description of how class imbalance (1.1% prevalence), decision-threshold selection (0.883), or EHR missingness were handled within the transformer training or the counterfactual multi-head setup, which directly affects the reliability of both the F1 score and the reported ATE directions.
Authors: We appreciate this observation. The revised Methods section will explicitly detail: (i) use of weighted loss functions to address class imbalance in transformer training; (ii) threshold selection (0.883) via F1 optimization on the validation set; and (iii) missingness handling via forward-fill imputation for labs and binary indicators for absent events. These clarifications will also address implications for the counterfactual ATE estimates. revision: yes
Circularity Check
No significant circularity; derivation relies on held-out evaluation and standard causal methods
full rationale
The paper trains a transformer model on longitudinal EHR sequences for dialysis risk prediction, evaluates it on a held-out test set (AUC 0.694, PR-AUC 0.094), and performs separate post-hoc IPTW/AIPW/OLS analyses on lab trajectories to assess treatment effect directionality. No equations, self-citations, or fitted-parameter renamings are shown that reduce the reported predictions or ATEs to quantities defined by the same inputs by construction. The central claims rest on external assumptions (no unmeasured confounding, valid counterfactuals) rather than internal self-definition, making the chain self-contained against the provided benchmarks.
Axiom & Free-Parameter Ledger
free parameters (2)
- decision threshold =
0.883
- transformer hyperparameters
axioms (3)
- domain assumption No unmeasured confounding
- domain assumption Counterfactual exposure removal and insertion identify ATE
- domain assumption Fixed 90-day observation and 730-day prediction windows capture relevant dynamics
Reference graph
Works this paper leans on
-
[1]
Coca SG, Yusuf B, Shlipak MG, Garg AX, Parikh CR. Long -term risk of mortality and other adverse outcomes after acute kidney injury: a systematic review and meta-analysis. Am J Kidney Dis. 2009;53(6):961-973
work page 2009
-
[2]
Causal inference in statistics: an overview
Pearl J. Causal inference in statistics: an overview. Stat Surv. 2009;3:96-146
work page 2009
-
[3]
Medication regimen complexity and polypharmacy in older adults
Wimmer BC, Bell JS, Fastbom J, et al. Medication regimen complexity and polypharmacy in older adults. Clin Interv Aging. 2017;12:193-202
work page 2017
-
[4]
KDIGO Clinical Practice Guideline for Acute Kidney Injury
Kidney Disease: Improving Global Outcomes (KDIGO) Acute Kidney Injury Work Group. KDIGO Clinical Practice Guideline for Acute Kidney Injury. Kidney Int Suppl. 2012;2:1-138
work page 2012
-
[5]
KDIGO 2012 Clinical Practice Guideline for the Evaluation and Management of Chronic Kidney Disease
Kidney Disease: Improving Global Outcomes (KDIGO) CKD Work Group. KDIGO 2012 Clinical Practice Guideline for the Evaluation and Management of Chronic Kidney Disease. Kidney Int Suppl. 2013;3:1-150
work page 2012
-
[6]
Dapagliflozin in Patients with Chronic Kidney Disease
Heerspink HJL, Stefánsson BV, Correa -Rotter R, et al. Dapagliflozin in Patients with Chronic Kidney Disease. N Engl J Med. 2020;383:1436-46
work page 2020
-
[7]
Empagliflozin in Patients with Chronic Kidney Disease
Herrington WG, Staplin N, Wanner C, et al. Empagliflozin in Patients with Chronic Kidney Disease. N Engl J Med. 2023;388:117-27
work page 2023
-
[8]
Assessing the Performance of Prediction Models: A Framework for Traditional and Novel Measures
Steyerberg EW, Vickers AJ, Cook NR, et al. Assessing the Performance of Prediction Models: A Framework for Traditional and Novel Measures. Epidemiology. 2010;21:128-38
work page 2010
-
[9]
Saito T, Rehmsmeier M. The Precision -Recall Plot Is More Informative than the ROC Plot When Evaluating Binary Classifiers on Imbalanced Datasets. PLoS One. 2015;10:e0118432
work page 2015
-
[10]
Verification of forecasts expressed in terms of probability
Brier GW. Verification of forecasts expressed in terms of probability. Mon Weather Rev. 1950;78:1-3
work page 1950
-
[11]
RETAIN: An Interpretable Predictive Model for Healthcare using Reverse Time Attention Mechanism
Choi E, Bahadori MT, Sun J, Kulas J, Schuetz A, Stewart WF. RETAIN: An Interpretable Predictive Model for Healthcare using Reverse Time Attention Mechanism. In: Advances in Neural Information Processing Systems (NeurIPS); 2016. p. 3504-12
work page 2016
-
[12]
BEHRT: Transformer for Electronic Health Records
Li Y, Rao S, Solares JRA, et al. BEHRT: Transformer for Electronic Health Records. Sci Rep. 2020;10:7155
work page 2020
-
[13]
Rasmy L, Wu Y, Wang N, et al. Med -BERT: pretrained contextualized embeddings on large -scale structured electronic health records for disease prediction. NPJ Digit Med. 2021;4:86
work page 2021
-
[14]
Vaswani A, Shazeer N, Parmar N, et al. Attention Is All You Need. In: Advances in Neural Information Processing Systems (NeurIPS); 2017. p. 5998-6008
work page 2017
-
[15]
Estimating Individual Treatment Effect: generalization bounds and algorithms
Shalit U, Johansson FD, Sontag D. Estimating Individual Treatment Effect: generalization bounds and algorithms. In: Proceedings of the International Conference on Machine Learning (ICML); 2017. p. 3076-85
work page 2017
-
[16]
Adapting Neural Networks for the Estimation of Treatment Effects
Shi C, Blei DM, Veitch V. Adapting Neural Networks for the Estimation of Treatment Effects. In: Advances in Neural Information Processing Systems (NeurIPS); 2019. p. 2503-13
work page 2019
-
[17]
Focal Loss for Dense Object Detection
Lin TY, Goyal P, Girshick R, He K, Dollár P. Focal Loss for Dense Object Detection. In: Proceedings of the IEEE International Conference on Computer Vision (ICCV); 2017. p. 2999-3007
work page 2017
-
[18]
Class -Balanced Loss Based on Effective Number of Samples
Cui Y, Jia M, Lin TSY, Song Y, Belongie S. Class -Balanced Loss Based on Effective Number of Samples. In: Proceedings of the IEEE/CVF Conference on Computer Vision and Pattern Recognition (CVPR); 2019. p. 9268- 77
work page 2019
-
[19]
DrugBank 5.0: a major update to the DrugBank database for 2018
Wishart DS, Feunang YD, Guo AC, et al. DrugBank 5.0: a major update to the DrugBank database for 2018. Nucleic Acids Res. 2018;46:D1074-82
work page 2018
-
[20]
Modeling polypharmacy side effects with graph convolutional networks
Zitnik M, Agrawal M, Leskovec J. Modeling polypharmacy side effects with graph convolutional networks. Bioinformatics. 2018;34:i457-66
work page 2018
-
[21]
Hernán MA, Robins JM. Causal inference: what if. Boca Raton (FL): Chapman & Hall/CRC; 2020
work page 2020
-
[22]
The central role of the propensity score in observational studies for causal effects
Rosenbaum PR, Rubin DB. The central role of the propensity score in observational studies for causal effects. Biometrika. 1983;70:41-55
work page 1983
-
[23]
Controlling the false discovery rate: a practical and powerful approach to multiple testing
Benjamini Y, Hochberg Y. Controlling the false discovery rate: a practical and powerful approach to multiple testing. J R Stat Soc Series B Stat Methodol. 1995;57:289-300
work page 1995
-
[24]
An Introduction to the Bootstrap
Efron B, Tibshirani RJ. An Introduction to the Bootstrap. New York (NY): Chapman & Hall; 1993
work page 1993
-
[25]
Tangri N, Grams ME, Levey AS, et al. Multinational assessment of accuracy of equations for predicting risk of kidney failure: a meta-analysis. JAMA. 2016;315:164-74
work page 2016
-
[26]
Major RW, Shepherd D, Medcalf JF, et al. The kidney failure risk equation for prediction of end -stage renal disease in UK primary care: an external validation and clinical impact projection cohort study. PLoS Med. 2019;16:e1002955
work page 2019
-
[27]
Machine learning to predict end -stage kidney disease in chronic kidney disease
Li Y, Tang W, Li Y, et al. Machine learning to predict end -stage kidney disease in chronic kidney disease. Sci Rep. 2022;12:12316
work page 2022
discussion (0)
Sign in with ORCID, Apple, or X to comment. Anyone can read and Pith papers without signing in.