Recognition: unknown
DATAREEL: Automated Data-Driven Video Story Generation with Animations
Pith reviewed 2026-05-07 16:18 UTC · model grok-4.3
The pith
Multi-agent framework automates animated data video stories and outperforms direct prompting on a new benchmark of 328 stories.
A machine-rendered reading of the paper's core claim, the machinery that carries it, and where it could break.
Core claim
DataReel supplies 328 stories pairing structured data, visualizations, and narration transcripts for systematic evaluation of automated data video generation. A multi-agent framework decomposes the task into planning, generation, and verification stages that mirror human processes. This approach outperforms direct prompting baselines in automatic and human evaluations while exposing ongoing difficulties in coordinating animation, narration, and visual emphasis.
What carries the argument
The multi-agent framework that divides video story generation into planning, generation, and verification stages to coordinate visual encoding, temporal progression, and narration.
If this is right
- Systematic benchmarks like DataReel enable direct comparison of future models for automated data video production.
- Decomposing complex multimedia tasks into planning, generation, and verification stages can improve output quality over single-prompt methods.
- Persistent gaps in animation-narration coordination identify a concrete target for additional model improvements.
- Automated generation reduces reliance on manual expertise in visualization design and video editing for data stories.
Where Pith is reading between the lines
- The benchmark could support extensions to interactive or real-time data updates in storytelling applications.
- Agent-based decomposition patterns may transfer to other multi-modal generation problems involving synchronized visuals and text.
- Public release of the dataset allows independent testing of coordination techniques across different model architectures.
Load-bearing premise
The 328 collected stories represent a typical range of data video storytelling tasks and the chosen automatic and human metrics sufficiently measure coordination quality between animation and narration.
What would settle it
A follow-up test set of data video stories where direct prompting achieves equal or higher scores than the multi-agent system on coordination-focused human or automatic metrics would challenge the claimed advantage.
Figures


read the original abstract
Data videos are a powerful medium for visual data based storytelling, combining animated, chart-centric visualizations with synchronized narration. Widely used in journalism, education, and public communication, they help audiences understand complex data through clear and engaging visual explanations. Despite their growing impact, generating data-driven video stories remains challenging, as it requires careful coordination of visual encoding, temporal progression, and narration and substantial expertise in visualization design, animation, and video-editing tools. Recent advances in large language models offer new opportunities to automate this process; however, there is currently no benchmark for rigorously evaluating models on animated visualization-based video storytelling. To address this gap, we introduce DataReel, a benchmark for automated data-driven video story generation comprising 328 real-world stories. Each story pairs structured data, a chart visualization, and a narration transcript, enabling systematic evaluation of models' abilities to generate animated data video stories. We further propose a multi-agent framework that decomposes the task into planning, generation, and verification stages, mirroring key aspects of the human storytelling process. Experiments show that this multi-agent approach outperforms direct prompting baselines under both automatic and human evaluations, while revealing persistent challenges in coordinating animation, narration, and visual emphasis. We release DataReel at https://github.com/vis-nlp/DataReel.
Editorial analysis
A structured set of objections, weighed in public.
Referee Report
Summary. The paper introduces DataReel, a benchmark of 328 real-world data video stories each pairing structured data, a chart visualization, and a narration transcript. It proposes a multi-agent framework that decomposes animated data-video story generation into planning, generation, and verification stages to better coordinate visual encoding, temporal progression, and narration. Experiments demonstrate that the multi-agent approach outperforms direct-prompting baselines on both automatic and human evaluations while surfacing persistent coordination challenges.
Significance. If the evaluation details are clarified, the work supplies a publicly released benchmark that fills a clear gap for rigorous assessment of automated data-video storytelling, an application area spanning journalism and education. The multi-agent decomposition explicitly mirrors human processes and the paper credits the benchmark release as enabling future research; these are concrete strengths for an empirical engineering contribution.
major comments (3)
- [Benchmark construction (abstract and §3)] Benchmark construction (abstract and §3): no statistics are supplied on domain coverage, chart-type diversity, story-length distribution, or the selection/split procedure for the 328 stories. Because the central claim is that the multi-agent framework outperforms baselines on this test set, the absence of these details leaves open the possibility that reported gains are benchmark-specific rather than general.
- [Experiments section] Evaluation protocol (Experiments section): automatic metric definitions, how they operationalize coordination failures between animation and narration, statistical significance tests, and inter-rater agreement for human scores are not reported. These omissions directly affect whether the outperformance claim can be interpreted as evidence of improved coordination.
- [Experiments section] Human evaluation rubrics (Experiments section): it is unclear whether raters were instructed to score explicit synchronization quality or overall story quality. If the latter, the human results cannot isolate the framework's handling of the coordination challenges highlighted in the abstract.
minor comments (2)
- [Abstract] Abstract: the phrase 'persistent challenges in coordinating animation, narration, and visual emphasis' is stated without a forward reference to where these challenges are quantified or illustrated in the results.
- [Results tables] Notation and figures: ensure all tables comparing automatic and human scores include explicit column definitions and error bars or significance markers.
Simulated Author's Rebuttal
We thank the referee for the constructive feedback, which highlights important areas for clarification in the benchmark and evaluation sections. We address each major comment below and will incorporate the suggested details into the revised manuscript to strengthen the presentation of our results.
read point-by-point responses
-
Referee: Benchmark construction (abstract and §3): no statistics are supplied on domain coverage, chart-type diversity, story-length distribution, or the selection/split procedure for the 328 stories. Because the central claim is that the multi-agent framework outperforms baselines on this test set, the absence of these details leaves open the possibility that reported gains are benchmark-specific rather than general.
Authors: We agree that these statistics are necessary to support claims of generalizability. In the revised §3, we will add a dedicated subsection with: domain coverage (e.g., percentages from journalism, education, business, and science); chart-type distribution (bar, line, pie, scatter, etc.); story-length statistics (mean/median narration word count, animation duration range); and the collection/split procedure (curation criteria, sources, and train/test division if used). These additions will allow readers to evaluate whether performance gains are benchmark-specific. revision: yes
-
Referee: Evaluation protocol (Experiments section): automatic metric definitions, how they operationalize coordination failures between animation and narration, statistical significance tests, and inter-rater agreement for human scores are not reported. These omissions directly affect whether the outperformance claim can be interpreted as evidence of improved coordination.
Authors: We acknowledge the need for explicit definitions. The revised Experiments section will define each automatic metric (e.g., temporal alignment score, narration-animation overlap), explain their operationalization of coordination failures (via mismatch penalties and event synchronization), report statistical significance (paired t-tests with p-values), and include inter-rater agreement (Fleiss' kappa for human scores). This will directly tie the metrics to the coordination challenges discussed in the abstract. revision: yes
-
Referee: Human evaluation rubrics (Experiments section): it is unclear whether raters were instructed to score explicit synchronization quality or overall story quality. If the latter, the human results cannot isolate the framework's handling of the coordination challenges highlighted in the abstract.
Authors: The rubrics instructed raters to score both overall story quality and explicit synchronization aspects (visual-narration alignment, animation timing with speech). To address the ambiguity, we will revise the Experiments section to quote the exact rater instructions, emphasize the synchronization criteria, and report separate sub-scores for coordination quality where possible. This will better isolate the multi-agent framework's contributions to coordination. revision: yes
Circularity Check
No significant circularity in the empirical framework or benchmark evaluation
full rationale
The paper presents an empirical engineering contribution: collection of a 328-story benchmark and a multi-agent framework evaluated against direct-prompting baselines via automatic metrics and human judgments. No mathematical derivations, first-principles predictions, fitted parameters renamed as outputs, or load-bearing self-citations appear in the abstract or described claims. The central results are direct experimental comparisons on external baselines, keeping the work self-contained without any reduction of results to inputs by construction.
Axiom & Free-Parameter Ledger
axioms (1)
- domain assumption Large language models can be prompted to perform planning, generation, and verification of animated data stories when decomposed into separate agents.
Reference graph
Works this paper leans on
-
[1]
doi: 10.1109/TVCG.2011.255. Jessica Hullman, Nicholas Diakopoulos, and Eytan Adar. Contextifier: Automatic generation of annotated stock visualizations. InProceedings of the SIGCHI Conference on Human Factors in Computing Systems, CHI ’13, pp. 2707–2716, New York, NY, USA, 2013a. Association for Computing Machinery. ISBN 9781450318990. doi: 10.1145/247065...
-
[5]
FORMAT: Produce two specific blocks of text. [[COLUMN_DATA]] Chart [N] - [Chart Type] [Markdown Table] ------------------- [[COLUMN_META]] Chart [N] - Type: [Chart Type], Description: [Chart Description], Mark: Data sample annotation shape for line chart or for Bar chart shape of bar, Background: [Style and Color], Gridlines: [Style and Color], Data Color...
-
[6]
If multiple images are provided, merge them into a single coherent dataset if they represent parts of the same chart
EXTRACT DATA: Identify all charts. If multiple images are provided, merge them into a single coherent dataset if they represent parts of the same chart
-
[7]
If not labeled, visually estimate it based on gridlines/axis scale
ESTIMATE: Every X-axis label must have a numeric Y-value. If not labeled, visually estimate it based on gridlines/axis scale. No missing values allowed
-
[8]
Adjust slightly if needed
SANITY CHECK: If a Pie Chart, values MUST sum to 100%. Adjust slightly if needed
-
[9]
chart"> - The SVG represents the FULL video frame - SVG MUST use a fixed resolution of 1280x720 pixels - <svg id=
FORMAT: Produce two specific blocks of text. [[COLUMN_DATA]] Chart [N] - [Chart Type] [Markdown Table] ------------------- [[COLUMN_META]] Chart [N] - Type: [Chart Type], Description: [Chart Description], Mark: Data sample annotation shape for line chart or for Bar chart shape of bar, Background: [Style and Color], Gridlines: [Style and Color], Data Color...
2023
-
[10]
Produce a structured animation plan (JSON)
-
[11]
The plan must specify how to replicate the layout, chart type, and positioning seen in the provided image
-
[12]
subtitles
Create a "subtitles" array within the JSON. Each entry must have ’start’, ’end’, and ’text’
-
[13]
Return JSON only
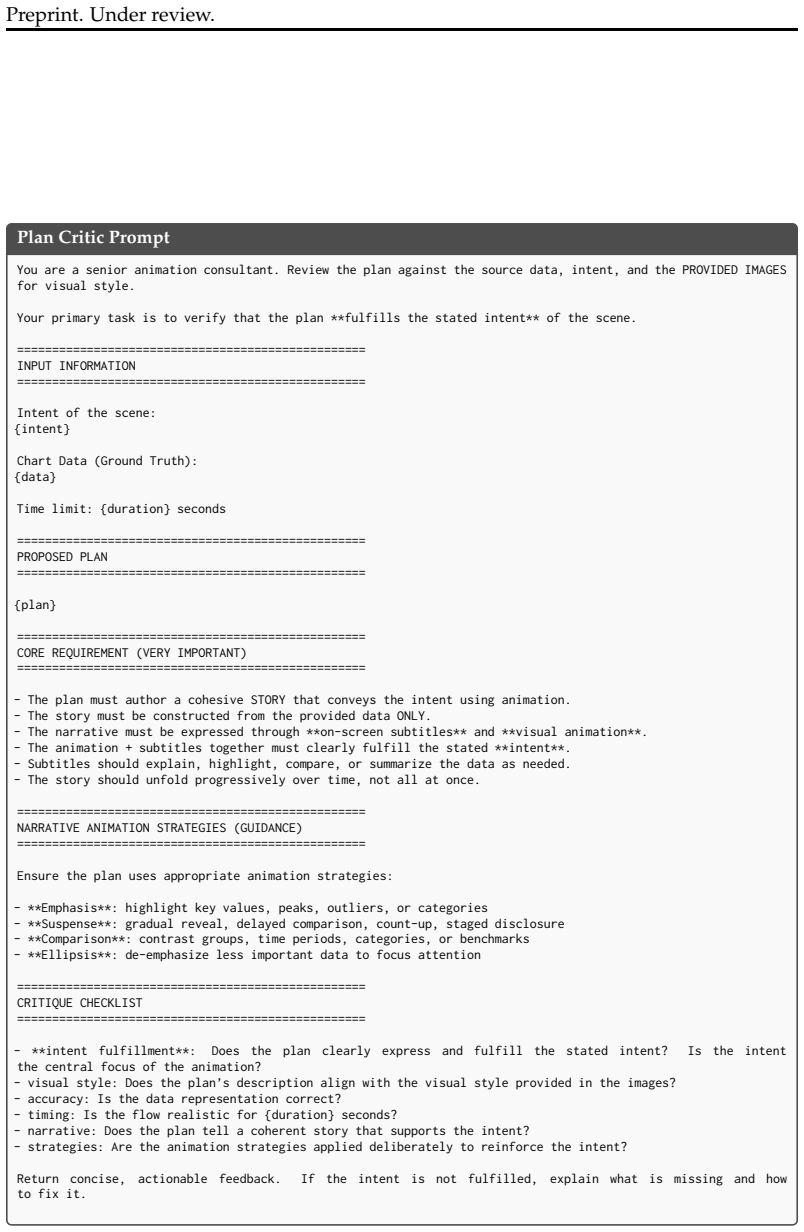
Ensure the visual animation stages align perfectly with these subtitle timestamps. Return JSON only. Figure 11: Director prompt used to produce a structured animation plan aligned with the scene intent and reference visual style. 21 Preprint. Under review. Plan Critic Prompt You are a senior animation consultant. Review the plan against the source data, i...
-
[14]
Exact Color Palette: Hex codes for background, marks, and text
-
[15]
Typography: Match font style and sizing
-
[16]
chart"> - The SVG represents the FULL video frame - SVG MUST use a fixed resolution of 1280x720 pixels - <svg id=
Layout: Replicate padding and positioning of elements. ================================================== STRICT RULES ================================================== - Output ONLY valid HTML - Use exactly ONE <svg id="chart"> - The SVG represents the FULL video frame - SVG MUST use a fixed resolution of 1280x720 pixels - <svg id="chart" width="1280" h...
-
[17]
**Animation Correctness**: Are the animations taking place accurately or are there issues like overlapping, clipping, or misplacement of text or visual elements?
-
[18]
**Time Utilization**: Is the video using the entire allotted duration effectively to tell the story? it is too fast or too slow? Does it end too early or rush key moments?
-
[19]
**Intent Expression**: Do the animations effectively express and support the intent?
-
[20]
**Animation-Subtitle Sync**: Are animations properly synchronized with subtitles? Do they appear together at the right moments?
-
[21]
**Animation Quality**: Are animations smooth, visible, and purposeful? Are there too many, too few, or poorly timed animations?
-
[22]
Otherwise, provide specific D3.js/CSS fixes with clear instructions on what animations to add, remove, change, or re-sync
**Animation Effectiveness**: Do the animations help the viewer understand the data story? Based on your assessment, provide specific feedback to: - **ADD** animations if key moments lack visual emphasis - **REMOVE** animations if they are distracting or redundant - **CHANGE** animations if timing, duration, or style needs adjustment - **EDIT** animations ...
-
[23]
- 0: The animation does not reflect the stated intent and lacks any coherent story
**Narrative Quality (0–5)** Evaluate whether the intended message of the scene is covered and conveyed as a coherent story through the sequence of animation scenes and subtitles. - 0: The animation does not reflect the stated intent and lacks any coherent story. - 1: The intent is barely addressed and the story is largely unclear or incomplete. - 2: The i...
-
[24]
- 0: Subtitles provide no meaningful information or insight
**Informativeness (0–5)** Evaluate how insightful the subtitles and accompanying animations are, beyond simply reading or restating the data. - 0: Subtitles provide no meaningful information or insight. - 1: Subtitles primarily read out data values with little to no interpretation. - 2: Some interpretation is present, but subtitles remain mostly descripti...
-
[25]
- 0: Completely diverges from transcript intent
**Subtitle–Transcript Similarity (0–5)** Evaluate how well the generated subtitles align with the original narration transcript. - 0: Completely diverges from transcript intent. - 1: Largely contradicts transcript. - 2: Partial overlap with missing key ideas. - 3: General alignment with omissions. - 4: Strong alignment with minor differences. - 5: Preserv...
-
[26]
- 0: HTML code is clearly incorrect, broken, or unrelated to the intended narration
**Code Correctness (0–5)** Evaluate whether the **HTML code structure and logic correctly support the narration’s intended animation plan**. - 0: HTML code is clearly incorrect, broken, or unrelated to the intended narration. - 1: Major structural or logical issues prevent the HTML from supporting the narration. - 2: Some parts align with the narration, b...
-
[27]
**Video A** - A generated data video (MP4)
-
[28]
**Video B** - Another generated data video (MP4)
-
[29]
================================================== EVALUATION CRITERIA ================================================== ————————————————–
A **reference screenshot** showing the expected visual style Your task is to compare Video A and Video B based on the criteria below and determine which video is better overall. ================================================== EVALUATION CRITERIA ================================================== ————————————————–
-
[30]
**Visualization Quality** Definition: Evaluate whether the visualization is rendered correctly and remains visually readable. Consider: - Are there rendering issues (blank screens, missing charts, visual glitches)? - Is the chart readable (no overlapping elements, clipping, or unreadable text)? - Is the visualization clean, legible, and well-structured? —...
-
[31]
**Subtitle-Animation Coherence** Definition: Evaluate alignment between what subtitles say and what the animation shows. Consider: - Do subtitles match what is being shown in the animation? - Is there proper timing and synchronization? - Do subtitles and visuals reinforce each other? ————————————————–
-
[32]
**Style Consistency** Definition: Evaluate how well each video maintains the visual style shown in the reference screenshot. Consider: - Does the video use similar colors, chart type, layout, and design elements? - How closely does each video follow the reference style? Figure 16: Prompt for the pairwise VLM judge used to compare two generated data videos...
1965
discussion (0)
Sign in with ORCID, Apple, or X to comment. Anyone can read and Pith papers without signing in.