Exploring Sustainability in Scientific Software through Code Quality & Test Coverage Metrics
Pith reviewed 2026-05-07 16:11 UTC · model grok-4.3
The pith
Sustainable scientific software projects show higher and more consistent test coverage with clearer links between code quality and testing.
A machine-rendered reading of the paper's core claim, the machinery that carries it, and where it could break.
Core claim
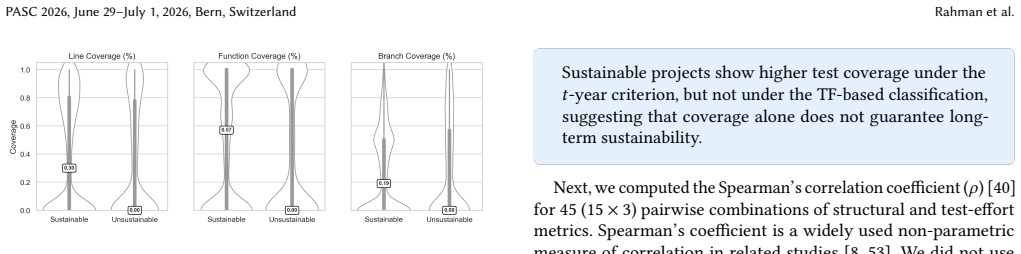
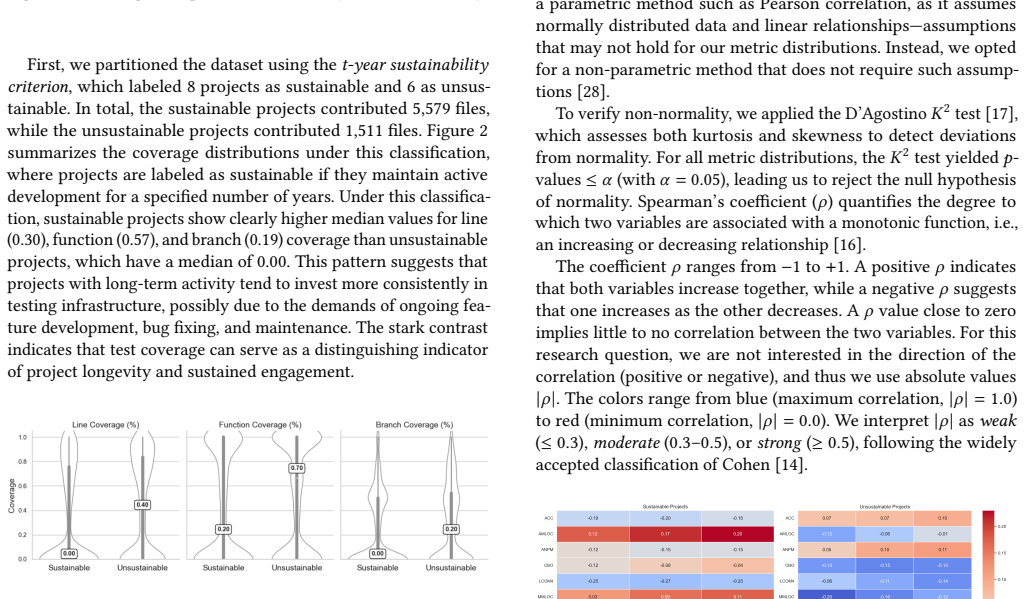
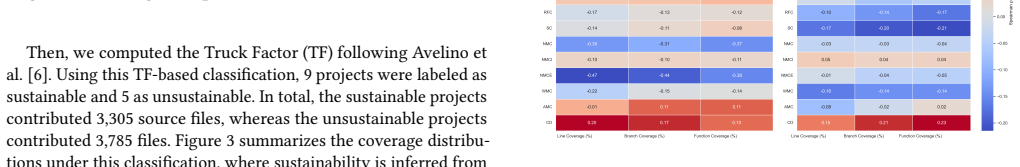
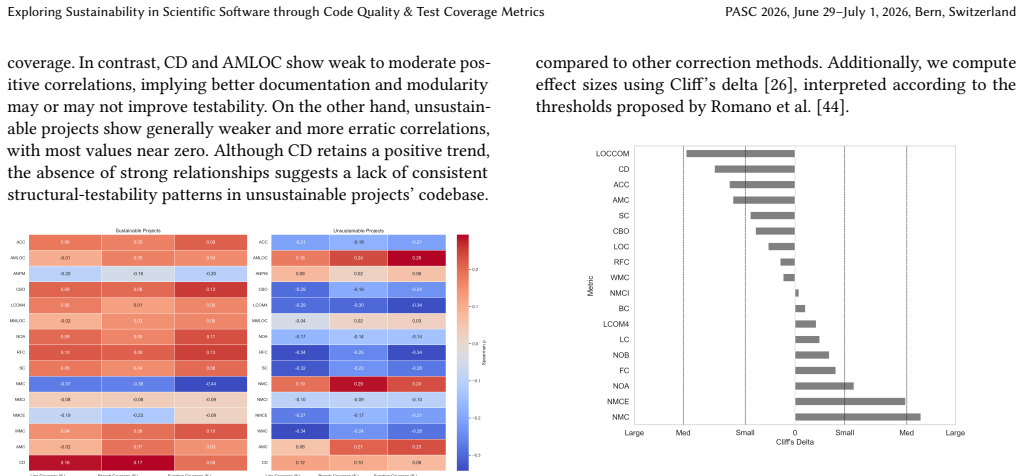
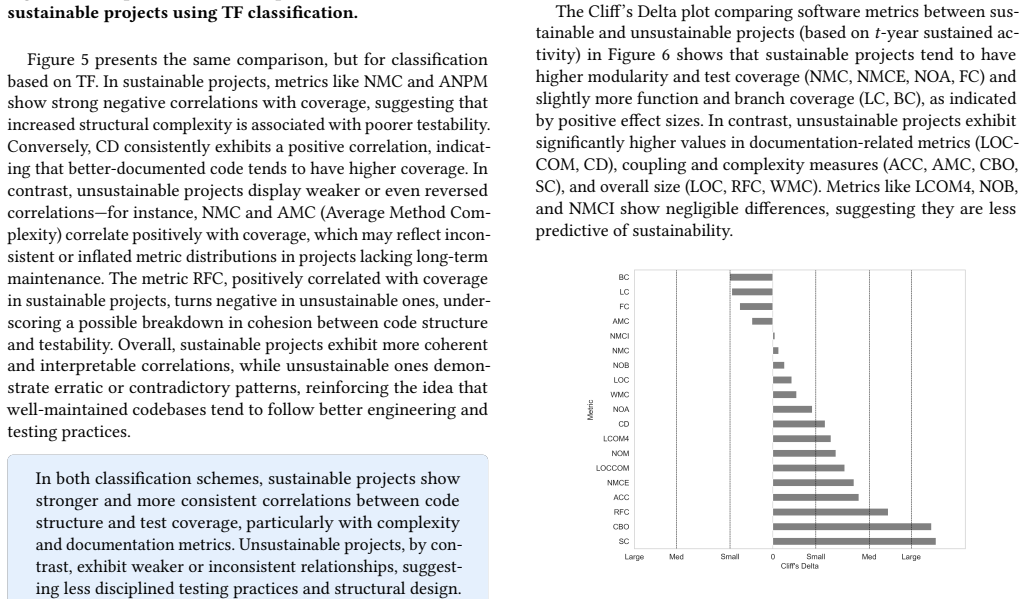
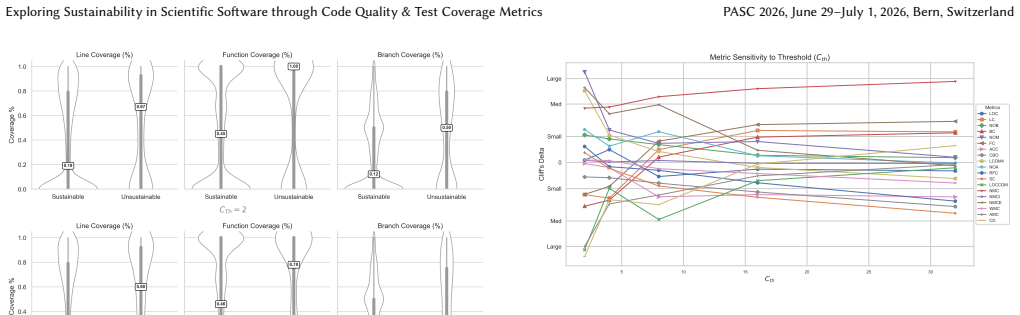
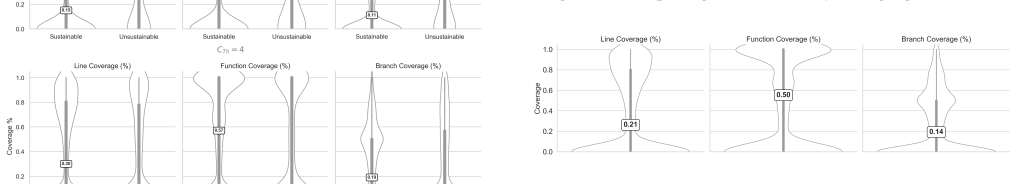
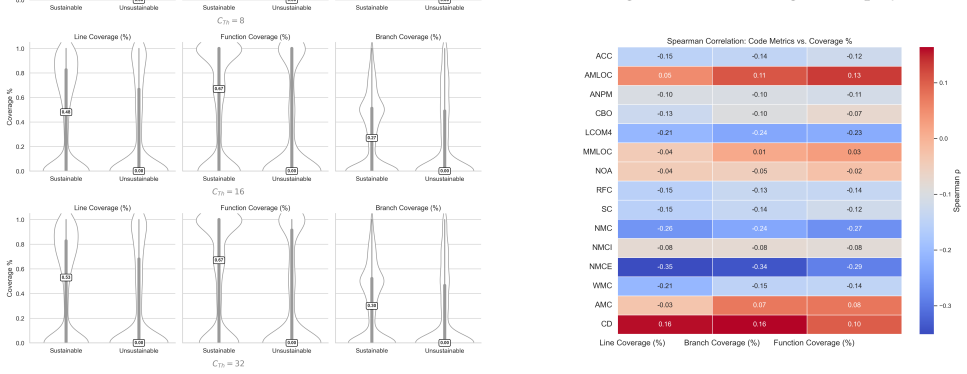
Sustainable projects exhibit higher, more consistent test coverage and clearer correlations between code quality and test metrics, whereas unsustainable projects show weaker patterns. Test coverage is low across scientific software in general, and high complexity and coupling reduce testability. The work offers a practical data-driven method for assessing long-term software health.
What carries the argument
Comparison of code structure, test coverage, and code-test correlations after grouping projects by independent sustainability criteria.
If this is right
- Test coverage levels and their consistency can serve as observable markers for predicting project sustainability.
- Reducing code complexity and coupling should improve testability and support longer-term viability.
- Low baseline test coverage across the field indicates a broad need for better testing practices in scientific software.
- Regular monitoring of these metrics provides a concrete way to track software health over time.
Where Pith is reading between the lines
- Teams maintaining scientific software could build simple dashboards that flag projects when test coverage drops or becomes inconsistent.
- The same metric patterns might help evaluate sustainability in non-scientific open-source projects where long-term use matters.
- Tracking these indicators across multiple versions of a project over years would test whether they reliably forecast future maintenance issues.
Load-bearing premise
Projects can be classified as sustainable or unsustainable using criteria that do not rely on the code quality and test coverage metrics being measured.
What would settle it
Applying an alternative classification of the same projects into sustainable and unsustainable groups and finding no difference in test coverage or code-test correlations.
Figures
read the original abstract
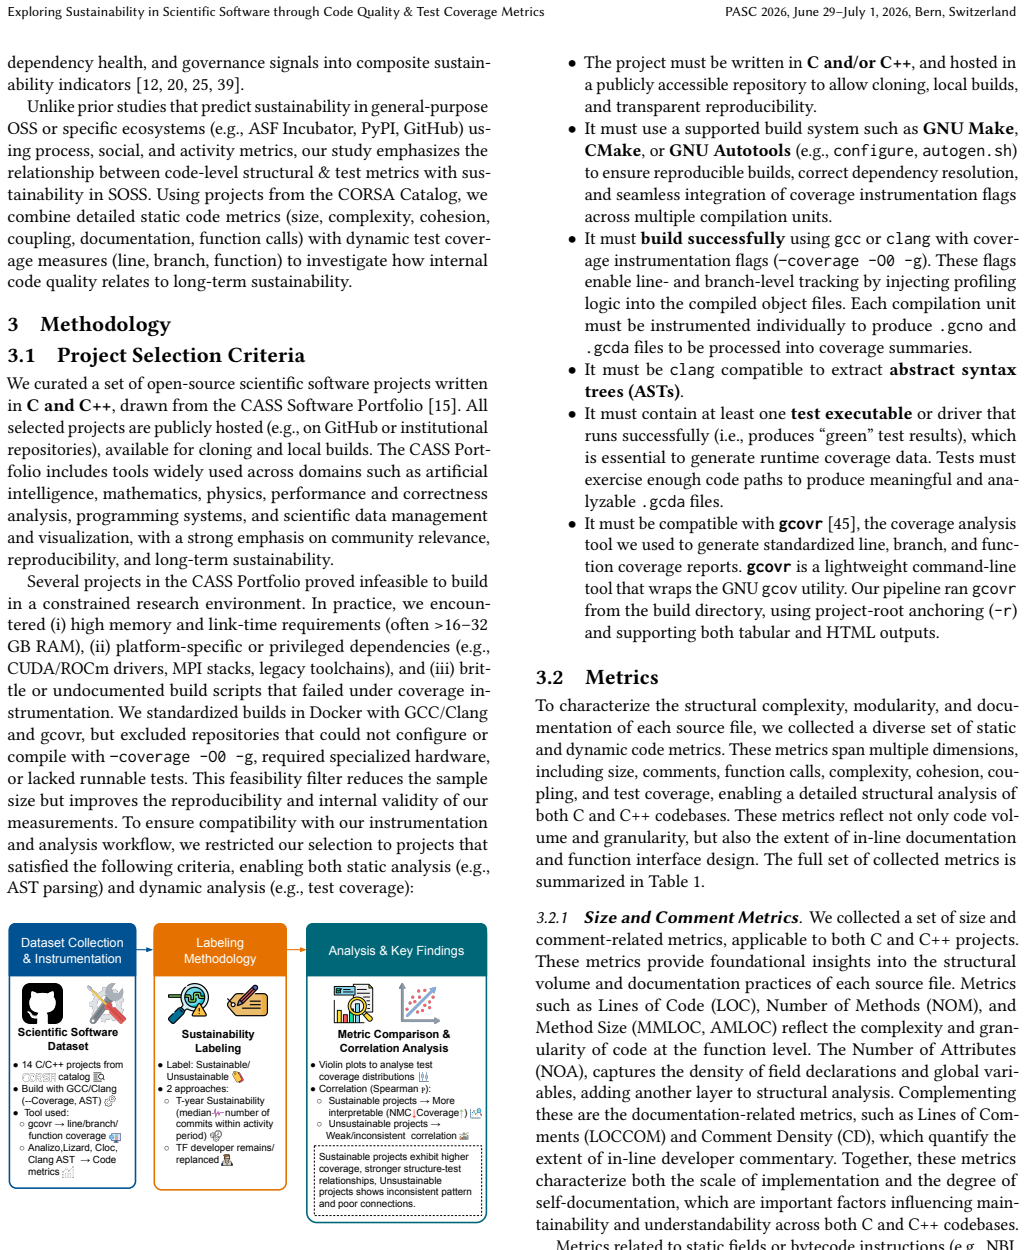
Context: Scientific open-source software (SciOSS) plays a foundational role in research and engineering, yet its long-term sustainability has often been overlooked and remains a significant concern. Objective: This study investigates the long-term sustainability of SciOSS through code and test quality metrics. Method: We analyze CASS Software Portfolio projects, classifying them by sustainability and comparing their code structure, test coverage, and links between code quality and testing across the dataset. Results: Sustainable projects show higher, more consistent test coverage and clearer code-test correlations, while unsustainable ones show weaker patterns. Overall, test coverage is low in scientific software, and high complexity and coupling reduce testability. Conclusion: In this study, we present a practical, data-driven approach for assessing sustainability in scientific software, offering a foundation for evaluating long-term software health and supporting future efforts in quality assurance and sustainability monitoring.
Editorial analysis
A structured set of objections, weighed in public.
Referee Report
Summary. The manuscript reports an empirical study analyzing code quality and test coverage metrics across projects in the CASS Software Portfolio. Projects are classified as sustainable or unsustainable, with comparisons of code structure, test coverage, complexity, coupling, and code-test correlations. The central claims are that sustainable projects exhibit higher and more consistent test coverage along with clearer code-test correlations, while unsustainable projects show weaker patterns; overall, test coverage remains low in scientific software and high complexity/coupling reduce testability. The work positions this as a practical data-driven method for assessing long-term sustainability.
Significance. If the sustainability classification proves independent of the analyzed metrics and the statistical comparisons are robust, the study could contribute a useful empirical framework for monitoring software health in scientific open-source projects, an area of practical importance. The focus on testability factors like complexity and coupling is relevant to software engineering practice. However, the current presentation lacks sufficient methodological transparency to evaluate whether the observed differences reflect genuine predictive relationships rather than artifacts of partitioning or unmeasured confounders.
major comments (2)
- [Method] Method section: The criteria and process for classifying projects as sustainable or unsustainable are not described (including any use of activity, maintenance, or community metrics). This is load-bearing for the central claim, as any overlap with test coverage or code quality variables would render the reported group differences non-informative about sustainability.
- [Results] Results section: No details are provided on sample sizes per group, statistical tests performed, effect sizes, confidence intervals, or controls for confounding variables (e.g., project age or size). Without these, the abstract's comparative claims cannot be verified and the evidence strength remains unclear.
minor comments (2)
- [Abstract] Abstract: The conclusion refers to a 'practical, data-driven approach' for sustainability assessment, but no guidance is given on how the metrics would be applied to classify new projects or set thresholds.
- The manuscript would benefit from explicit discussion of inter-rater reliability for the sustainability classification and any sensitivity analyses removing borderline cases.
Simulated Author's Rebuttal
We thank the referee for their constructive and detailed feedback, which has identified key opportunities to enhance the methodological transparency and statistical rigor of our manuscript. We address each major comment below and will incorporate the necessary revisions.
read point-by-point responses
-
Referee: [Method] Method section: The criteria and process for classifying projects as sustainable or unsustainable are not described (including any use of activity, maintenance, or community metrics). This is load-bearing for the central claim, as any overlap with test coverage or code quality variables would render the reported group differences non-informative about sustainability.
Authors: We agree that explicit details on the sustainability classification are essential. The submitted manuscript references the CASS Software Portfolio classification but does not describe the specific criteria or process. In the revised version, we will expand the Method section to fully detail the classification approach, including the activity, maintenance, and community metrics used (such as commit frequency, issue resolution rates, pull request activity, and contributor engagement levels). We will also explicitly note that these metrics are independent of the code quality and test coverage variables analyzed, ensuring the group comparisons remain informative. revision: yes
-
Referee: [Results] Results section: No details are provided on sample sizes per group, statistical tests performed, effect sizes, confidence intervals, or controls for confounding variables (e.g., project age or size). Without these, the abstract's comparative claims cannot be verified and the evidence strength remains unclear.
Authors: We concur that these statistical details are required for verifiability. The original manuscript reports comparative results without specifying group sample sizes, the statistical tests employed, effect sizes, confidence intervals, or controls for confounders such as project age or size. We will revise the Results section to include a dedicated statistical reporting subsection with the exact sample sizes for sustainable and unsustainable groups, the tests performed (e.g., appropriate non-parametric or parametric tests with justification), effect sizes, confidence intervals, and any checks or controls for confounding variables. This will strengthen the presentation of evidence. revision: yes
Circularity Check
No circularity: empirical comparison of externally classified groups
full rationale
The paper performs a comparative empirical analysis: projects from the CASS portfolio are partitioned into sustainable/unsustainable groups by stated criteria, after which code-quality and test-coverage metrics are measured and contrasted. No equations, fitted parameters, or derivations are present that reduce to the input metrics by construction. The classification step is described as preceding the metric comparisons, with no evidence that sustainability labels were derived from the same code/test variables later analyzed. Self-citations, if any, are not load-bearing for the central claims. This matches the default expectation for non-circular empirical work.
Axiom & Free-Parameter Ledger
axioms (1)
- domain assumption Projects can be reliably classified into sustainable and unsustainable categories using criteria independent of the code and test metrics under study.
Reference graph
Works this paper leans on
-
[1]
[n. d.]. CVE - CVE-2021-44228 — cve.mitre.org. https://cve.mitre.org/cgi-bin/ cvename.cgi?name=CVE-2021-44228. [Accessed 04-08-2025]
work page 2021
-
[2]
Consortium for the Advancement of Scientific Software
2025. Consortium for the Advancement of Scientific Software. https://cass. community/. Accessed: 2025-12-12
work page 2025
-
[3]
Hartwig Anzt, Felix Bach, Stephan Druskat, Frank Löffler, Axel Loewe, Bernhard Y Renard, Gunnar Seemann, Alexander Struck, Elke Achhammer, Piush Aggarwal, et al. 2021. An environment for sustainable research software in Germany and beyond: current state, open challenges, and call for action.F1000Research9 (2021)
work page 2021
-
[4]
Oliver Arafat and Dirk Riehle. 2009. The comment density of open source software code. In2009 31st International Conference on Software Engineering-Companion Volume. IEEE, 195–198
work page 2009
-
[5]
Guilherme Avelino, Eleni Constantinou, Marco Tulio Valente, and Alexander Serebrenik. 2019. On the abandonment and survival of open source projects: An empirical investigation. In2019 ACM/IEEE International Symposium on Empirical Software Engineering and Measurement (ESEM). IEEE, 1–12
work page 2019
-
[6]
Guilherme Avelino, Leonardo Passos, Andre Hora, and Marco Tulio Valente. 2016. A novel approach for estimating truck factors. In2016 IEEE 24th International Conference on Program Comprehension (ICPC). IEEE, 1–10
work page 2016
-
[7]
Yoav Benjamini and Yosef Hochberg. 1995. Controlling the false discovery rate: a practical and powerful approach to multiple testing.Journal of the Royal statistical society: series B (Methodological)57, 1 (1995), 289–300. PASC 2026, June 29–July 1, 2026, Bern, Switzerland Rahman et al
work page 1995
-
[8]
Magiel Bruntink and Arie van Deursen. 2006. An empirical study into class testability.Journal of systems and software79, 9 (2006), 1219–1232
work page 2006
-
[9]
Jeffrey C Carver, Nic Weber, Karthik Ram, Sandra Gesing, and Daniel S Katz
-
[10]
A survey of the state of the practice for research software in the United States.Peerj computer science8 (2022), e963
work page 2022
-
[11]
InduShobha Chengalur-Smith, Anna Sidorova, and Sherae L Daniel. 2010. Sus- tainability of free/libre open source projects: A longitudinal study.Journal of the Association for Information Systems11, 11 (2010), 5
work page 2010
-
[12]
Shyam R Chidamber and Chris F Kemerer. 1994. A metrics suite for object oriented design.IEEE Transactions on software engineering20, 6 (1994), 476–493
work page 1994
-
[13]
Jailton Coelho and Marco Tulio Valente. 2017. Why modern open source projects fail. InProceedings of the 2017 11th Joint meeting on foundations of software engineering. 186–196
work page 2017
-
[14]
Jailton Coelho, Marco Tulio Valente, Luciana L Silva, and Emad Shihab. 2018. Identifying unmaintained projects in github. InProceedings of the 12th ACM/IEEE International Symposium on Empirical Software Engineering and Measurement
work page 2018
-
[15]
2013.Statistical power analysis for the behavioral sciences
Jacob Cohen. 2013.Statistical power analysis for the behavioral sciences. routledge
work page 2013
-
[16]
Constorium for the Advancement of Scientific Software (CASS). 2024. CASS Software Portfolio. https://cass.community/software/. Accessed: July 2025
work page 2024
-
[17]
Gregory W Corder and Dale I Foreman. 2009. Nonparametric statistics for non-statisticians.(No Title)(2009)
work page 2009
-
[18]
Ralph B D’agostino, Albert Belanger, and Ralph B D’Agostino Jr. 1990. A sug- gestion for using powerful and informative tests of normality.The American Statistician44, 4 (1990), 316–321
work page 1990
-
[19]
Albert Danial. 2021.cloc: v1.92. doi:10.5281/zenodo.5760077
-
[20]
David P Darcy, Chris F Kemerer, Sandra A Slaughter, and James E Tomayko. 2005. The structural complexity of software an experimental test.IEEE Transactions on software engineering31, 11 (2005), 982–995
work page 2005
-
[21]
Edson Dias, Paulo Meirelles, Fernando Castor, Igor Steinmacher, Igor Wiese, and Gustavo Pinto. 2021. What makes a great maintainer of open source projects?. In2021 IEEE/ACM 43rd International Conference on Software Engineering (ICSE). IEEE, 982–994
work page 2021
-
[22]
Stephan Druskat, Daniel S Katz, and Ilian T Todorov. 2021. Research Software Sustainability and Citation. In2021 IEEE/ACM International Workshop on Body of Knowledge for Software Sustainability (BoKSS). IEEE, 1–2
work page 2021
-
[23]
Nasir U Eisty, Danny Perez, Jeffrey C Carver, J David Moulton, and Hai Ah Nam
-
[24]
InInternational Conference on Computational Science
Testing research software: A case study. InInternational Conference on Computational Science. Springer, 457–463
-
[25]
Erich Gamma, Richard Helm, Ralph Johnson, and John Vlissides. 1994. Design Patterns: Micro-Architectures for Reusable Object-Oriented Design.Reading: Addison-Wesley(1994)
work page 1994
-
[26]
Amir Hossein Ghapanchi. 2015. Predicting software future sustainability: A longitudinal perspective.Information Systems49 (2015), 40–51
work page 2015
-
[27]
Sean Goggins, Kevin Lumbard, and Matt Germonprez. 2021. Open source com- munity health: Analytical metrics and their corresponding narratives. In2021 IEEE/ACM 4th International Workshop on Software Health in Projects, Ecosystems and Communities (SoHeal). IEEE, 25–33
work page 2021
-
[28]
2005.Effect sizes for research: A broad practical approach.Lawrence Erlbaum Associates Publishers
Robert J Grissom and John J Kim. 2005.Effect sizes for research: A broad practical approach.Lawrence Erlbaum Associates Publishers
work page 2005
-
[29]
Junxiao Han, Yunkun Wang, Zhongxin Liu, Lingfeng Bao, Jiakun Liu, David Lo, and Shuiguang Deng. 2024. Sustainability forecasting for deep learning packages. In2024 IEEE International Conference on Software Analysis, Evolution and Reengineering (SANER). IEEE, 981–992
work page 2024
-
[30]
Jan Hauke and Tomasz Kossowski. 2011. Comparison of values of Pearson’s and Spearman’s correlation coefficients on the same sets of data.Quaestiones geographicae30, 2 (2011), 87–93
work page 2011
-
[31]
1995.Measuring coupling and cohesion in object-oriented systems
Martin Hitz and Behzad Montazeri. 1995.Measuring coupling and cohesion in object-oriented systems. na
work page 1995
-
[32]
Upulee Kanewala and James M Bieman. 2014. Testing scientific software: A systematic literature review.Information and software technology56, 10 (2014), 1219–1232
work page 2014
-
[33]
DS Katz. 2022. Research Software: Challenges & Actions. The Future of Research Software: International Funders Workshop, Amsterdam, the Netherlands
work page 2022
-
[34]
Meir M Lehman. 2005. Programs, life cycles, and laws of software evolution.Proc. IEEE68, 9 (2005), 1060–1076
work page 2005
-
[35]
Robert Martin. 1994. OO design quality metrics.An analysis of dependencies12, 1 (1994), 151–170
work page 1994
-
[36]
Stewart Martin-Haugh, Stefan Kluth, Rolf Seuster, Scott Snyder, Emil Obreshkov, Shaun Roe, Peter Sherwood, and Graeme A Stewart. 2017. C++ software quality in the ATLAS experiment: tools and experience. InJournal of Physics: Conference Series, Vol. 898. IOP Publishing, 072011
work page 2017
-
[37]
Thomas J McCabe. 1976. A complexity measure.IEEE Transactions on software Engineering4 (1976), 308–320
work page 1976
-
[38]
Paulo Roberto Miranda Meirelles. 2013. Monitoramento de métricas de código- fonte em projetos de software livre. (2013)
work page 2013
-
[39]
Vishal Midha and Prashant Palvia. 2012. Factors affecting the success of Open Source Software.Journal of Systems and Software85, 4 (2012), 895–905
work page 2012
-
[40]
Emmanuel Nyenah, Petra Döll, Daniel S Katz, and Robert Reinecke. 2024. Soft- ware sustainability of global impact models.Geoscientific Model Development Discussions2024 (2024), 1–29
work page 2024
-
[41]
Marc Oriol, Carlos Mueller, Jordi Marco, Pablo Fernandez, Xavier Franch, and Antonio Ruiz-Cortes. 2023. Comprehensive assessment of open source software ecosystem health.Internet of Things22 (2023), 100808
work page 2023
-
[42]
COVO Pearson’s. 2011. Comparison of values of Pearson’s and Spearman’s correlation coefficients.Comparison Of Values Of Pearson’s And Spearman’s Correlation Coefficients(2011)
work page 2011
-
[43]
Huilian Sophie Qiu, Alexander Nolte, Anita Brown, Alexander Serebrenik, and Bogdan Vasilescu. 2019. Going farther together: The impact of social capital on sustained participation in open source. In2019 ieee/acm 41st international conference on software engineering (icse). IEEE, 688–699
work page 2019
-
[44]
Robert Reinecke, Tim Trautmann, Thorsten Wagener, and Katja Schüler. 2022. The critical need to foster computational reproducibility.Environmental Research Letters17, 4 (2022), 041005
work page 2022
-
[45]
Robert Reinecke, Tim Trautmann, Thorsten Wagener, and Katja Schüler. 2022. The critical need to foster computational reproducibility.Environ. Res. Lett.17, 4 (April 2022), 041005
work page 2022
-
[46]
Jeanine Romano, Jeffrey D Kromrey, Jesse Coraggio, and Jeff Skowronek. 2006. Appropriate statistics for ordinal level data: Should we really be using t-test and Cohen’sd for evaluating group differences on the NSSE and other surveys. In annual meeting of the Florida Association of Institutional Research, Vol. 177
work page 2006
-
[47]
Felix Schwarz and contributors. 2024. gcovr: Code coverage reporting for C/C++ projects. https://gcovr.com. Version 6.0, Accessed: July 2025
work page 2024
-
[48]
Judith Segal. 2007. Some problems of professional end user developers. InIEEE Symposium on Visual Languages and Human-Centric Computing (VL/HCC 2007). IEEE, 111–118
work page 2007
-
[49]
S, tefan Stănciulescu, Likang Yin, and Vladimir Filkov. 2022. Code, quality, and process metrics in graduated and retired asfi projects. InProceedings of the 30th ACM Joint European Software Engineering Conference and Symposium on the Foundations of Software Engineering. 495–506
work page 2022
-
[50]
Xin Tan, Minghui Zhou, and Zeyu Sun. 2020. A first look at good first issues on GitHub. InProceedings of the 28th ACM Joint Meeting on European Software Engineering Conference and Symposium on the Foundations of Software Engineering. 398–409
work page 2020
-
[51]
Mei-Huei Tang, Ming-Hung Kao, and Mei-Hwa Chen. 1999. An empirical study on object-oriented metrics. InProceedings sixth international software metrics symposium (Cat. No. PR00403). IEEE, 242–249
work page 1999
-
[52]
Antonio Terceiro, Joenio Costa, João Miranda, Paulo Meirelles, Luiz Romário Rios, Lucianna Almeida, Christina Chavez, and Fabio Kon. 2010. Analizo: an extensi- ble multi-language source code analysis and visualization toolkit. InBrazilian conference on software: theory and practice (Tools Session)
work page 2010
-
[53]
Antonio Terceiro, Manoel Mendonça, Christina Chavez, and Daniela S Cruzes
-
[54]
In 2012 16th European Conference on Software Maintenance and Reengineering
Understanding structural complexity evolution: A quantitative analysis. In 2012 16th European Conference on Software Maintenance and Reengineering. IEEE, 85–94
work page 2012
-
[55]
Valerio Terragni, Pasquale Salza, and Mauro Pezzè. 2020. Measuring software testability modulo test quality. InProceedings of the 28th international conference on program comprehension. 241–251
work page 2020
-
[56]
Fadel Toure, Mourad Badri, and Luc Lamontagne. 2018. Predicting different levels of the unit testing effort of classes using source code metrics: a multiple case study on open-source software.Innovations in Systems and Software Engineering 14, 1 (2018), 15–46
work page 2018
-
[57]
Marat Valiev, Bogdan Vasilescu, and James Herbsleb. 2018. Ecosystem-level determinants of sustained activity in open-source projects: A case study of the PyPI ecosystem. InProceedings of the 2018 26th ACM Joint Meeting on European Software Engineering Conference and Symposium on the Foundations of Software Engineering. 644–655
work page 2018
-
[58]
2003.Pair programming illuminated
Laurie Williams and Robert R Kessler. 2003.Pair programming illuminated. Addison-Wesley Professional
work page 2003
-
[59]
Titus Winters, Tom Manshreck, and Hyrum Wright. 2020.Software engineering at google: Lessons learned from programming over time. " O’Reilly Media, Inc. "
work page 2020
-
[60]
Wenxin Xiao, Hao He, Weiwei Xu, Yuxia Zhang, and Minghui Zhou. 2023. How early participation determines long-term sustained activity in github projects?. InProceedings of the 31st ACM Joint European Software Engineering Conference and Symposium on the Foundations of Software Engineering. 29–41
work page 2023
-
[61]
Likang Yin, Zhuangzhi Chen, Qi Xuan, and Vladimir Filkov. 2021. Sustainabil- ity forecasting for apache incubator projects. InProceedings of the 29th ACM joint meeting on european software engineering conference and symposium on the foundations of software engineering. 1056–1067
work page 2021
-
[62]
Yuxia Zhang, Minghui Zhou, Audris Mockus, and Zhi Jin. 2019. Companies’ par- ticipation in oss development–an empirical study of openstack.IEEE Transactions on Software Engineering47, 10 (2019), 2242–2259
work page 2019
discussion (0)
Sign in with ORCID, Apple, or X to comment. Anyone can read and Pith papers without signing in.