Integrating Hydrogen into Ontario's Energy Hub: A Robust, Carbon-Aware Framework for Power-Heat-Transport
Pith reviewed 2026-06-29 20:06 UTC · model grok-4.3
The pith
A robust MILP framework for Ontario's multi-energy hub projects electrolyzer capacity rising from 300 MW to 3,800 MW and storage to 37,000 MWh by 2050 under carbon policies.
A machine-rendered reading of the paper's core claim, the machinery that carries it, and where it could break.
Core claim
The developed scheme applied to Ontario indicates substantial long-term hydrogen expansion, with the electrolyzer capacity increasing from 300 MW (2025) to 3,800 MW (2050) and hydrogen storage from 2,000 MWh to 37,000 MWh (2050), accompanied by sharply higher hydrogen production. Robust solutions preserve feasibility but incur a 6.6-9.0% robustness premium in total cost.
What carries the argument
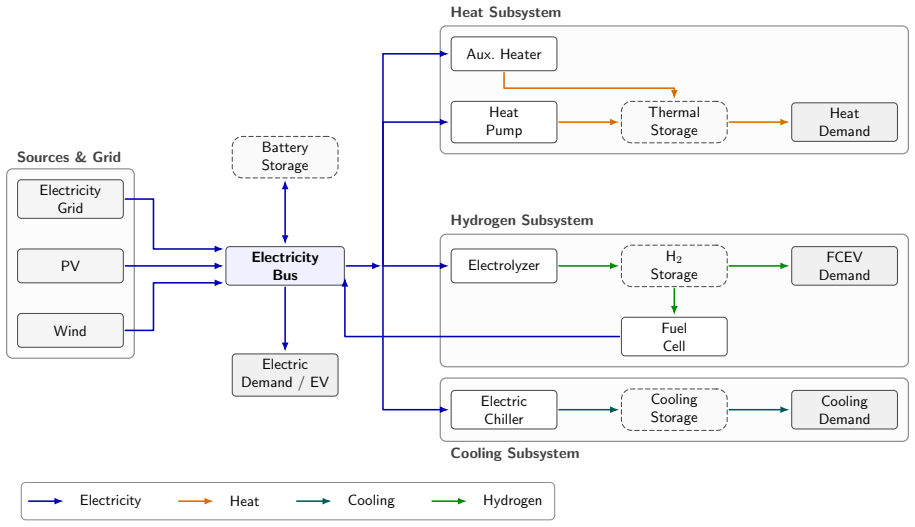
A 25-year MILP for a grid-connected energy hub extended by budgeted robust optimization; the hydrogen sub-hub (electrolyzer plus storage) supplies transport demand and provides operational flexibility across electricity, heat, cooling, and transport services.
Load-bearing premise
The 25-year projections rest on assumed trajectories for energy service demands, technology capital and operating costs, renewable resource availability, and conversion efficiencies across the 2025-2050 horizon.
What would settle it
Actual Ontario electrolyzer installations by 2035 that fall well below the model's projected path under comparable carbon-tax or net-zero policies would falsify the expansion trajectory.
Figures
read the original abstract
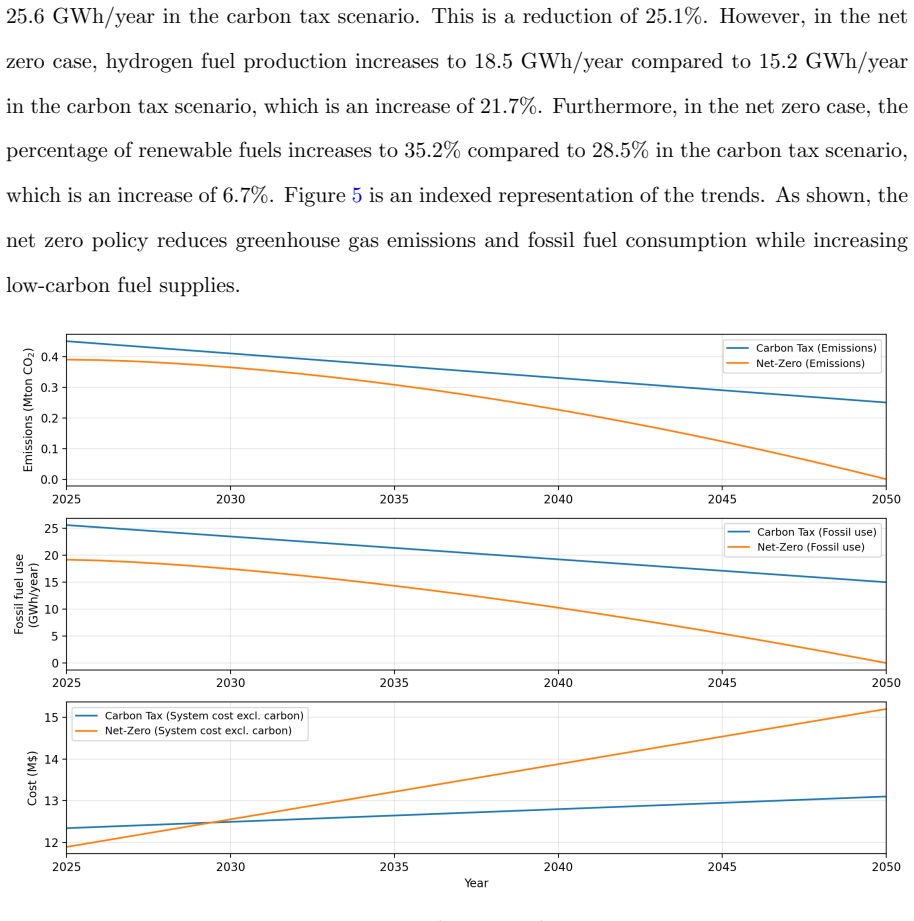
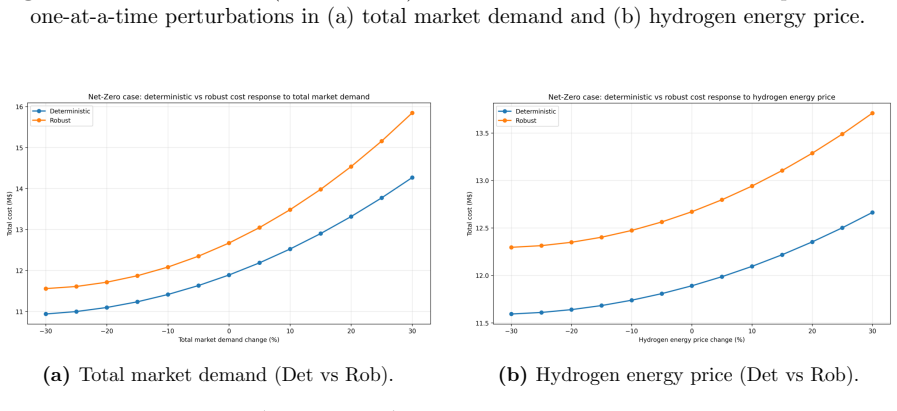
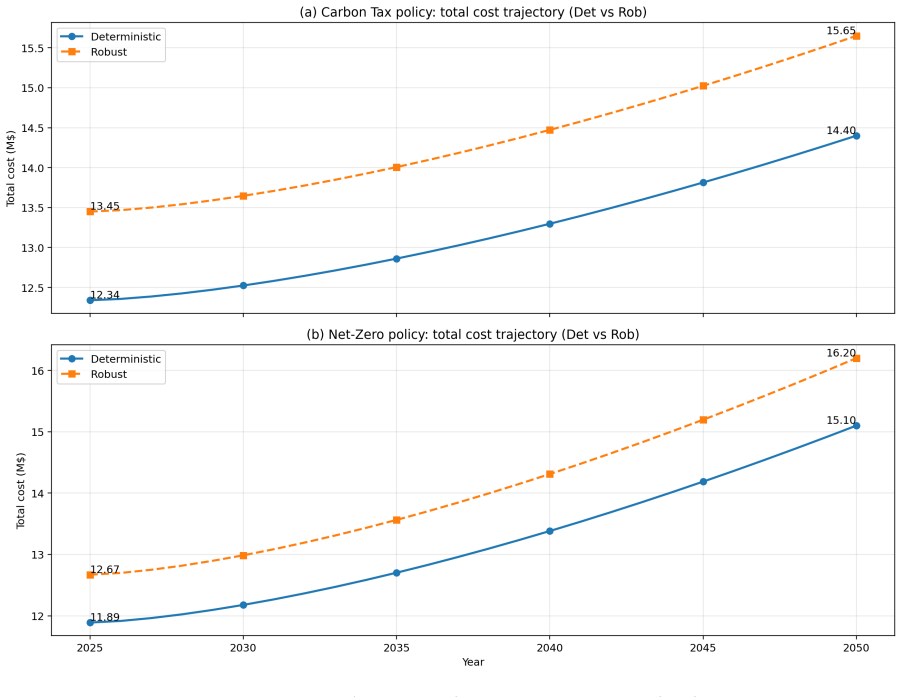
Decarbonizing electricity generation, heating, and transportation simultaneously requires integrated planning tools that can coordinate multiple energy production sources and demand points while remaining reliable under uncertainty. This paper develops a carbon-aware and uncertainty-resilient optimization framework for a grid-connected multiple source hub that co-optimizes electricity, heating, cooling, and transport energy services with an explicit hydrogen sub-hub. The proposed model is formulated as an MILP over a 25-year planning horizon (2025-2050). The hub integrates renewable electricity (Photovoltaic and wind), dispatchable resources (including natural-gas-based conversion), storage systems, demand response, and a hydrogen subsystem comprising an electrolyzer and hydrogen storage to supply hydrogen-vehicle demand and provide temporal flexibility. Two policy archetypes are examined: a Carbon Tax (price instrument), and a Net-Zero pathway (quantity instrument). To hedge feasibility-critical operational uncertainty, the deterministic model is extended using budgeted robust optimization and a tunable uncertainty budget. The developed scheme is applied to the province of Ontario, Canada; the results indicate substantial long-term hydrogen expansion, with the electrolyzer capacity increasing from 300~MW (2025) to 3,800~MW (2050) and hydrogen storage from 2,000~MWh to 37,000~MWh (2050), accompanied by sharply higher hydrogen production. Compared with deterministic solutions, robust solutions preserve feasibility under adverse realizations but incur a moderate robustness premium of approximately 6.6-9.0\% in total cost across the policy cases studied, while slightly reducing hydrogen utilization and renewable share and increasing reliance on dispatchable balancing.
Editorial analysis
A structured set of objections, weighed in public.
Referee Report
Summary. The paper develops a carbon-aware MILP for co-optimizing power, heat, cooling, and transport services in a grid-connected Ontario energy hub that includes a hydrogen sub-hub (electrolyzer and storage) over a 2025-2050 horizon. It examines two policy cases (carbon tax and net-zero), extends the model with budgeted robust optimization to hedge operational uncertainty, and reports specific results for Ontario: electrolyzer capacity rising from 300 MW to 3,800 MW, hydrogen storage from 2,000 MWh to 37,000 MWh, sharply higher hydrogen production, and a 6.6-9.0% robustness premium in total cost relative to deterministic solutions.
Significance. If the exogenous input trajectories and model validation hold, the work supplies a concrete, multi-sector planning tool that couples hydrogen with robustness under carbon policies; the budgeted-robust extension and Ontario-scale numeric outputs are the primary contributions.
major comments (2)
- [Abstract] Abstract and results: the headline capacity expansions (electrolyzer 300 MW → 3,800 MW; storage 2,000 MWh → 37,000 MWh) and 6.6-9.0% robustness premium are direct outputs of the budgeted robust MILP; these quantities are fully determined by the assumed 25-year time series for energy-service demands, technology costs/efficiencies, renewable availability, and carbon parameters, yet the manuscript provides neither sourcing nor sensitivity analysis on these exogenous inputs.
- [Model Formulation] Model and data sections: the abstract states that an MILP is solved under two policies plus robust extension and then reports concrete capacity and cost numbers, but without the explicit formulation, data sources, or validation against historical Ontario loads, it is impossible to confirm that the model supports the reported numeric outcomes.
Simulated Author's Rebuttal
We thank the referee for the constructive feedback on our manuscript. The comments highlight important aspects of transparency that we will address in revision. We respond to each major comment below.
read point-by-point responses
-
Referee: [Abstract] Abstract and results: the headline capacity expansions (electrolyzer 300 MW → 3,800 MW; storage 2,000 MWh → 37,000 MWh) and 6.6-9.0% robustness premium are direct outputs of the budgeted robust MILP; these quantities are fully determined by the assumed 25-year time series for energy-service demands, technology costs/efficiencies, renewable availability, and carbon parameters, yet the manuscript provides neither sourcing nor sensitivity analysis on these exogenous inputs.
Authors: We agree that explicit sourcing and sensitivity analysis on the exogenous inputs would improve reproducibility. The Case Study section describes the input trajectories at a high level, but we will add a dedicated data appendix with full references (e.g., IESO long-term energy plans for Ontario demands, IEA and NREL cost projections, and Environment and Climate Change Canada carbon parameters). We will also include sensitivity results on demand growth rates, renewable capacity factors, and carbon price levels to show how the reported electrolyzer and storage capacities respond. These changes will be incorporated in the revised manuscript. revision: yes
-
Referee: [Model Formulation] Model and data sections: the abstract states that an MILP is solved under two policies plus robust extension and then reports concrete capacity and cost numbers, but without the explicit formulation, data sources, or validation against historical Ontario loads, it is impossible to confirm that the model supports the reported numeric outcomes.
Authors: The Model Formulation section presents the deterministic MILP and its budgeted-robust extension, including the objective, power/heat/transport balance constraints, and hydrogen sub-hub equations. However, to address the concern directly, we will expand this section with the complete mathematical formulation (all variables, constraints, and the robust counterpart) placed in the main text or a supplementary appendix. We will also add a model validation subsection that compares 2025-period outputs against historical Ontario electricity and natural-gas load data from public IESO and Statistics Canada sources. Data tables with units and sources will be added to the Case Study section. These revisions will be made without changing the core numeric results. revision: yes
Circularity Check
No circularity: MILP outputs are direct solutions to exogenous input trajectories
full rationale
The paper presents a standard MILP capacity-expansion model over a 25-year horizon, extended with budgeted robust optimization to handle uncertainty. Reported results (electrolyzer capacity from 300 MW to 3,800 MW, storage from 2,000 MWh to 37,000 MWh, 6.6-9.0% robustness premium) are explicit solutions of the optimization given assumed exogenous time series for demands, costs, renewable availability, and efficiencies. No equation reduces any output to a quantity defined by the same output, no fitted parameter is relabeled as a prediction, and no load-bearing premise rests on self-citation or imported uniqueness. The derivation chain is therefore self-contained and non-circular.
Axiom & Free-Parameter Ledger
free parameters (4)
- technology cost and efficiency trajectories
- energy service demand forecasts
- carbon policy parameters
- uncertainty budget parameter
axioms (2)
- domain assumption The multi-carrier energy system can be represented as a single hub with linear conversion and storage balances
- domain assumption Operational uncertainty can be captured by a budgeted polyhedral uncertainty set
Reference graph
Works this paper leans on
-
[1]
Will hydrogen prolong the price coupling between gas and electricity? Energy Economics , 109221doi:10. 1016/j.eneco.2026.109221. Dilek, G., Teixido, J.J., Serrano, M.,
-
[2]
Energy Economics , 109174doi:10.1016/j.eneco.2026
Carbon pricing effects on renewables: Evidence from california’s electricity market. Energy Economics , 109174doi:10.1016/j.eneco.2026. 109174. Gabrielli, P., Poluzzi, A., Kramer, G.J., Spiers, C., Mazzotti, M., Gazzani, M., 2020a. Seasonal 35 energy storage for zero-emissions multi-energy systems via underground hydrogen storage. Renewable and Sustainabl...
-
[3]
URL:https://www.canada.ca/en/department-finance/ news/2025/03/removing-the-consumer-carbon-price-effective-april-1-2025.html
Department of Finance Canada. URL:https://www.canada.ca/en/department-finance/ news/2025/03/removing-the-consumer-carbon-price-effective-april-1-2025.html. accessed: May
2025
-
[4]
Energy & Environmental Science 13, 1909–1922
The value of seasonal energy storage technologies for the integration of wind and solar power. Energy & Environmental Science 13, 1909–1922. doi:10.1039/D0EE00771D. Hou, S., Fan, Y., Yi, B.W.,
-
[5]
Ioannou, A., Fuzuli, G., Brennan, F., Yudha, S.W., Angus, A.,
doi:10.3390/mining5010009. Ioannou, A., Fuzuli, G., Brennan, F., Yudha, S.W., Angus, A.,
-
[6]
Energy Economics , 109226doi:10.1016/j.eneco.2026.109226
How to sustainably spur r&d of energy storage? policy options and combinations. Energy Economics , 109226doi:10.1016/j.eneco.2026.109226. Khakimov, R., Moskvin, A., Zhdaneev, O.,
-
[7]
arXiv preprint arXiv:2602.02333
A two-stage stochastic optimization model for the equitable deployment of fixed and mobile electric vehicle charging stations. arXiv preprint arXiv:2602.02333 . Nunes, J.B., Mahmoudi, N., Saha, T.K., Chattopadhyay, D.,
-
[8]
Energy Economics , 108981doi:10.1016/j.eneco.2025.108981
Hedging hydrogen: Plan- ning and contracting under uncertainty for a green hydrogen producer. Energy Economics , 108981doi:10.1016/j.eneco.2025.108981. Papadimitriou, C., Di Somma, M., Charalambous, C., Caliano, M., Palladino, V., Cortes Borray, A., Gonz´ alez-Garrido, A., Ruiz, N., Graditi, G., 2023a. A comprehensive review of the design 37 and operation...
-
[9]
Petkov, I., Gabrielli, P., 2020a. Power-to-hydrogen as seasonal energy storage: An uncertainty analysis for optimal design of low-carbon multi-energy systems. Applied Energy 274, 115197. doi:10.1016/j.apenergy.2020.115197. Petkov, I., Gabrielli, P., 2020b. Power-to-hydrogen as seasonal energy storage: An uncertainty analysis for optimal design of low-carb...
-
[10]
Modeling a realistic integrated energy hub with growing demand for electric vehicles: The case of the province of Ontario, Canada. Energy 317, 134678. doi:10.1016/j.energy.2025.134678. 38 Staffell, I., Scamman, D., Abad, A.V., Balcombe, P., Dodds, P.E., Ekins, P., Shah, N., Ward, K.R.,
-
[11]
Coordinated planning with predetermined renew- able energy generation targets using extended two-stage robust optimization. IEEE Access 8, 2395–2408. Tsao, Y.C., Vu, T.L., 2023a. Distributed energy storage system planning in relation to renewable energy investment. Renewable Energy 218, 119271. Tsao, Y.C., Vu, T.L., 2023b. Distributed energy storage syste...
-
[12]
Unlocking emerging impacts of carbon tax on integrated energy systems through supply and demand co-optimization. Applied Energy 302, 117579. doi:10.1016/j.apenergy.2021.117579. Wu, Q., Chen, M., Ren, H., Li, Q., Gao, W.,
-
[13]
Collaborative modeling and optimization of energy hubs and multi-energy network considering hydrogen energy. Renewable Energy 227, 120489. doi:10.1016/j.renene.2024.120489. Yu, H., Niu, S., Shang, Y., Shao, Z., Jia, Y., Jian, L.,
discussion (0)
Sign in with ORCID, Apple, or X to comment. Anyone can read and Pith papers without signing in.