Mind the Companion : Demographics of Transiting S-type Exoplanets
Pith reviewed 2026-06-28 19:55 UTC · model grok-4.3
The pith
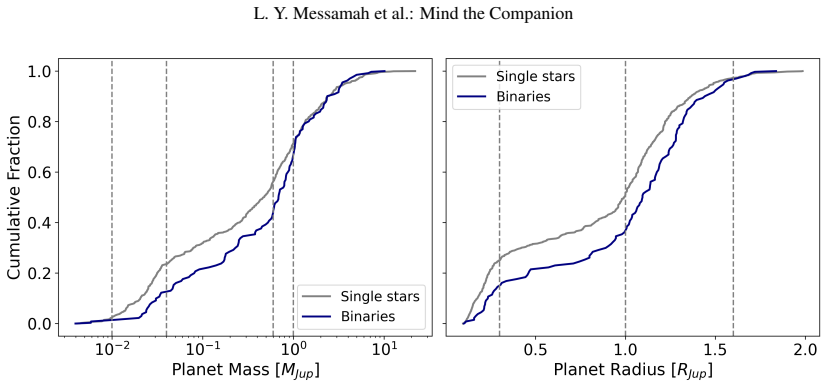
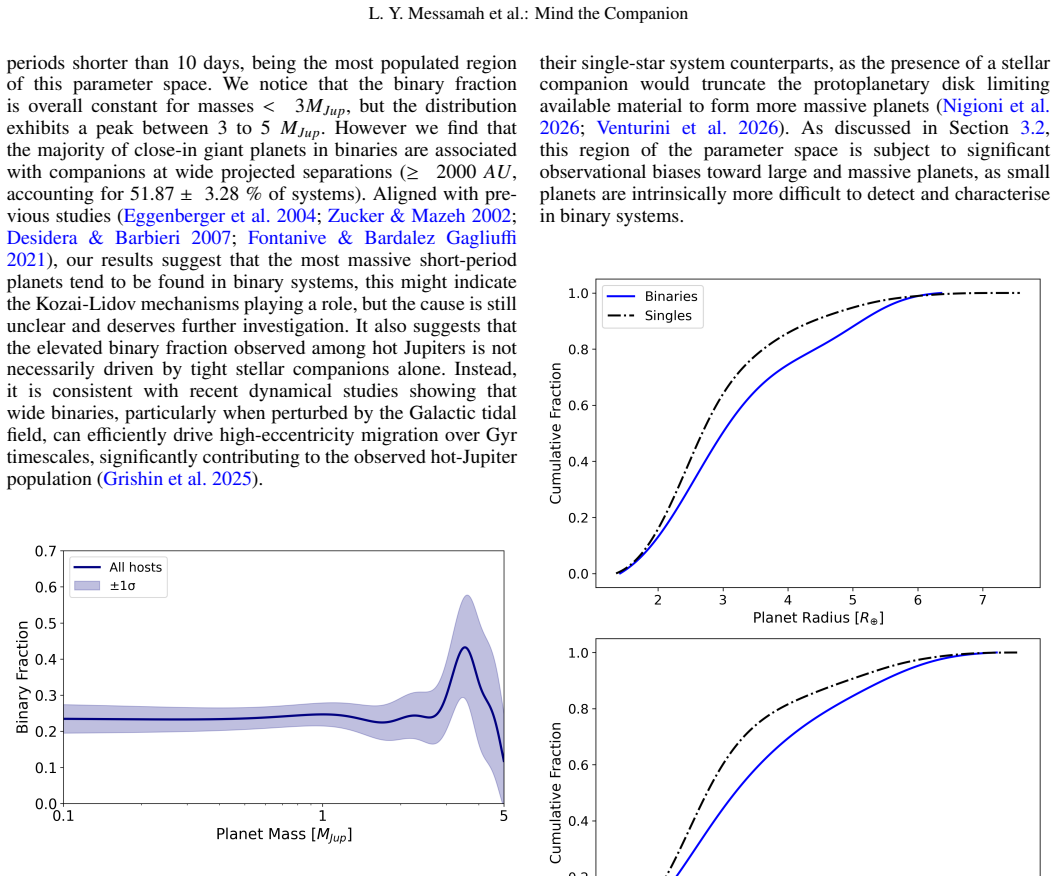
Giant planets in binary systems tend to be more massive and orbit closer to their hosts than those around single stars.
A machine-rendered reading of the paper's core claim, the machinery that carries it, and where it could break.
Core claim
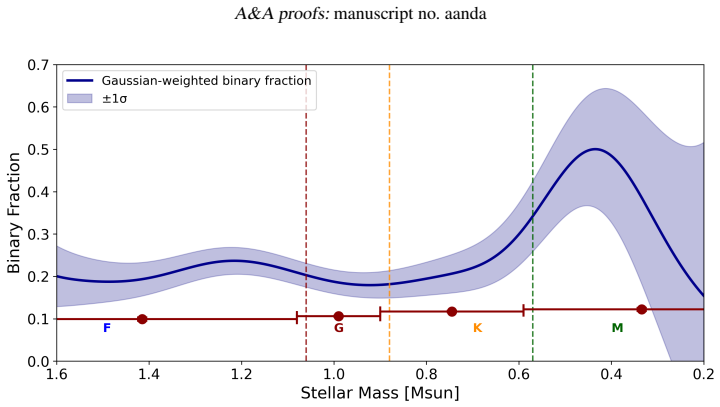
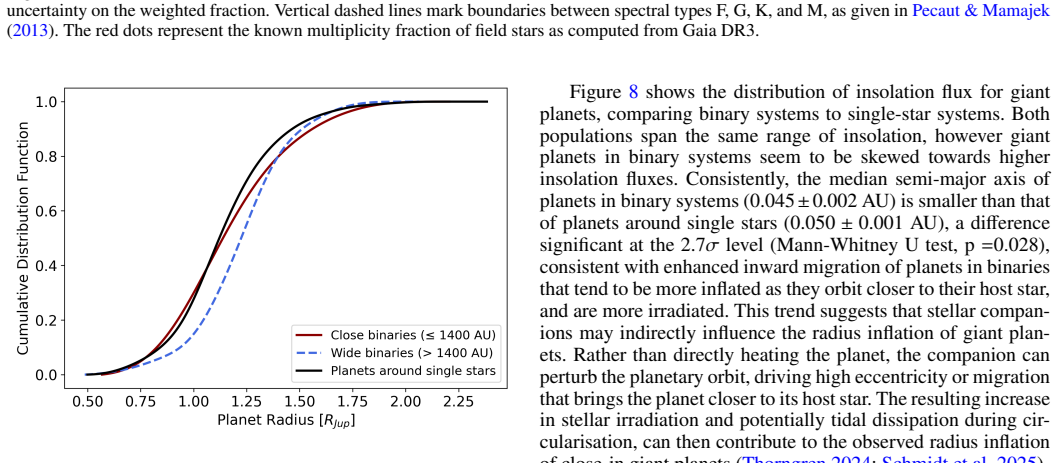
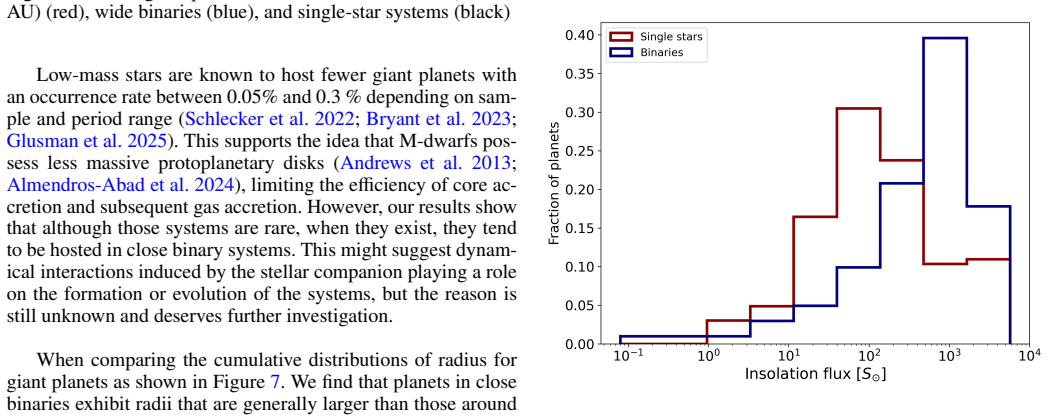
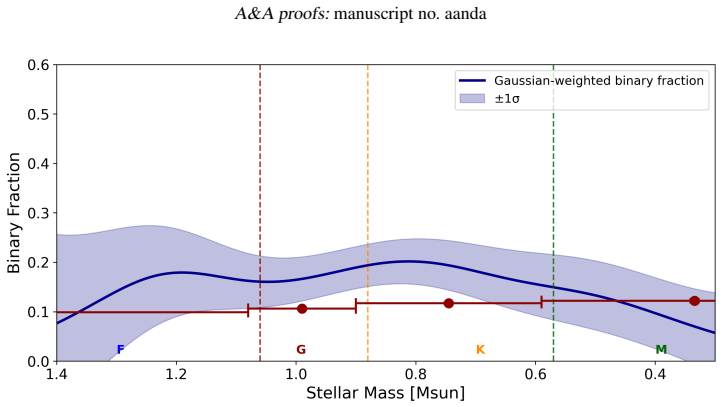
Adopting a conservative classification of gravitationally bound companions from Gaia DR3 on the PlanetS catalog, the authors identify 133 S-type transiting exoplanets among 860 total systems and construct a matched single-star control sample. They measure a binary fraction of 19.4 percent and report that giant planets in binaries are systematically more massive, orbit at smaller separations, and exhibit inflated radii relative to their single-star counterparts, with a possible overabundance around M-dwarfs in binaries separated by less than 1000 AU.
What carries the argument
A curated catalog of 860 transiting exoplanets with conservative Gaia DR3 companion classification and a matched single-star control sample used to compare planetary properties by host multiplicity.
If this is right
- Giant planets in binaries are more massive than single-star counterparts.
- These planets orbit at smaller separations, producing more inflated radii.
- A tentative excess of giant planets appears around M-dwarfs in binaries with separations below 1000 AU.
- The binary fraction among planet hosts is 19.4 percent relative to the control sample.
- Demographic conclusions about planet formation require explicit accounting for stellar multiplicity.
Where Pith is reading between the lines
- Binary companions may alter the available disk mass or migration pathways that allow giant planets to reach higher masses at smaller orbits.
- Targeted observations of M-dwarfs in binaries under 1000 AU could confirm whether the reported excess is real.
- The same conservative vetting approach could be applied to radial-velocity planet samples to test whether the trends extend beyond transiting detections.
- Models of giant-planet formation should incorporate binary separation as a variable when predicting final masses and orbital distances.
Load-bearing premise
The conservative Gaia DR3 companion cuts plus the matched single-star control sample together remove all relevant selection and observational biases between the two populations.
What would settle it
Repeating the mass and separation comparison on an expanded sample after relaxing the conservative companion cuts or after independent confirmation of companionship via radial-velocity monitoring or high-resolution imaging shows no difference between binary and single-star hosts.
Figures
read the original abstract
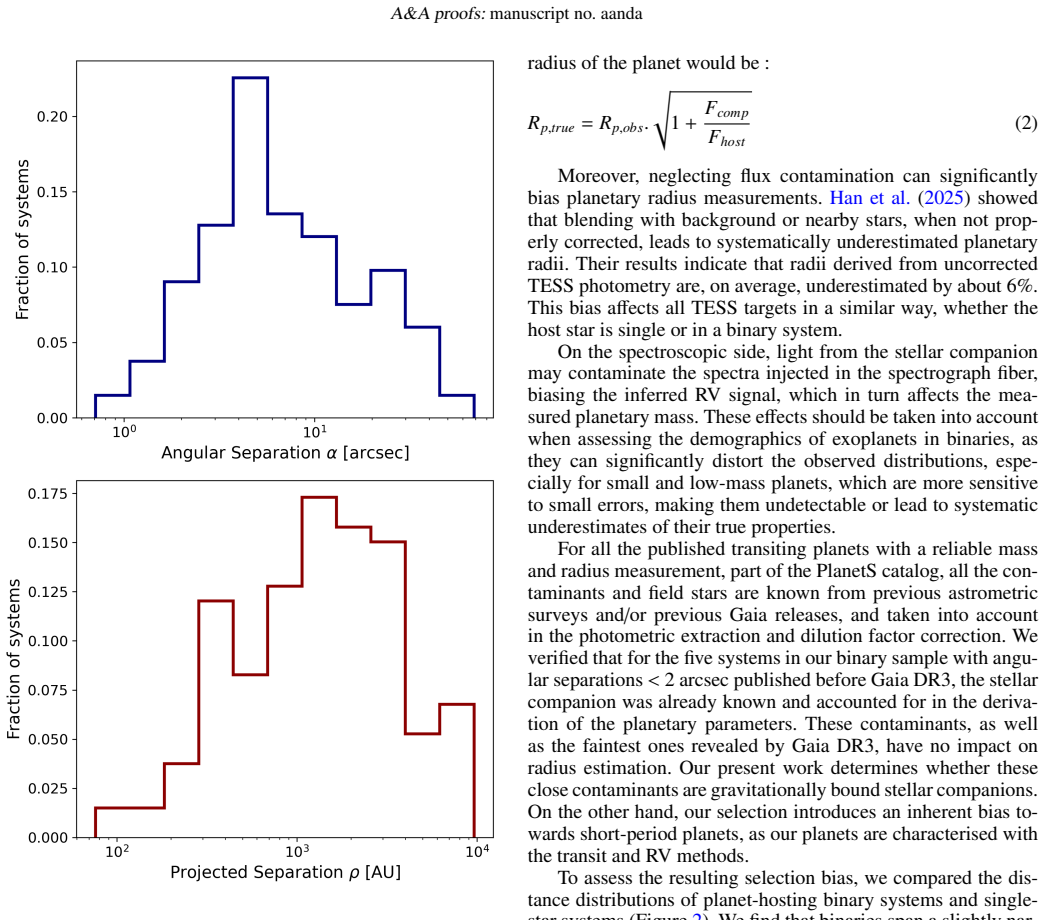
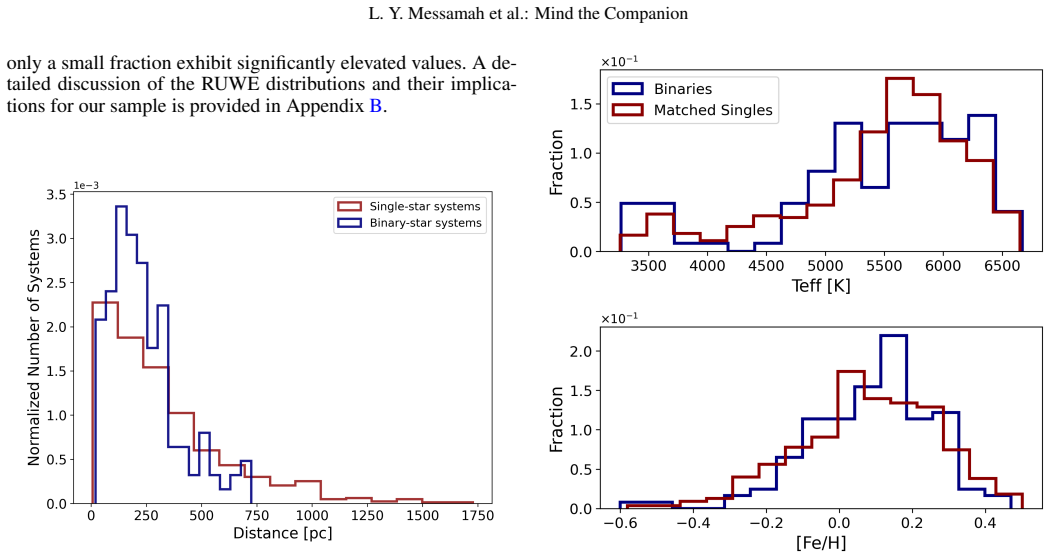
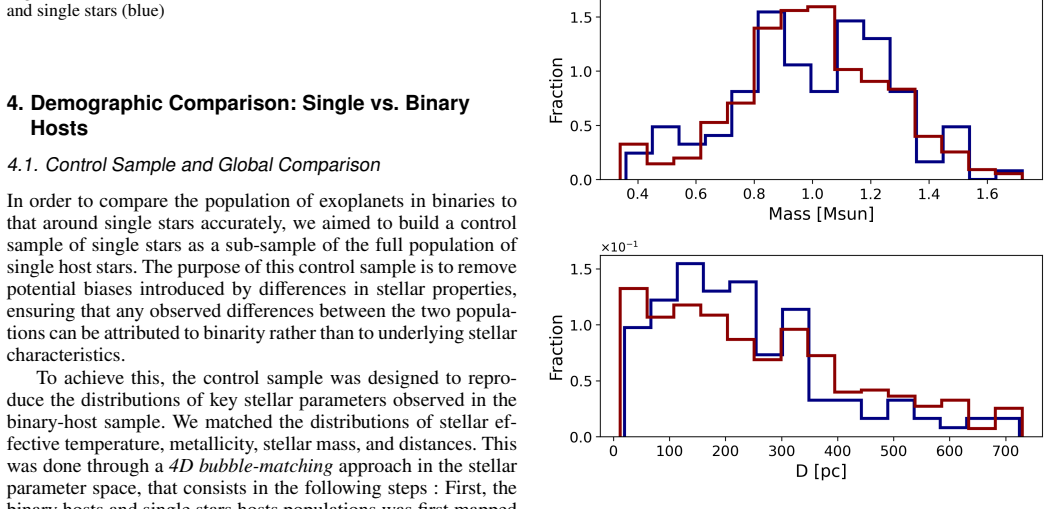
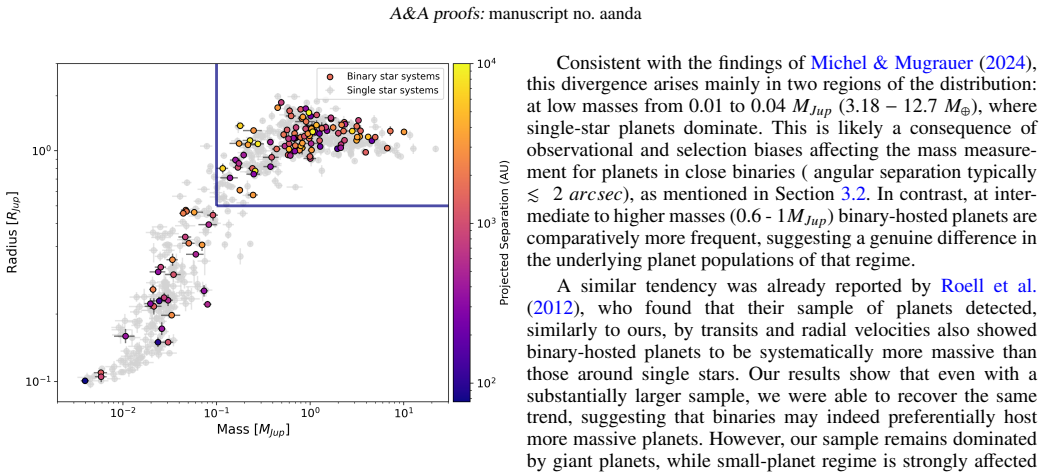
Exoplanet demographic studies rely on large and homogeneous catalogs, yet stellar multiplicity remains incompletely characterised in many planet samples. Misidentified stellar companions can bias both stellar and planetary parameters, leading to ambiguous and incomplete conclusions about planet formation and evolution. We aim to construct a robust and reliable reference catalog of S-type exoplanets for future investigations of planet formation and evolution in multiple-star environments, and to reassess exoplanet demographics by comparing planets hosted by single-stars and binary systems in a statistically consistent framework. We update the PlanetS catalog of transiting exoplanets by systematically identifying gravitationally bound stellar companions using Gaia DR3. Adopting a deliberately conservative classification, we distinguish binary and single-star systems and constructed a matched control sample of single hosts to mitigate selection and observational biases. Using this curated dataset of 860 transiting exoplanets including 133 S-type planets, we performed a comparative demographic analysis of planetary properties as a function of host multiplicity, stellar mass, and binary separation. We find a binary fraction of 19.4% relative to the control sample (15.5% relative to the full single-star sample), consistent with previous estimates but derived from a larger and more homogeneous dataset. Significant demographic differences emerge in the giant planet regime, less affected by observational biases. We find that giant planets in binaries tend to be more massive than their single-star counterparts and to orbit closer to their host stars, making their radius more inflated. In particular, we identify a tentative excess of giant planets orbiting M-dwarfs in binaries with separations < 1000 AU, suggesting a potentially informative regime for future demographic studies.
Editorial analysis
A structured set of objections, weighed in public.
Referee Report
Summary. The paper updates the PlanetS catalog of 860 transiting exoplanets by identifying bound stellar companions via a conservative Gaia DR3 classification, yielding 133 S-type planets. It constructs a matched single-star control sample and performs a comparative demographic analysis, reporting a binary fraction of 19.4% (vs. 15.5% in the full single-star sample) and claiming that giant planets in binaries are more massive, orbit closer-in, and show inflated radii, with a tentative excess of such planets around M-dwarfs in binaries with separations <1000 AU.
Significance. If the bias mitigation holds, the work supplies a larger homogeneous reference catalog of S-type transiting planets and identifies potentially informative trends in the giant-planet regime that could constrain formation pathways in binaries; the conservative classification approach is a strength, but the absence of quantitative error bars, statistical tests, and explicit residual-bias checks limits the immediate impact of the demographic claims.
major comments (3)
- [Methods] Methods (companion classification and control-sample construction): the manuscript asserts that the conservative Gaia DR3 cuts plus matching on host mass, magnitude, and spectral type fully remove selection and observational biases, yet provides no quantitative assessment (e.g., Kolmogorov-Smirnov statistics or dilution-correction residuals) of how well the matching mitigates effects from unresolved companions on transit depths, radii, or RV amplitudes; this directly underpins the central claim of intrinsic demographic differences.
- [Results] Results (giant-planet demographic comparison): the statements that giant planets in binaries "tend to be more massive," "orbit closer," and have "more inflated" radii are presented without reported error bars, median values with uncertainties, or any statistical significance test (e.g., Mann-Whitney U or bootstrap p-values) comparing the binary and control samples; the same holds for the reported binary fraction of 19.4% versus 15.5%.
- [Results] Results (M-dwarf excess): the "tentative excess" of giant planets around M-dwarfs in binaries with separations <1000 AU is stated without the supporting counts, occurrence rates, or any formal test against the control sample, rendering the claim unverifiable from the given information and load-bearing for the suggestion of a "potentially informative regime."
minor comments (3)
- [Abstract] Abstract and text: the phrase "making their radius more inflated" is imprecise; clarify whether this refers to observed radius or radius relative to an expected mass-radius relation.
- [Methods] Catalog description: the total of 860 planets and 133 S-type planets should be accompanied by a brief statement of the final sample sizes after all cuts and matching.
- [Abstract] Notation: ensure consistent use of "S-type" versus "binary-hosted" throughout; the current abstract mixes both.
Simulated Author's Rebuttal
We thank the referee for the constructive feedback. We agree that adding quantitative bias checks and statistical tests will strengthen the presentation of our demographic results and have revised the manuscript accordingly.
read point-by-point responses
-
Referee: [Methods] Methods (companion classification and control-sample construction): the manuscript asserts that the conservative Gaia DR3 cuts plus matching on host mass, magnitude, and spectral type fully remove selection and observational biases, yet provides no quantitative assessment (e.g., Kolmogorov-Smirnov statistics or dilution-correction residuals) of how well the matching mitigates effects from unresolved companions on transit depths, radii, or RV amplitudes; this directly underpins the central claim of intrinsic demographic differences.
Authors: We agree that explicit quantitative validation strengthens the methods section. In the revised manuscript we will add Kolmogorov-Smirnov tests on the matched distributions of host mass, magnitude and spectral type, together with a direct comparison of planetary radii and masses before versus after dilution corrections to quantify any residual bias. revision: yes
-
Referee: [Results] Results (giant-planet demographic comparison): the statements that giant planets in binaries "tend to be more massive," "orbit closer," and have "more inflated" radii are presented without reported error bars, median values with uncertainties, or any statistical significance test (e.g., Mann-Whitney U or bootstrap p-values) comparing the binary and control samples; the same holds for the reported binary fraction of 19.4% versus 15.5%.
Authors: We accept that the demographic claims require statistical support. The revised text will report median values with 16-84 percentile uncertainties for mass, semi-major axis and radius in the giant-planet subset, together with Mann-Whitney U p-values and bootstrap confidence intervals. Binomial uncertainties will also be added to the binary-fraction comparison. revision: yes
-
Referee: [Results] Results (M-dwarf excess): the "tentative excess" of giant planets around M-dwarfs in binaries with separations <1000 AU is stated without the supporting counts, occurrence rates, or any formal test against the control sample, rendering the claim unverifiable from the given information and load-bearing for the suggestion of a "potentially informative regime."
Authors: We will add the raw counts of M-dwarf giant-planet hosts in the binary (<1000 AU) and control samples and include a formal test (Fisher's exact or chi-squared) of the excess. Our analysis concerns demographic trends within the known transiting sample rather than occurrence rates, which would require separate completeness modeling; the added counts and test make the claim directly verifiable. revision: partial
Circularity Check
No circularity: demographic claims derived from external Gaia and PlanetS data
full rationale
The paper updates the PlanetS catalog using Gaia DR3 astrometry for companion identification, applies conservative cuts, builds a matched single-star control sample, and reports direct statistical comparisons of planet properties. No equations, fitted parameters, or predictions reduce by construction to the inputs; the binary fraction and demographic trends (e.g., giant-planet mass and separation differences) are computed from the curated external dataset rather than from any self-referential definition or self-citation chain. The analysis is therefore self-contained against independent benchmarks.
Axiom & Free-Parameter Ledger
axioms (1)
- domain assumption Gaia DR3 astrometry and photometry are sufficient to distinguish gravitationally bound companions from chance alignments at the separations considered
Reference graph
Works this paper leans on
-
[1]
2024, Astronomy & Astro- physics
Almendros-Abad, V ., Manara, C., Testi, L., et al. 2024, Astronomy & Astro- physics
2024
-
[2]
2013, The Astrophysical Journal, 771
Andrews, S., Rosenfeld, K., Kraus, A., & Wilner, D. 2013, The Astrophysical Journal, 771
2013
-
[3]
& Lubow, S
Artymowicz, P. & Lubow, S. H. 1994, ApJ, 421, 651
1994
-
[4]
Á., Hartman, J
Bakos, G. Á., Hartman, J. D., Torres, G., et al. 2012, AJ, 144, 19
2012
-
[5]
Á., Pál, A., Torres, G., et al
Bakos, G. Á., Pál, A., Torres, G., et al. 2009, ApJ, 696, 1950
2009
-
[6]
S., Desidera, S., Benatti, S., et al
Bonomo, A. S., Desidera, S., Benatti, S., et al. 2017, A&A, 602, A107
2017
-
[7]
2025, A&A, 700, A10
Bouchy, F., Doyon, R., Pepe, F., et al. 2025, A&A, 700, A10
2025
-
[8]
2023, A&A, 669, A63
Bourrier, V ., Attia, M., Mallonn, M., et al. 2023, A&A, 669, A63
2023
-
[9]
M., Bayliss, D., & Van Eylen, V
Bryant, E. M., Bayliss, D., & Van Eylen, V . 2023, MNRAS, 521, 3663 Castro-González, A., Bourrier, V ., Lillo-Box, J., et al. 2024, A&A, 689, A250
2023
-
[10]
R., Beichman, C
Ciardi, D. R., Beichman, C. A., Horch, E. P., & Howell, S. B. 2015, ApJ, 805, 16
2015
-
[11]
A., Kielkopf, J
Collins, K. A., Kielkopf, J. F., & Stassun, K. G. 2017, AJ, 153, 78
2017
-
[12]
& Barbieri, M
Desidera, S. & Barbieri, M. 2007, A&A, 462, 345
2007
-
[13]
& Mayor, M
Duquennoy, A. & Mayor, M. 1991, A&A, 248, 485
1991
-
[14]
D., Beatty, T
Eastman, J. D., Beatty, T. G., Siverd, R. J., et al. 2016, AJ, 151, 45
2016
-
[15]
& Armstrong, D
Eeles-Nolle, F. & Armstrong, D. J. 2025, MNRAS, 541, 1419
2025
-
[16]
2004, A&A, 417, 353
Eggenberger, A., Udry, S., & Mayor, M. 2004, A&A, 417, 353
2004
-
[17]
El-Badry, K., Rix, H.-W., & Heintz, T. M. 2021, MNRAS, 506, 2269
2021
-
[18]
2024, MNRAS, 527, 10016
Flores, M., Yana Galarza, J., Miquelarena, P., et al. 2024, MNRAS, 527, 10016
2024
-
[19]
& Bardalez Gagliuffi, D
Fontanive, C. & Bardalez Gagliuffi, D. 2021, Frontiers in Astronomy and Space Sciences, 8, 16
2021
- [20]
-
[21]
Glusman, R. I., Cañas, C. I., Kanodia, S., et al. 2025, arXiv e-prints, arXiv:2509.08773
-
[22]
2014, MNRAS, 443, 393
Gonzalez, G. 2014, MNRAS, 443, 393
2014
- [23]
-
[24]
D., et al
Han, T., Robertson, P., Brandt, T. D., et al. 2025, ApJ, 988, L4
2025
-
[25]
B., Hirano, T., et al
Hjorth, M., Justesen, A. B., Hirano, T., et al. 2019, MNRAS, 484, 3522 Jofré, E., Petrucci, R., Maqueo Chew, Y . G., et al. 2021, AJ, 162, 291
2019
-
[26]
2023, A&A, 673, A69
Lavie, B., Bouchy, F., Lovis, C., et al. 2023, A&A, 673, A69
2023
-
[27]
V ., Howell, S
Lester, K. V ., Howell, S. B., Matson, R. A., et al. 2023, AJ, 166, 166
2023
-
[28]
2018, A&A, 616, A2
Lindegren, L., Hernández, J., Bombrun, A., et al. 2018, A&A, 616, A2
2018
-
[29]
A., Hernández, J., et al
Lindegren, L., Klioner, S. A., Hernández, J., et al. 2021, A&A, 649, A2
2021
-
[30]
F., Tazzari, M., Long, F., et al
Manara, C. F., Tazzari, M., Long, F., et al. 2019, A&A, 628, A95
2019
-
[31]
2016, A&A, 589, A75
Mazeh, T., Holczer, T., & Faigler, S. 2016, A&A, 589, A75
2016
-
[32]
& Mugrauer, M
Michel, K.-U. & Mugrauer, M. 2021, Frontiers in Astronomy and Space Sci- ences, 8, 14
2021
-
[33]
& Mugrauer, M
Michel, K.-U. & Mugrauer, M. 2024, MNRAS, 527, 3183
2024
-
[34]
& Di Stefano, R
Moe, M. & Di Stefano, R. 2017, ApJS, 230, 15
2017
-
[35]
& Kratter, K
Moe, M. & Kratter, K. M. 2021, MNRAS, 507, 3593
2021
-
[36]
2018, in Handbook of Exoplanets, ed
Mordasini, C. 2018, in Handbook of Exoplanets, ed. H. J. Deeg & J. A. Bel- monte, 143
2018
-
[37]
2023, Astronomische Nachrichten, 344, e20230055
Mugrauer, M., Rück, J., & Michel, K.-U. 2023, Astronomische Nachrichten, 344, e20230055
2023
-
[38]
2026, A&A, 708, A38
Nigioni, A., Venturini, J., Bolmont, E., et al. 2026, A&A, 708, A38
2026
-
[39]
Offner, S. S. R., Moe, M., Kratter, K. M., et al. 2023, in Astronomical Society of the Pacific Conference Series, V ol. 534, Protostars and Planets VII, ed. S. Inutsuka, Y . Aikawa, T. Muto, K. Tomida, & M. Tamura, 275
2023
-
[40]
F., Bouchy, F., & Helled, R
Otegi, J. F., Bouchy, F., & Helled, R. 2020, A&A, 634, A43
2020
-
[41]
& Pringle, J
Papaloizou, J. & Pringle, J. E. 1977, MNRAS, 181, 441
1977
-
[42]
2024, A&A, 688, A59
Parc, L., Bouchy, F., Venturini, J., Dorn, C., & Helled, R. 2024, A&A, 688, A59
2024
-
[43]
Pecaut, M. J. & Mamajek, E. E. 2013, ApJS, 208, 9
2013
-
[44]
2011, Journal of Machine Learning Research, 12, 2825
Pedregosa, F., Varoquaux, G., Gramfort, A., et al. 2011, Journal of Machine Learning Research, 12, 2825
2011
-
[45]
Penoyre, Z., Belokurov, V ., & Evans, N. W. 2022, MNRAS, 513, 2437
2022
-
[46]
A., Sinukoff, E., Lopez, E
Petigura, E. A., Sinukoff, E., Lopez, E. D., et al. 2017, AJ, 153, 142
2017
-
[47]
A., Henry, T
Raghavan, D., McAlister, H. A., Henry, T. J., et al. 2010, ApJS, 190, 1
2010
-
[48]
E., Quinn, S
Rodriguez, J. E., Quinn, S. N., Vanderburg, A., et al. 2023, MNRAS, 521, 2765
2023
-
[49]
2012, A&A, 542, A92
Roell, T., Neuhäuser, R., Seifahrt, A., & Mugrauer, M. 2012, A&A, 542, A92
2012
-
[50]
C., Bouchy, F., Mayor, M., et al
Santos, N. C., Bouchy, F., Mayor, M., et al. 2004, A&A, 426, L19
2004
-
[51]
2022, A&A, 664, A180
Schlecker, M., Burn, R., Sabotta, S., et al. 2022, A&A, 664, A180
2022
-
[52]
Schmidt, S. P., Thorngren, D. P., & Schlaufman, K. C. 2025, arXiv e-prints, arXiv:2512.08932
-
[53]
G., Knutson, H
Shporer, A., O’Rourke, J. G., Knutson, H. A., et al. 2014, ApJ, 788, 92
2014
-
[54]
K., Pollacco, D., Hébrard, G., et al
Simpson, E. K., Pollacco, D., Hébrard, G., et al. 2010, MNRAS, 405, 1867
2010
-
[55]
L., Berger, T
Sullivan, K., Kraus, A. L., Berger, T. A., et al. 2024, AJ, 168, 129
2024
-
[56]
L., Huber, D., et al
Sullivan, K., Kraus, A. L., Huber, D., et al. 2023, AJ, 165, 177
2023
-
[57]
K., Khanal, S., & Ramírez, I
Teske, J. K., Khanal, S., & Ramírez, I. 2016, ApJ, 819, 19
2016
-
[58]
& Bonanni, D
Thebault, P. & Bonanni, D. 2025, A&A, 700, A106
2025
- [59]
-
[60]
D., Pearson, K
Turner, J. D., Pearson, K. A., Biddle, L. I., et al. 2016, MNRAS, 459, 789
2016
-
[61]
P., Jungo, N., & Emsenhuber, A
Venturini, J., Nigioni, A., Ronco, M. P., Jungo, N., & Emsenhuber, A. 2026, A&A, 708, A37
2026
-
[62]
E., et al
Virtanen, P., Gommers, R., Oliphant, T. E., et al. 2020, Nature Methods, 17, 261 Šubjak, J., Latham, D. W., Quinn, S. N., et al. 2024, A&A, 688, A120
2020
-
[63]
A., Xie, J.-W., & Ciardi, D
Wang, J., Fischer, D. A., Xie, J.-W., & Ciardi, D. R. 2014, ApJ, 791, 111
2014
-
[64]
G., Cloutier, R., Medina, A
Winters, J. G., Cloutier, R., Medina, A. A., et al. 2022, AJ, 163, 168
2022
-
[65]
P., & Lodato, G
Zagaria, F., Rosotti, G. P., & Lodato, G. 2021, MNRAS, 507, 2531
2021
-
[66]
2026, AJ, 171, 77
Zhang, J., Huber, D., Bottom, M., et al. 2026, AJ, 171, 77
2026
-
[67]
M., Huber, D., et al
Zhang, J., Weiss, L. M., Huber, D., et al. 2024, AJ, 167, 89
2024
-
[68]
& Mazeh, T
Zucker, S. & Mazeh, T. 2002, ApJ, 568, L113 Article number, page 12 of 14 L. Y . Messamah et al.: Mind the Companion Appendix A: Reassessment of Triple Systems in thePlanetSCatalog The original version of thePlanetScatalog included 15 sys- tems classified as triple stellar systems. We reassessed each of these systems using Gaia DR3 astrometry, and availab...
2002
discussion (0)
Sign in with ORCID, Apple, or X to comment. Anyone can read and Pith papers without signing in.