Geodesics of Dynamic Graphs for Regime Change Detection
Pith reviewed 2026-06-27 22:12 UTC · model grok-4.3
The pith
Regimes in dynamic graphs are coherent trajectories along geodesics in graph space, with changes detected as cumulative drifts from those paths.
A machine-rendered reading of the paper's core claim, the machinery that carries it, and where it could break.
Core claim
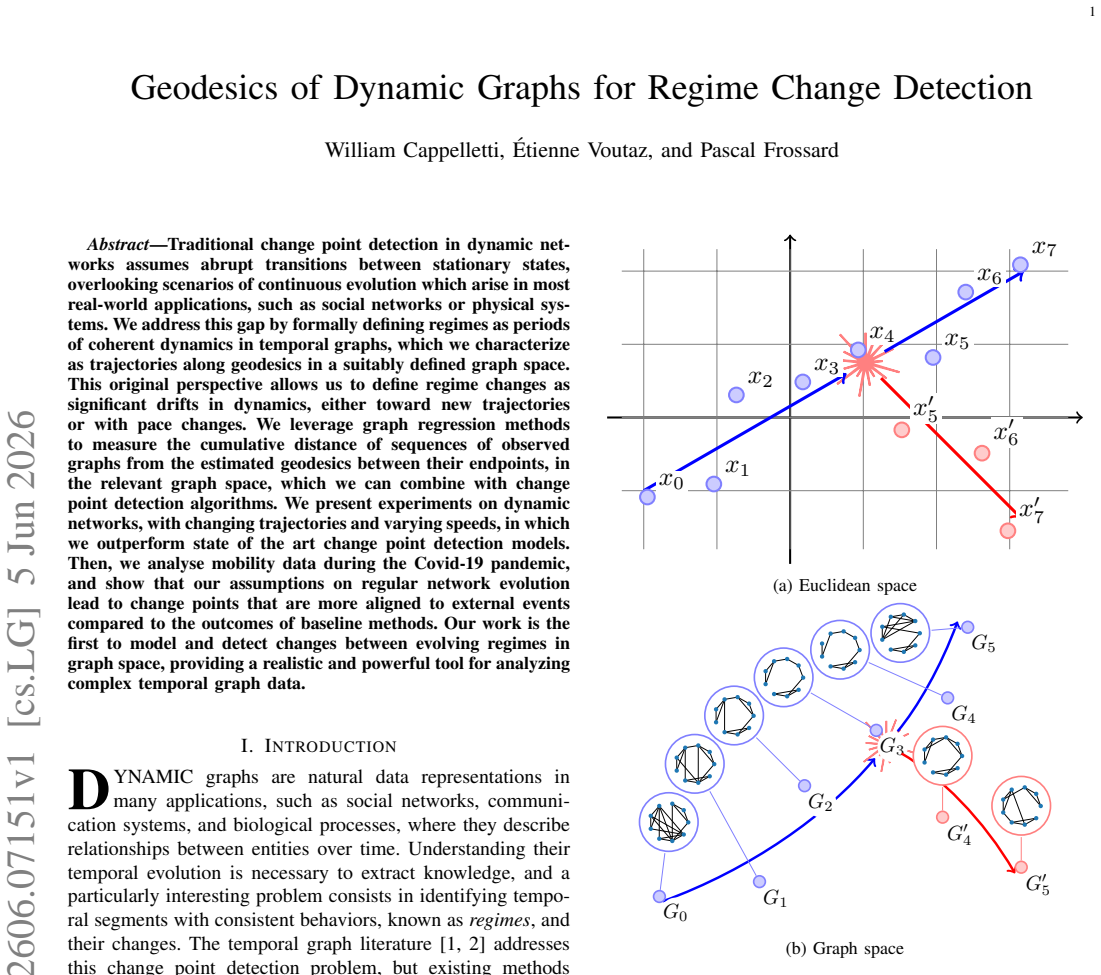
Regimes are defined as periods of coherent dynamics in temporal graphs and characterized as trajectories along geodesics in a suitably defined graph space; regime changes are then significant drifts in dynamics, either toward new trajectories or with pace changes, measured as the cumulative distance of observed graph sequences from the estimated geodesics between their endpoints via graph regression, which is then combined with change point detection algorithms.
What carries the argument
Geodesics in graph space, representing the shortest coherent evolution paths between endpoint graphs, with cumulative deviation from these paths quantified through graph regression to identify regime shifts.
If this is right
- On synthetic dynamic networks that include both trajectory changes and speed variations, the geodesic-distance approach locates transitions more accurately than existing change point detection models.
- When applied to mobility networks recorded during the Covid-19 pandemic, the detected change points align more closely with documented external events than those returned by baseline methods.
- The framework supplies the first explicit model for detecting transitions between continuously evolving regimes rather than between stationary states.
Where Pith is reading between the lines
- The same distance-to-geodesic signal could be used to forecast the most likely continuation of an ongoing regime before a change is declared.
- If graph regression reliably recovers the underlying geodesic, the method might extend to ranking candidate future graphs by how far they would lie from the current trajectory.
- The approach could be tested on other continuously evolving systems such as citation networks or protein-interaction graphs to check whether the geodesic assumption holds outside mobility data.
Load-bearing premise
Coherent dynamics in temporal graphs correspond to trajectories along geodesics in a suitably defined graph space.
What would settle it
A simulation of temporal graphs whose evolution follows continuous but non-geodesic paths, where the method fails to recover the known change locations better than baseline detectors.
Figures
read the original abstract
Traditional change point detection in dynamic networks assumes abrupt transitions between stationary states, overlooking scenarios of continuous evolution which arise in most real-world applications, such as social networks or physical systems. We address this gap by formally defining regimes as periods of coherent dynamics in temporal graphs, which we characterize as trajectories along geodesics in a suitably defined graph space. This original perspective allows us to define regime changes as significant drifts in dynamics, either toward new trajectories or with pace changes. We leverage graph regression methods to measure the cumulative distance of sequences of observed graphs from the estimated geodesics between their endpoints, in the relevant graph space, which we can combine with change point detection algorithms. We present experiments on dynamic networks, with changing trajectories and varying speeds, in which we outperform state of the art change point detection models. Then, we analyse mobility data during the Covid-19 pandemic, and show that our assumptions on regular network evolution lead to change points that are more aligned to external events compared to the outcomes of baseline methods. Our work is the first to model and detect changes between evolving regimes in graph space, providing a realistic and powerful tool for analyzing complex temporal graph data.
Editorial analysis
A structured set of objections, weighed in public.
Referee Report
Summary. The paper claims that traditional change point detection overlooks continuous evolution in dynamic networks. It defines regimes as periods of coherent dynamics characterized as trajectories along geodesics in a suitably metrized graph space. Regime changes are then defined as significant drifts toward new trajectories or pace changes, measured via cumulative distance from estimated geodesics using graph regression methods applied to sequences of observed graphs. This signal is combined with standard change point detection algorithms. Experiments on synthetic dynamic networks with varying trajectories and speeds show outperformance over state-of-the-art baselines, while analysis of Covid-19 mobility data yields change points more aligned with external events.
Significance. If the central modeling perspective and empirical results hold, the work offers a geometrically grounded approach to detecting changes between evolving regimes rather than assuming abrupt stationary transitions, which aligns better with many real-world temporal graph applications in social and physical systems. The explicit use of geodesics and regression-based deviation provides a falsifiable, extensible framework whose value is demonstrated through both controlled synthetic cases and real-data alignment with known events.
major comments (3)
- [Methods section (graph space and geodesic estimation)] The core claim that coherent dynamics correspond to geodesic trajectories (and that deviations from them detect regime changes) rests on the construction of the graph space and the geodesic estimation procedure. The manuscript provides only high-level definitions without explicit details on the metric, embedding, or optimization used to compute geodesics between endpoints, which is load-bearing for all subsequent claims about distance signals and change detection.
- [Methods section (graph regression and distance computation)] Graph regression is used both to estimate the geodesics between sequence endpoints and to compute the cumulative distance of the same observed sequence from those geodesics. This creates a potential dependence between the fitted quantities and the deviation signal fed to the change point algorithm; the paper must demonstrate (e.g., via controlled ablation or synthetic counter-examples) that the procedure does not introduce spurious detections or circular bias.
- [Experiments section] The experimental claims of outperformance and better alignment with external events rely on specific choices of change point algorithms, parameter settings, and evaluation metrics, yet the manuscript supplies insufficient detail on statistical controls, multiple-run variability, or error analysis to assess whether the reported gains are robust.
minor comments (2)
- Notation for the graph space, geodesic, and regression objective should be introduced with explicit symbols and referenced consistently in the text and figures.
- Figure captions and table legends should explicitly state the graph space metric and regression method used so that results can be interpreted without returning to the main text.
Simulated Author's Rebuttal
We thank the referee for the constructive comments, which help clarify the presentation of our geometric approach to regime change detection in dynamic graphs. We address each major comment below and will revise the manuscript accordingly to improve clarity and rigor.
read point-by-point responses
-
Referee: The core claim that coherent dynamics correspond to geodesic trajectories rests on the construction of the graph space and the geodesic estimation procedure. The manuscript provides only high-level definitions without explicit details on the metric, embedding, or optimization used to compute geodesics between endpoints.
Authors: We agree that the current version presents the graph space construction at a high level. In the revised manuscript we will add explicit definitions of the metric (including its properties), the embedding into the graph space, and the optimization procedure for geodesic computation between sequence endpoints. This will ensure the distance signal derivation is fully specified and reproducible. revision: yes
-
Referee: Graph regression is used both to estimate the geodesics between sequence endpoints and to compute the cumulative distance of the same observed sequence from those geodesics. This creates a potential dependence between the fitted quantities and the deviation signal; the paper must demonstrate that the procedure does not introduce spurious detections or circular bias.
Authors: The concern is valid. The geodesic is fitted solely between the sequence endpoints while the cumulative distance quantifies deviations of intermediate observations; this structure is not inherently circular. Nevertheless, to demonstrate absence of spurious bias we will add, in revision, a controlled ablation on synthetic trajectories that isolates the regression step and reports change-point detection performance with and without it, together with counter-examples where the signal correctly remains flat under stationary dynamics. revision: partial
-
Referee: The experimental claims rely on specific choices of change point algorithms, parameter settings, and evaluation metrics, yet the manuscript supplies insufficient detail on statistical controls, multiple-run variability, or error analysis to assess whether the reported gains are robust.
Authors: We concur that robustness details are currently insufficient. The revised experiments section will include: explicit parameter-selection protocol and sensitivity analysis, aggregated results over multiple independent runs with standard deviations and confidence intervals, and statistical significance tests comparing our method against baselines on both synthetic and COVID mobility data. revision: yes
Circularity Check
No significant circularity identified
full rationale
The paper introduces a modeling perspective that defines regimes as geodesic trajectories in a metrized graph space and then applies graph regression to compute cumulative distances for change-point detection. No equations, self-citations, or fitted-parameter renamings appear in the provided abstract or context that would reduce any claimed prediction or first-principles result to its own inputs by construction. The central contribution is presented as an empirical modeling choice validated on synthetic and real data rather than a theorem whose validity depends on internal self-reference.
Axiom & Free-Parameter Ledger
axioms (1)
- domain assumption Regimes are periods of coherent dynamics in temporal graphs that can be characterized as trajectories along geodesics in a suitably defined graph space.
Reference graph
Works this paper leans on
-
[1]
Anomaly detection in dynamic networks: A survey,
S. Ranshous, S. Shen, D. Koutra, S. Harenberg, C. Faloutsos, and N. F. Samatova, “Anomaly detection in dynamic networks: A survey,”WIREs Computational Statistics, vol. 7, no. 3, 2015.DOI: 10.1002/wics.1347
-
[2]
A Survey of Change Point Detection in Dynamic Graphs,
Y . Zhou, S. Gao, D. Guo, X. Wei, J. Rokne, and H. Wang, “A Survey of Change Point Detection in Dynamic Graphs,”IEEE Transactions on Knowledge and Data Engineering, vol. 37, no. 3, Mar. 2025.DOI: 10.1109/TKDE.2024.3523857
-
[3]
Selective review of offline change point detection methods,
C. Truong, L. Oudre, and N. Vayatis, “Selective review of offline change point detection methods,”Signal Pro- cessing, vol. 167, Feb. 2020.DOI: 10.1016/j.sigpro. 2019.107299
-
[4]
Transfer Graph Neural Networks for Pandemic Forecasting,
G. Panagopoulos, G. Nikolentzos, and M. Vazirgian- nis, “Transfer Graph Neural Networks for Pandemic Forecasting,”Proceedings of the AAAI Conference on Artificial Intelligence, vol. 35, no. 6, May 2021.DOI: 10.1609/aaai.v35i6.16616
-
[5]
A pruned dynamic programming algorithm to recover the best segmentations with 1 to K max change-points.,
G. Rigaill, “A pruned dynamic programming algorithm to recover the best segmentations with 1 to K max change-points.,”Journal de la Soci ´et´e Franc ¸aise de Statistique, vol. 156, no. 4, Dec. 2015
2015
-
[6]
A Cluster Analysis Method for Grouping Means in the Analysis of Variance,
A. J. Scott and M. Knott, “A Cluster Analysis Method for Grouping Means in the Analysis of Variance,” Biometrics, vol. 30, no. 3, 1974.DOI: 10.2307/2529204
-
[7]
R. Killick, P. Fearnhead, and I. A. Eckley, “Optimal De- tection of Changepoints With a Linear Computational Cost,”Journal of the American Statistical Association, vol. 107, no. 500, Dec. 2012.DOI: 10.1080/01621459. 2012.737745 10
-
[8]
Concept Drift and Anomaly Detection in Graph Streams,
D. Zambon, C. Alippi, and L. Livi, “Concept Drift and Anomaly Detection in Graph Streams,”IEEE Trans- actions on Neural Networks and Learning Systems, vol. 29, no. 11, Nov. 2018.DOI: 10 . 1109 / TNNLS . 2018.2804443
arXiv 2018
-
[9]
R. P. Duin et al.,The Dissimilarity Representation for Pattern Recognition: Foundations and Applications. World scientific, 2005, vol. 64
2005
-
[10]
T. Chen, Z. Lubberts, A. Athreya, Y . Park, and C. E. Priebe,Euclidean mirrors and first-order changepoints in network time series, Oct. 2024.DOI: 10.48550/arXiv. 2405.11111
work page internal anchor Pith review doi:10.48550/arxiv 2024
-
[11]
A Comprehensive Survey on Graph Anomaly Detection With Deep Learning,
X. Ma et al., “A Comprehensive Survey on Graph Anomaly Detection With Deep Learning,”IEEE Trans- actions on Knowledge and Data Engineering, vol. 35, no. 12, Dec. 2023.DOI: 10.1109/TKDE.2021.3118815
-
[12]
Statis- tical inference for Bures–Wasserstein barycenters,
A. Kroshnin, V . Spokoiny, and A. Suvorikova, “Statis- tical inference for Bures–Wasserstein barycenters,”The Annals of Applied Probability, vol. 31, no. 3, Jun. 2021. DOI: 10.1214/20-AAP1618
-
[13]
On the Bures– Wasserstein distance between positive definite matri- ces,
R. Bhatia, T. Jain, and Y . Lim, “On the Bures– Wasserstein distance between positive definite matri- ces,”Expositiones Mathematicae, vol. 37, no. 2, Jun. 2019.DOI: 10.1016/j.exmath.2018.01.002
-
[14]
GOT: An Optimal Transport framework for Graph comparison,
H. Petric Maretic, M. El Gheche, G. Chierchia, and P. Frossard, “GOT: An Optimal Transport framework for Graph comparison,” inAdvances in Neural Information Processing Systems, vol. 32, Curran Associates, Inc., 2019
2019
-
[15]
Bures-Wasserstein Means of Graphs,
I. Haasler and P. Frossard, “Bures-Wasserstein Means of Graphs,” inProceedings of The 27th International Con- ference on Artificial Intelligence and Statistics, PMLR, Apr. 2024
2024
-
[16]
At- tribute Fusion in a Latent Process Model for Time Series of Graphs,
M. Tang, Y . Park, N. H. Lee, and C. E. Priebe, “At- tribute Fusion in a Latent Process Model for Time Series of Graphs,”IEEE Transactions on Signal Processing, vol. 61, no. 7, Apr. 2013.DOI: 10 . 1109 / TSP. 2013 . 2243445
2013
-
[17]
Laplacian Change Point Detection for Dynamic Graphs,
S. Huang, Y . Hitti, G. Rabusseau, and R. Rab- bany, “Laplacian Change Point Detection for Dynamic Graphs,” inProceedings of the 26th ACM SIGKDD International Conference on Knowledge Discovery & Data Mining, Virtual Event CA USA: ACM, Aug. 2020. DOI: 10.1145/3394486.3403077
-
[18]
A Global Geometric Framework for Nonlinear Dimen- sionality Reduction,
J. B. Tenenbaum, V . de Silva, and J. C. Langford, “A Global Geometric Framework for Nonlinear Dimen- sionality Reduction,”Science, vol. 290, no. 5500, Dec. 2000.DOI: 10.1126/science.290.5500.2319
-
[19]
Vector Autoregressive Models with Structural Changes in Regression Coefficients and in Variance- Covariance Matrices,
J. Bai, “Vector Autoregressive Models with Structural Changes in Regression Coefficients and in Variance- Covariance Matrices,”CEMA Working Papers, no. 24, Oct. 2000
2000
-
[20]
Optimal Transport for structured data with application on graphs,
V . Titouan, N. Courty, R. Tavenard, C. Laetitia, and R. Flamary, “Optimal Transport for structured data with application on graphs,” inProceedings of the 36th International Conference on Machine Learning, PMLR, May 2019
2019
-
[21]
Inexact graph matching for structural pattern recognition,
H. Bunke and G. Allermann, “Inexact graph matching for structural pattern recognition,”Pattern Recognition Letters, vol. 1, no. 4, May 1983.DOI: 10.1016/0167- 8655(83)90033-8 APPENDIX A. Additional Results for CPD on Synthetic Data Tables IV to VI compare change detection metrics for multiple algorithms on synthetic SBM trajectories, withour methodsin ita...
discussion (0)
Sign in with ORCID, Apple, or X to comment. Anyone can read and Pith papers without signing in.