Measurements of the Angular Homogeneity Scale from DESI DR1
Pith reviewed 2026-06-27 20:43 UTC · model grok-4.3
The pith
DESI DR1 data identifies the angular homogeneity scale in every redshift bin from 0.4 to 1.1 and finds values matching ΛCDM mocks.
A machine-rendered reading of the paper's core claim, the machinery that carries it, and where it could break.
Core claim
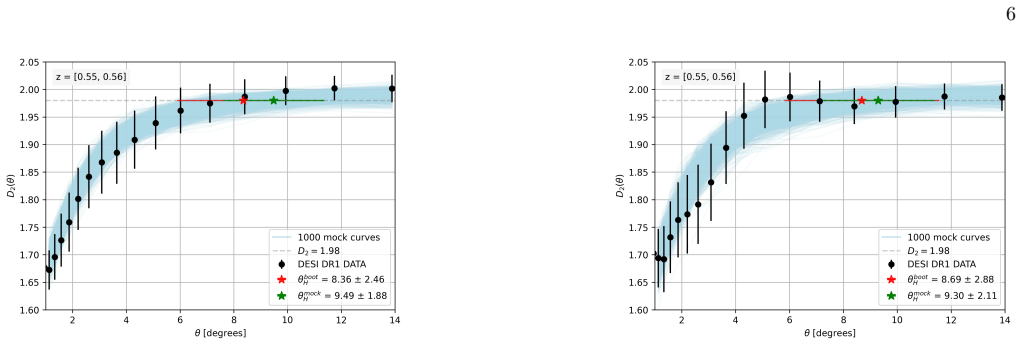
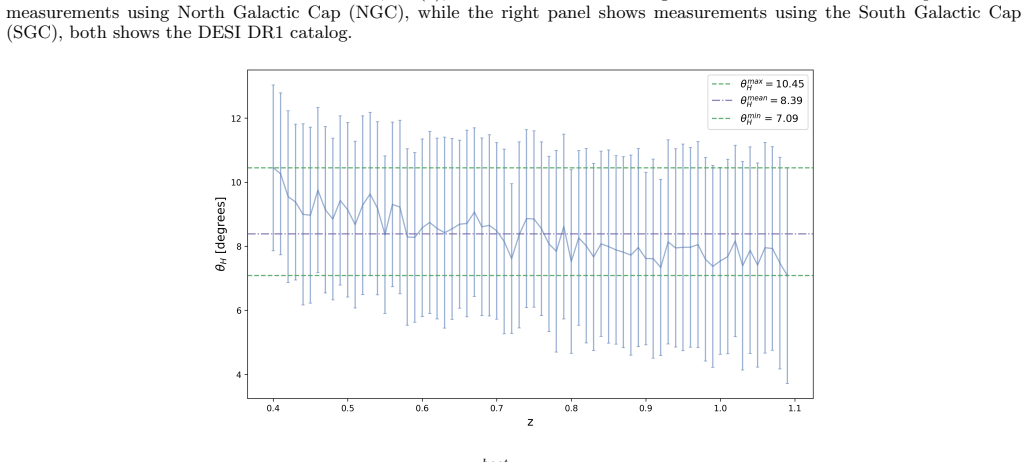
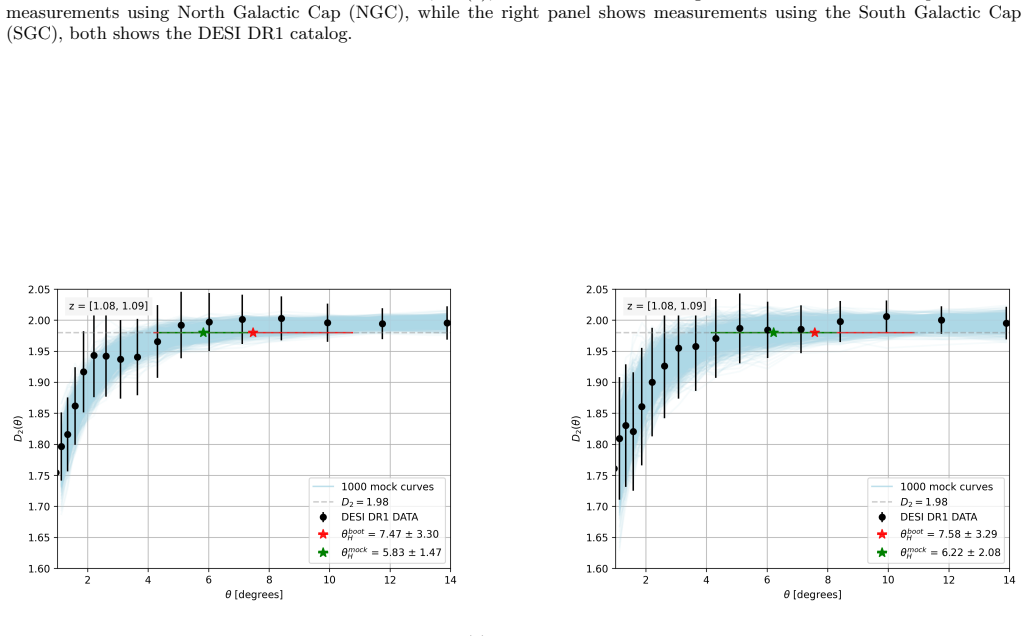
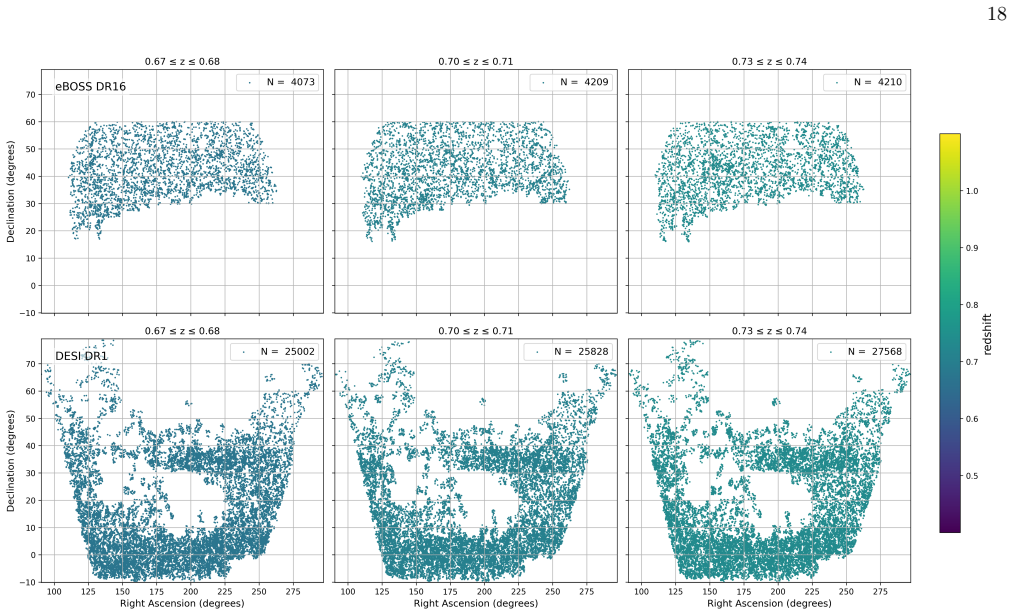
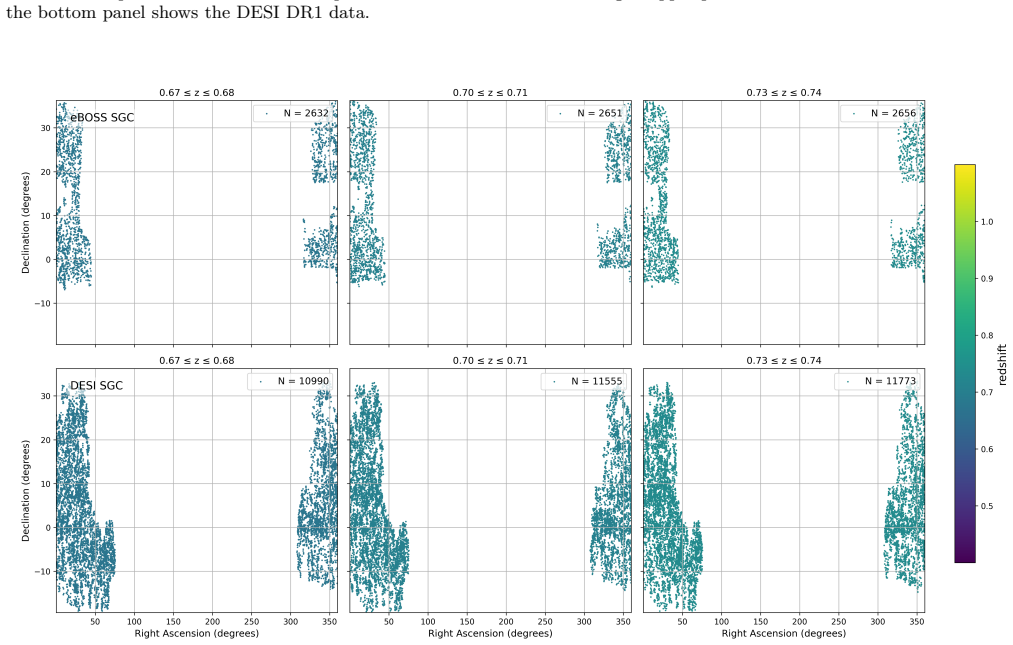
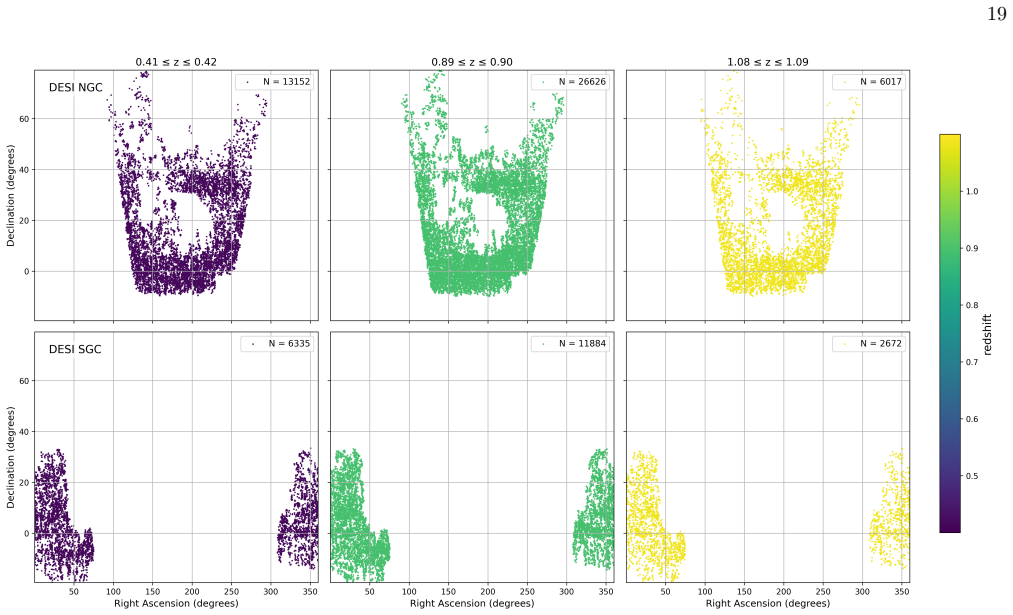
The angular homogeneity scale is identified in all redshift ranges, and the measured values are consistent with mock simulations assuming the ΛCDM model. The results also show strong agreement with previous measurements from SDSS-IV eBOSS DR16 as well as between the north and south galactic caps of the DESI DR1 survey. These outcomes support statistical homogeneity and isotropy of the universe on large scales.
What carries the argument
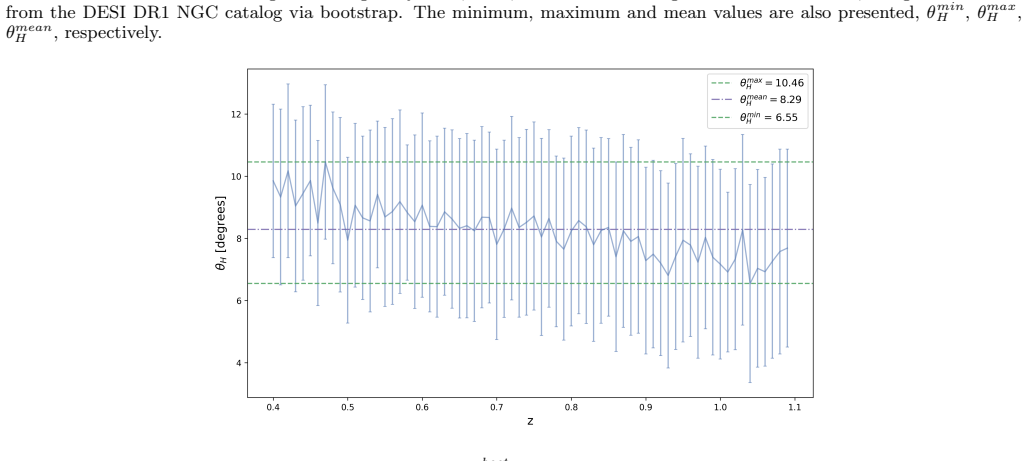
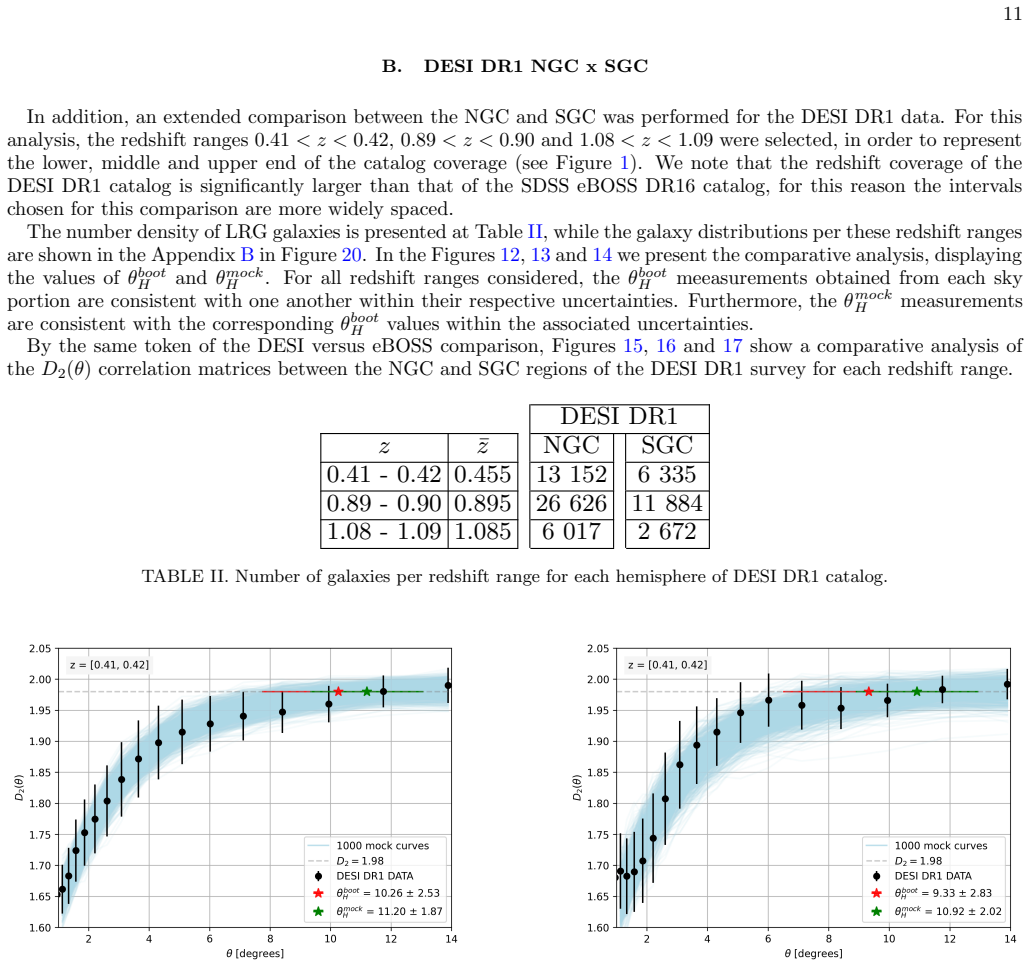
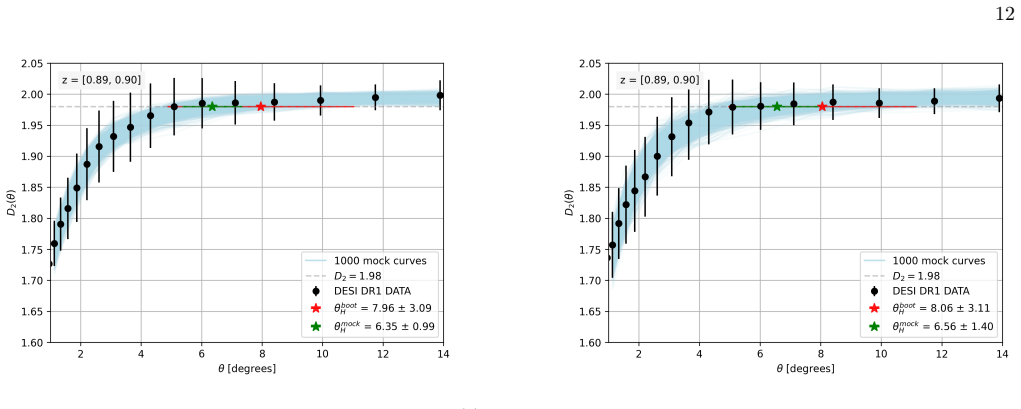
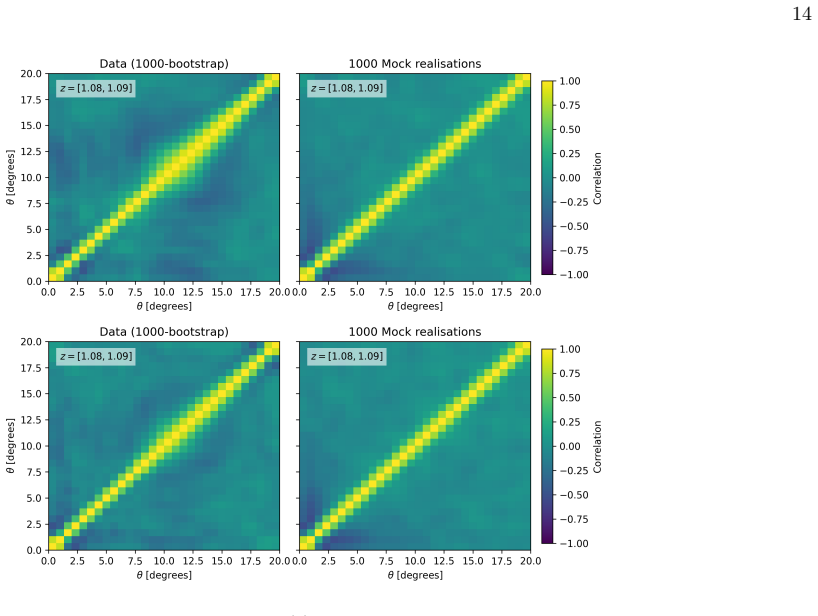
The angular homogeneity scale θ_H, extracted from two-dimensional angular galaxy correlations computed inside narrow redshift slices.
If this is right
- The Cosmological Principle remains a valid working hypothesis for the redshift range and sky regions probed.
- ΛCDM mock catalogs correctly predict the scale at which angular homogeneity appears.
- No tension appears between independent surveys or between opposite galactic caps.
- The same testing approach can be applied directly to forthcoming stage-IV redshift surveys.
Where Pith is reading between the lines
- If three-dimensional analyses recover the same scale, the case for homogeneity would rest on fewer assumptions about projection effects.
- Persistent agreement across multiple independent surveys suggests that remaining systematic uncertainties in homogeneity measurements are smaller than the statistical errors reported here.
- Any future claim of large-scale inhomogeneity would need to appear on scales larger than those already tested or in redshift ranges outside 0.4 < z < 1.1.
Load-bearing premise
Performing the analysis exclusively in two dimensions inside narrow redshift slices inside 0.4 < z < 1.1 removes enough dependence on the underlying cosmological model that consistency with mocks can be claimed without circularity.
What would settle it
A measurement in any single redshift bin where the recovered homogeneity scale lies outside the uncertainty range of both the ΛCDM mocks and the earlier eBOSS DR16 values would falsify the reported consistency.
Figures
read the original abstract
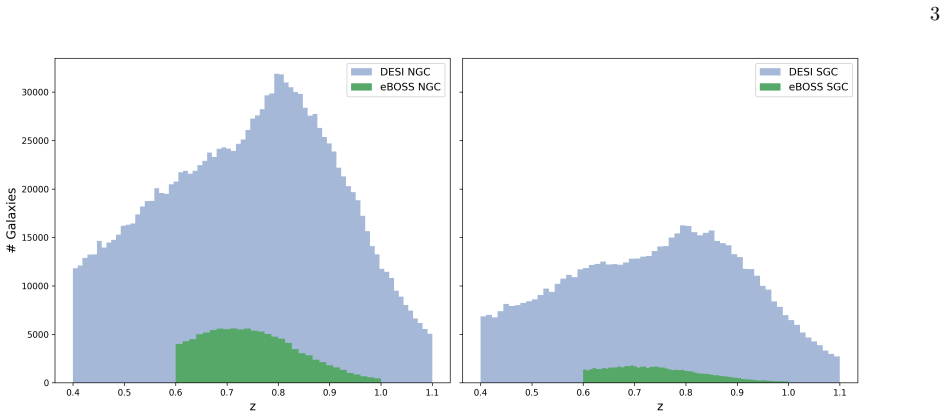
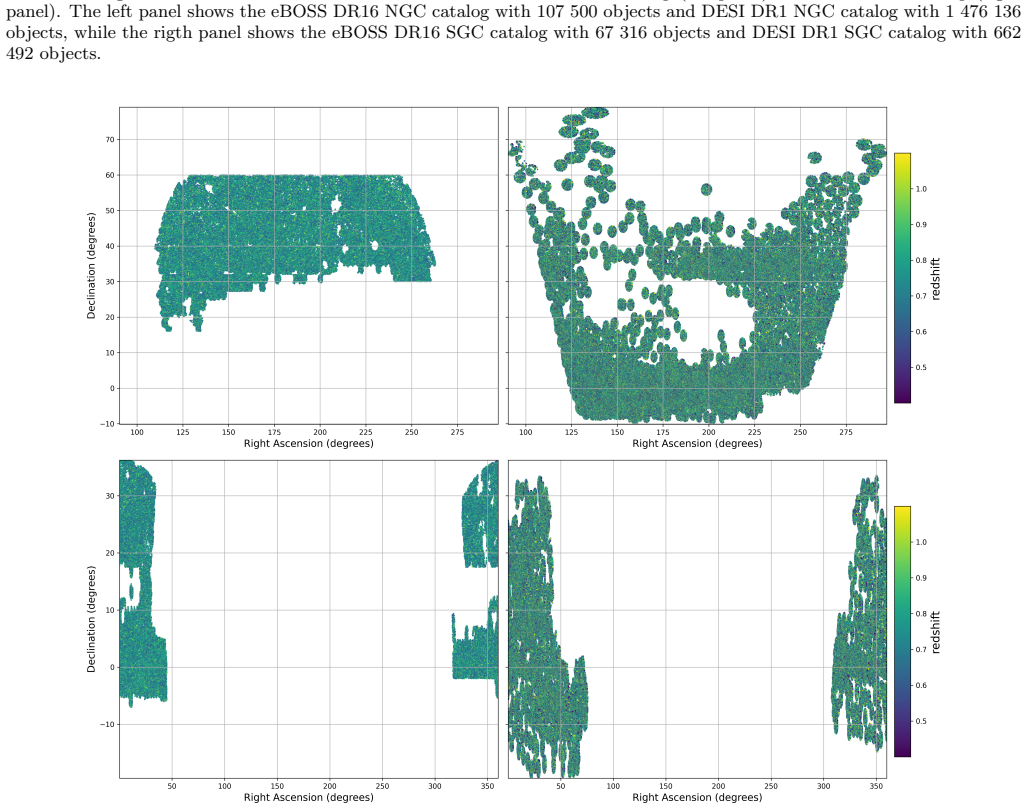
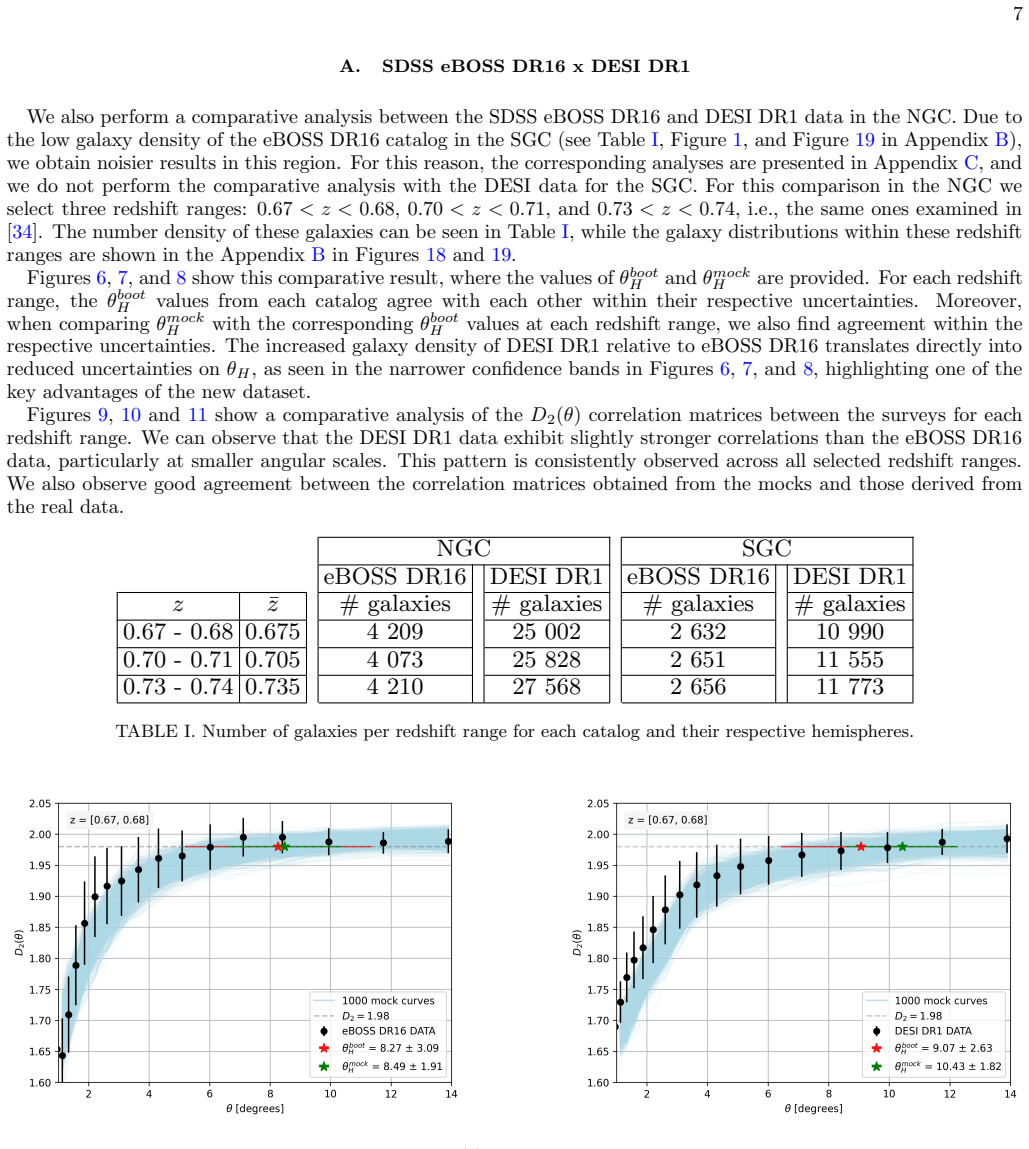
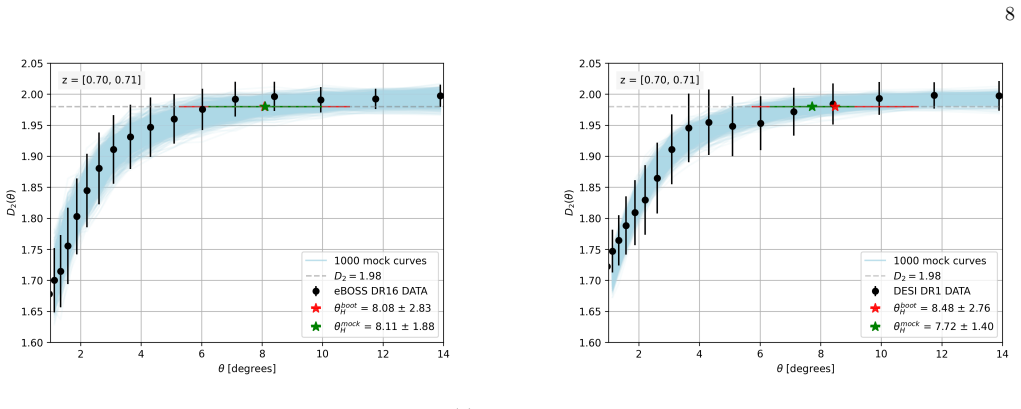
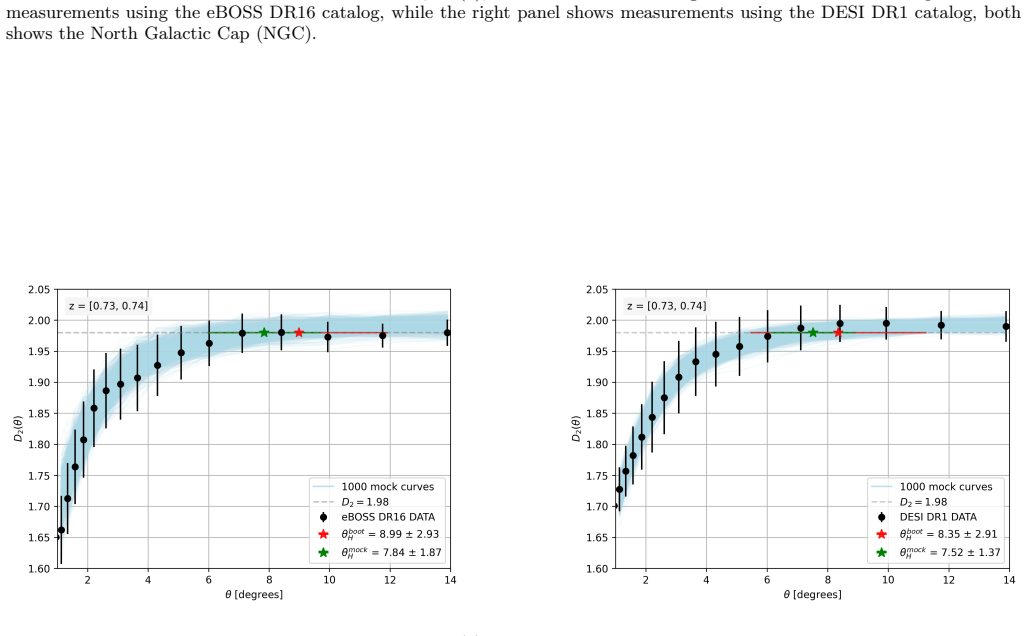
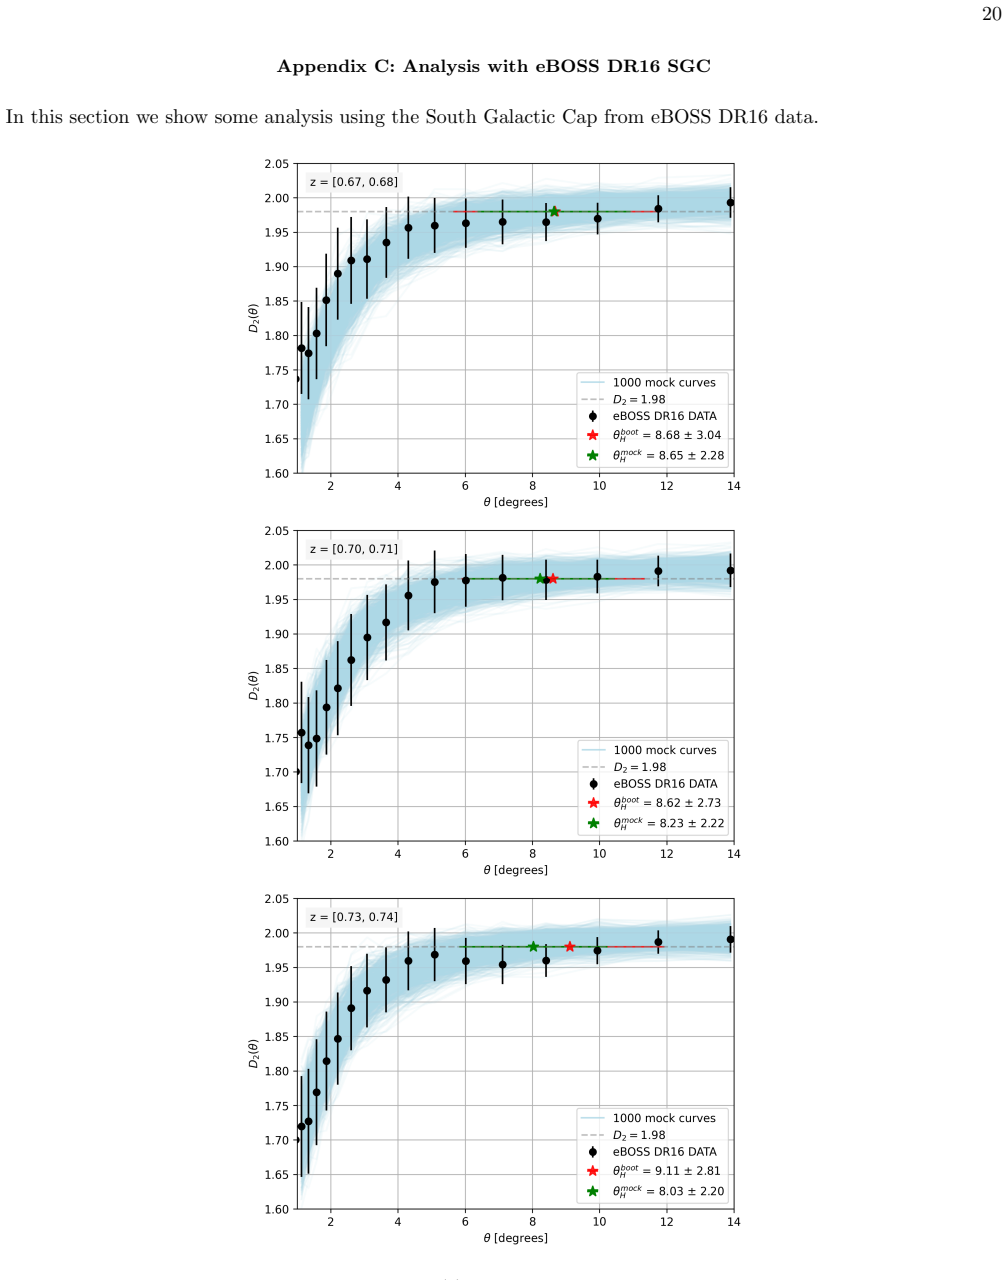
The study of the large-scale distribution of galaxies provides essential information for testing the standard cosmological model, namely the $\Lambda$CDM paradigm. This scenario is based upon two foundations: General Relativity as the theory of gravity, and the Cosmological Principle, which states that the Universe is statistically homogeneous and isotropic on large scales -- so that we can measure distances and ages in the Universe assuming the FLRW metric. In this work, we perform a test of the Cosmological Principle by probing the angular homogeneity scale, $\theta_H$, using the state-of-the-art observational data of Luminous Red Galaxies (LRGs) from the Dark Energy Spectroscopic Instrument Data Release 1 (DESI DR1). Our analysis is performed exclusively in two dimensions, across narrow redshift ranges inside a larger redshift sample of $0.4 < z < 1.1$, in two different surveyed regions of the sky (North and South Galactic Caps), as we want to minimize a priori dependences on an underlying cosmological model. We obtain that such a scale is indeed identified in all redshift ranges, and that they are consistent with mock simulations assuming the $\Lambda$CDM model. Moreover, our results are in great agreement with previous measurements using Sloan Digital Sky Survey IV extended Baryon Oscillation Spectroscopic Survey Data Release 16 (SDSS-IV eBOSS DR16), as well as between the north and south galactic caps of the DESI DR1 survey. These findings help underpinning statistical isotropy and homogeneity of the Universe as a physically valid hypothesis in light of upcoming stage-IV redshift surveys, hence are consistent with one of the fundamental pillars of the standard cosmological model.
Editorial analysis
A structured set of objections, weighed in public.
Referee Report
Summary. The manuscript reports measurements of the angular homogeneity scale θ_H from DESI DR1 LRG data in narrow redshift slices (0.4 < z < 1.1) using two-dimensional angular statistics in the North and South Galactic Caps. It claims that θ_H is detected in all redshift ranges, is consistent with ΛCDM mock simulations, agrees with previous eBOSS DR16 measurements, and is consistent between the two caps, thereby supporting the Cosmological Principle with minimal cosmological model dependence.
Significance. If the central results hold, the work provides a valuable consistency test of large-scale homogeneity using new, high-quality data from DESI. The agreement between NGC and SGC and with prior surveys is a strength. The approach aims to reduce model dependence through the choice of 2D narrow-slice analysis, which is a positive methodological choice. However, the overall significance for testing the Cosmological Principle is moderated because the validation is performed against mocks that assume the ΛCDM model rather than through a fully model-independent metric.
major comments (2)
- [Abstract] The abstract asserts that the homogeneity scale is identified and consistent with mocks but does not provide any quantitative values, error bars, sample sizes, or the precise definition and extraction method for θ_H. This omission makes it impossible to assess whether the data actually support the stated claim of detection and consistency.
- [Methods section (narrow redshift slices)] The central claim of achieving minimal a priori dependence on an underlying cosmological model through the use of narrow redshift slices and purely angular 2D measurements is load-bearing for the paper's interpretation. However, the definition of θ_H (via angular correlation function or counts-in-cells) and the random catalog construction still require the survey selection function n(z) and mask, which may embed fiducial cosmology assumptions even in narrow slices. This needs explicit quantification or demonstration that residual dependence is negligible.
minor comments (1)
- [Abstract] The phrasing 'in great agreement' is vague; specific quantitative comparison metrics should be provided in the results.
Simulated Author's Rebuttal
We thank the referee for their detailed review and constructive suggestions. We have carefully considered the major comments and will make revisions to address them as outlined below.
read point-by-point responses
-
Referee: [Abstract] The abstract asserts that the homogeneity scale is identified and consistent with mocks but does not provide any quantitative values, error bars, sample sizes, or the precise definition and extraction method for θ_H. This omission makes it impossible to assess whether the data actually support the stated claim of detection and consistency.
Authors: We agree with this assessment. The revised abstract will include quantitative measurements of θ_H (with 1σ uncertainties) for the redshift bins, the number of galaxies in the NGC and SGC samples, and a concise description of how θ_H is defined and extracted from the angular two-point correlation function in narrow redshift slices. revision: yes
-
Referee: [Methods section (narrow redshift slices)] The central claim of achieving minimal a priori dependence on an underlying cosmological model through the use of narrow redshift slices and purely angular 2D measurements is load-bearing for the paper's interpretation. However, the definition of θ_H (via angular correlation function or counts-in-cells) and the random catalog construction still require the survey selection function n(z) and mask, which may embed fiducial cosmology assumptions even in narrow slices. This needs explicit quantification or demonstration that residual dependence is negligible.
Authors: This is a valid concern. Although the narrow slices reduce the dependence significantly by focusing on angular statistics, the random catalogs do use the measured n(z) and the survey mask. In the revised manuscript, we will add a dedicated subsection demonstrating the robustness: we will generate random catalogs with perturbed fiducial cosmologies (varying Ω_m by ±10%) and show that the shifts in θ_H are smaller than the measurement uncertainties, thereby quantifying that the residual dependence is negligible. revision: yes
Circularity Check
No circularity: direct data-to-mock comparison with external benchmarks
full rationale
The paper measures θ_H via angular two-point statistics in narrow redshift slices chosen explicitly to reduce model dependence, then compares the resulting scale values directly to independent ΛCDM mock catalogs and to prior eBOSS measurements. No equation or definition in the provided text reduces a claimed result to a fitted parameter or self-citation by construction; the consistency statements rest on external catalogs whose generation is outside the present analysis pipeline.
Axiom & Free-Parameter Ledger
Reference graph
Works this paper leans on
-
[1]
S. Perlmutteret al.(Supernova Cosmology Project), Measurements of Ω and Λ from 42 High Redshift Supernovae, Astro- phys. J.517, 565 (1999), arXiv:astro-ph/9812133
Pith/arXiv arXiv 1999
-
[2]
A. G. Riesset al.(Supernova Search Team), Observational evidence from supernovae for an accelerating universe and a cosmological constant, Astron. J.116, 1009 (1998), arXiv:astro-ph/9805201
Pith/arXiv arXiv 1998
-
[3]
Akramiet al.(Planck), Planck 2018 results
Y. Akramiet al.(Planck), Planck 2018 results. IV. Diffuse component separation, Astron. Astrophys.641, A4 (2020), arXiv:1807.06208 [astro-ph.CO]
arXiv 2018
-
[4]
Broutet al., The Pantheon+ Analysis: Cosmological Constraints, Astrophys
D. Broutet al., The Pantheon+ Analysis: Cosmological Constraints, Astrophys. J.938, 110 (2022), arXiv:2202.04077 [astro-ph.CO]
Pith/arXiv arXiv 2022
-
[5]
D. Rubinet al., Union Through UNITY: Cosmology with 2,000 SNe Using a Unified Bayesian Framework (2023), arXiv:2311.12098 [astro-ph.CO]
Pith/arXiv arXiv 2023
-
[6]
T. M. C. Abbottet al.(DES), The Dark Energy Survey: Cosmology Results with∼1500 New High-redshift Type Ia Supernovae Using the Full 5 yr Data Set, Astrophys. J. Lett.973, L14 (2024), arXiv:2401.02929 [astro-ph.CO]
Pith/arXiv arXiv 2024
-
[7]
E. Di Valentino, O. Mena, S. Pan, L. Visinelli, W. Yang, A. Melchiorri, D. F. Mota, A. G. Riess, and J. Silk, In the realm of the Hubble tension—a review of solutions, Class. Quant. Grav.38, 153001 (2021), arXiv:2103.01183 [astro-ph.CO]
Pith/arXiv arXiv 2021
-
[8]
P. Shah, P. Lemos, and O. Lahav, A buyer’s guide to the Hubble constant, Astron. Astrophys. Rev.29, 9 (2021), arXiv:2109.01161 [astro-ph.CO]
arXiv 2021
-
[9]
A. G. Riesset al., A Comprehensive Measurement of the Local Value of the Hubble Constant with 1 km s −1 Mpc−1 Uncertainty from the Hubble Space Telescope and the SH0ES Team, Astrophys. J. Lett.934, L7 (2022), arXiv:2112.04510 [astro-ph.CO]
Pith/arXiv arXiv 2022
-
[10]
D. W. Hogg, D. J. Eisenstein, M. R. Blanton, N. A. Bahcall, J. Brinkmann, J. E. Gunn, and D. P. Schneider, Cosmic homogeneity demonstrated with luminous red galaxies, Astrophys. J.624, 54 (2005), arXiv:astro-ph/0411197
Pith/arXiv arXiv 2005
-
[11]
P. Sarkar, J. Yadav, B. Pandey, and S. Bharadwaj, The scale of homogeneity of the galaxy distribution in SDSS DR6, Mon. Not. Roy. Astron. Soc.399, L128 (2009), arXiv:0906.3431 [astro-ph.CO]
Pith/arXiv arXiv 2009
-
[12]
M. Scrimgeouret al., The WiggleZ Dark Energy Survey: the transition to large-scale cosmic homogeneity, Mon. Not. Roy. Astron. Soc.425, 116 (2012), arXiv:1205.6812 [astro-ph.CO]
Pith/arXiv arXiv 2012
-
[13]
Pandey, A method for testing the cosmic homogeneity with Shannon entropy, Mon
B. Pandey, A method for testing the cosmic homogeneity with Shannon entropy, Mon. Not. Roy. Astron. Soc.430, 3376 (2013), arXiv:1301.4961 [astro-ph.CO]
Pith/arXiv arXiv 2013
-
[14]
B. Pandey and S. Sarkar, Testing homogeneity in the Sloan Digital Sky Survey Data Release Twelve with Shannon entropy, Mon. Not. Roy. Astron. Soc.454, 2647 (2015), arXiv:1507.03124 [astro-ph.CO]
Pith/arXiv arXiv 2015
-
[15]
P. Laurentet al., A 14h −3 Gpc3 study of cosmic homogeneity using BOSS DR12 quasar sample, JCAP11, 060, arXiv:1602.09010 [astro-ph.CO]
-
[16]
S. Sarkar and B. Pandey, An information theory based search for homogeneity on the largest accessible scale, Mon. Not. Roy. Astron. Soc.463, L12 (2016), arXiv:1607.06194 [astro-ph.CO]
Pith/arXiv arXiv 2016
-
[17]
P. Nteliset al., Exploring cosmic homogeneity with the BOSS DR12 galaxy sample, JCAP06, 019, arXiv:1702.02159 [astro-ph.CO]
-
[18]
R. S. Gon¸ calves, G. C. Carvalho, C. A. P. Bengaly, J. C. Carvalho, and J. S. Alcaniz, Measuring the scale of cosmic homogeneity with SDSS-IV DR14 quasars, Mon. Not. Roy. Astron. Soc.481, 5270 (2018), arXiv:1809.11125 [astro-ph.CO]
arXiv 2018
-
[19]
R. S. Gon¸ calves, G. C. Carvalho, U. Andrade, C. A. P. Bengaly, J. C. Carvalho, and J. Alcaniz, Measuring the cosmic homogeneity scale with SDSS-IV DR16 Quasars, JCAP03, 029, arXiv:2010.06635 [astro-ph.CO]
arXiv 2010
- [20]
- [21]
-
[22]
J. K. Yadav, J. S. Bagla, and N. Khandai, Fractal Dimension as a measure of the scale of Homogeneity, Mon. Not. Roy. Astron. Soc.405, 2009 (2010), arXiv:1001.0617 [astro-ph.CO]
Pith/arXiv arXiv 2009
-
[23]
P. Zhang and A. Stebbins, Confirmation of the Copernican Principle at Gpc Radial Scale and above from the Kinetic Sunyaev Zel’dovich Effect Power Spectrum, Phys. Rev. Lett.107, 041301 (2011), arXiv:1009.3967 [astro-ph.CO]
Pith/arXiv arXiv 2011
-
[24]
W. Valkenburg, V. Marra, and C. Clarkson, Testing the Copernican principle by constraining spatial homogeneity, Mon. Not. Roy. Astron. Soc.438, L6 (2014), arXiv:1209.4078 [astro-ph.CO]
Pith/arXiv arXiv 2014
-
[25]
B. Hoyle, R. Tojeiro, R. Jimenez, A. Heavens, C. Clarkson, and R. Maartens, Testing homogeneity with galaxy star formation history, Astrophys. J. Lett.762, L9 (2013), arXiv:1209.6181 [astro-ph.CO]
Pith/arXiv arXiv 2013
-
[26]
Kraljic, Characterizing cosmic inhomogeneity with anomalous diffusion, Mon
D. Kraljic, Characterizing cosmic inhomogeneity with anomalous diffusion, Mon. Not. Roy. Astron. Soc.451, 3393 (2015), arXiv:1410.4107 [astro-ph.CO]
Pith/arXiv arXiv 2015
-
[27]
R. Jimenez, R. Maartens, A. R. Khalifeh, R. R. Caldwell, A. F. Heavens, and L. Verde, Measuring the Homogeneity of the Universe Using Polarization Drift, JCAP05, 048, arXiv:1902.11298 [astro-ph.CO]
Pith/arXiv arXiv 1902
-
[28]
D. Camarena, V. Marra, Z. Sakr, and C. Clarkson, The Copernican principle in light of the latest cosmological data, Mon. Not. Roy. Astron. Soc.509, 1291 (2021), arXiv:2107.02296 [astro-ph.CO]
arXiv 2021
-
[29]
D. Alonso, A. Bueno belloso, F. J. S´ anchez, J. Garc´ ıa-Bellido, and E. S´ anchez, Measuring the transition to homogeneity with photometric redshift surveys, Mon. Not. Roy. Astron. Soc.440, 10 (2014), arXiv:1312.0861 [astro-ph.CO]
Pith/arXiv arXiv 2014
-
[30]
D. Alonso, A. I. Salvador, F. J. S´ anchez, M. Bilicki, J. Garc´ ıa-Bellido, and E. S´ anchez, Homogeneity and isotropy in the Two Micron All Sky Survey Photometric Redshift catalogue, Mon. Not. Roy. Astron. Soc.449, 670 (2015), arXiv:1412.5151 24 [astro-ph.CO]
Pith/arXiv arXiv 2015
-
[31]
R. S. Gon¸ calves, G. C. Carvalho, C. A. P. Bengaly, J. C. Carvalho, A. Bernui, J. S. Alcaniz, and R. Maartens, Cos- mic homogeneity: a spectroscopic and model-independent measurement, Mon. Not. Roy. Astron. Soc.475, L20 (2018), arXiv:1710.02496 [astro-ph.CO]
Pith/arXiv arXiv 2018
-
[32]
F. Avila, C. P. Novaes, A. Bernui, E. de Carvalho, and J. P. Nogueira-Cavalcante, The angular scale of homogeneity in the Local Universe with the SDSS blue galaxies, Mon. Not. Roy. Astron. Soc.488, 1481 (2019), arXiv:1906.10744 [astro-ph.CO]
Pith/arXiv arXiv 2019
-
[33]
B. Camacho-Quevedo and E. Gazta˜ naga, A measurement of the scale of homogeneity in the early Universe, JCAP04(04), 044, arXiv:2106.14303 [astro-ph.CO]
-
[34]
U. Andrade, R. S. Gon¸ calves, G. C. Carvalho, C. A. P. Bengaly, J. C. Carvalho, and J. Alcaniz, The angular scale of homogeneity with SDSS-IV DR16 luminous red galaxies, JCAP10, 088, arXiv:2205.07819 [astro-ph.CO]
-
[35]
X. Shao, C. A. P. Bengaly, R. S. Gon¸ calves, G. C. Carvalho, and J. Alcaniz, Cosmological constraints from angular homogeneity scale measurements, Eur. Phys. J. C85, 225 (2025), arXiv:2409.06009 [astro-ph.CO]
arXiv 2025
-
[36]
Abdul Karimet al.(DESI), Data Release 1 of the Dark Energy Spectroscopic Instrument, Astron
M. Abdul Karimet al.(DESI), Data Release 1 of the Dark Energy Spectroscopic Instrument, Astron. J.171, 285 (2026), arXiv:2503.14745 [astro-ph.CO]
Pith/arXiv arXiv 2026
-
[37]
D. W. Hogget al., The Overdensities of Galaxy Environments as a Function of Luminosity and Color, The Astrophysical Journal Letters585, L5 (2003), arXiv:astro-ph/0212085 [astro-ph]
Pith/arXiv arXiv 2003
-
[38]
D. J. Eisensteinet al., Spectroscopic Target Selection for the Sloan Digital Sky Survey: The Luminous Red Galaxy Sample, The Astronomical Journal122, 2267 (2001), arXiv:astro-ph/0108153 [astro-ph]
Pith/arXiv arXiv 2001
-
[39]
I. Zehaviet al., The Luminosity and Color Dependence of the Galaxy Correlation Function, The Astrophysical Journal 630, 1 (2005), arXiv:astro-ph/0408569 [astro-ph]
Pith/arXiv arXiv 2005
-
[40]
A. G. Adameet al.(DESI), DESI 2024 II: sample definitions, characteristics, and two-point clustering statistics, JCAP 07, 017, arXiv:2411.12020 [astro-ph.CO]
arXiv 2024
-
[41]
A. J. Rosset al.(eBOSS), The Completed SDSS-IV extended Baryon Oscillation Spectroscopic Survey: Large-scale structure catalogues for cosmological analysis, Mon. Not. Roy. Astron. Soc.498, 2354 (2020), arXiv:2007.09000 [astro- ph.CO]
arXiv 2020
-
[42]
C. Zhaoet al.(eBOSS), The completed SDSS-IV extended Baryon Oscillation Spectroscopic Survey: 1000 multi-tracer mock catalogues with redshift evolution and systematics for galaxies and quasars of the final data release, Mon. Not. Roy. Astron. Soc.503, 1149 (2021), arXiv:2007.08997 [astro-ph.CO]
arXiv 2021
-
[43]
E. Fern´ andez-Garc´ ıaet al., DESI DR2 reference mocks: clustering results from Uchuu-BGS and LRG, JCAP05, 002, arXiv:2507.01593 [astro-ph.GA]
-
[44]
H. A. Feldman, N. Kaiser, and J. A. Peacock, Power spectrum analysis of three-dimensional redshift surveys, Astrophys. J.426, 23 (1994), arXiv:astro-ph/9304022
Pith/arXiv arXiv 1994
-
[45]
S. D. Landy and A. S. Szalay, Bias and variance of angular correlation functions, Astrophys. J.412, 64 (1993)
1993
-
[46]
M. Jarvis, G. Bernstein, and B. Jain, The skewness of the aperture mass statistic, Mon. Not. Roy. Astron. Soc.352, 338 (2004), arXiv:astro-ph/0307393
Pith/arXiv arXiv 2004
-
[47]
Aghanimet al.(Planck), Planck 2018 results
N. Aghanimet al.(Planck), Planck 2018 results. VI. Cosmological parameters, Astron. Astrophys.641, A6 (2020), [Erra- tum: Astron.Astrophys. 652, C4 (2021)], arXiv:1807.06209 [astro-ph.CO]
Pith/arXiv arXiv 2018
discussion (0)
Sign in with ORCID, Apple, or X to comment. Anyone can read and Pith papers without signing in.