REVIEW 2 major objections 1 minor 30 references
Integrating Deep Learning Demand Forecasting with Multi-Objective Optimization for Circular Coffee Supply Chains: A Data-Driven Framework for Cost, Emissions, and Freshness Management
T0 review · 2 major / 1 minor · reviewed 2026-06-27 · grok-4.3
Pith's one-line read A CNN-LSTM model forecasts coffee demand and supplies inputs to a tri-objective MILP that jointly minimizes cost and emissions while maximizing freshness in circular supply chains.
desk verdict The paper links CNN-LSTM point forecasts to a standard tri-objective MILP for a closed-loop coffee chain with circular recovery and exponential freshness, but treats the forecasts as fixed inputs without checking error propagation into the Pareto set. read the letter →
The pith
A machine-rendered reading of the paper's core claim, the machinery that carries it, and where it could break.
The reading
What carries the argument
The two-phase integrated framework that couples a hybrid CNN-LSTM demand forecaster with a tri-objective mixed-integer linear program minimizing cost and emissions while maximizing freshness via exponential inventory decay.
What would settle it
Replace the CNN-LSTM point forecasts with the actual realized demands from the same test period and re-solve the MILP to check whether the new Pareto set differs by more than a few percent in the reported cost-emission trade-off or freshness values.
Extended reading notes
Core claim
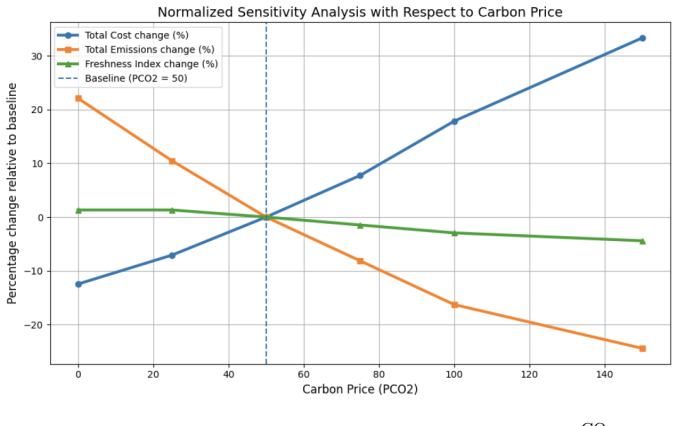
The forecasted demands produced by the CNN-LSTM are inserted into a tri-objective MILP solved by the epsilon-constraint method to yield 25 Pareto-optimal solutions; policy and sensitivity analyses on these solutions establish that balanced sustainability weightings reduce emissions by 22.4 percent relative to the cost-minimizing solution while increasing cost by only 9.9 percent and maintaining freshness close to its individual optimum.
Load-bearing premise
The demand forecasts produced by the CNN-LSTM are accurate enough to serve as fixed inputs to the MILP without forecast error materially altering the shape or location of the Pareto front.
Editorial extensions
If this is right
- The CNN-LSTM attains an MAE of 22.87 and R-squared of 0.90 on chronologically split data, exceeding the strongest deep-learning benchmark by roughly 12 percent and classical methods by more than 30 percent.
- Twenty-five distinct Pareto solutions are generated by the epsilon-constraint method on the tri-objective model.
- A policy that balances the three objectives produces a 22.4 percent emission cut at a 9.9 percent cost penalty while keeping freshness near its best attainable value.
- The closed-loop network explicitly incorporates circular recovery routes whose activation affects the three objectives in the MILP.
Reading between the lines
- The same forecasting-plus-optimization structure could be tested on other perishable products whose freshness decays exponentially with age.
- If forecast error bands were propagated through the MILP as interval inputs, the resulting robust Pareto set might reveal larger cost penalties than the deterministic case.
- The framework treats demand as deterministic once forecasted; relaxing this to a stochastic or rolling-horizon version would test whether the reported trade-offs remain stable under demand variability.
Editorial analysis
A structured set of objections, weighed in public.
Referee Report
Summary. The paper presents a two-phase framework for circular coffee supply chains. Phase 1 uses a hybrid CNN-LSTM model for demand forecasting on the public Coffee Chain Sales dataset (70/15/15 chronological split), reporting MAE 22.87 and R² 0.90 that outperform benchmarks. Phase 2 feeds these point forecasts as deterministic inputs into a tri-objective MILP (min cost, min emissions, max freshness via exponential decay) solved via epsilon-constraint to generate 25 Pareto solutions in a multi-period, multimodal, closed-loop network; sensitivity analyses claim a balanced policy yields 22.4% emission reduction at 9.9% cost increase with near-optimal freshness.
Significance. If the integration is robust, the work demonstrates a concrete data-driven pipeline linking deep-learning forecasts to multi-objective circular-economy optimization, producing actionable Pareto trade-offs for an agri-food chain. The reported metrics and policy numbers would be useful for practitioners if forecast-error effects are shown to be negligible.
major comments (2)
- [Abstract / MILP phase] Abstract (second-phase description) and § on MILP: the central policy claims (22.4 % emission cut, 9.9 % cost rise) rest on feeding CNN-LSTM point forecasts (MAE 22.87) as fixed deterministic demand vectors into the epsilon-constraint MILP; no sensitivity sweep, resampling within the forecast-error band, or stochastic/robust counterpart is performed, so it is unclear whether the reported Pareto front remains stable under realistic demand perturbations.
- [Methods sections] The manuscript provides neither the full CNN-LSTM architecture and hyper-parameter values nor the complete MILP formulation (decision variables, constraints, objective functions, and exponential-decay freshness term), preventing verification that the tri-objective model and its 25-point Pareto sets are correctly implemented.
minor comments (1)
- [Abstract] The abstract should explicitly name the public dataset and state the exact train/validation/test split dates to allow direct replication of the forecasting benchmark.
Simulated Author's Rebuttal
We thank the referee for the constructive comments, which highlight important aspects of robustness and reproducibility. We address each major comment below and will incorporate revisions to strengthen the manuscript.
read point-by-point responses
-
Referee: [Abstract / MILP phase] Abstract (second-phase description) and § on MILP: the central policy claims (22.4 % emission cut, 9.9 % cost rise) rest on feeding CNN-LSTM point forecasts (MAE 22.87) as fixed deterministic demand vectors into the epsilon-constraint MILP; no sensitivity sweep, resampling within the forecast-error band, or stochastic/robust counterpart is performed, so it is unclear whether the reported Pareto front remains stable under realistic demand perturbations.
Authors: We agree that the reported policy metrics are derived from deterministic point forecasts without explicit sensitivity testing against demand perturbations within the observed forecast error. Although the CNN-LSTM achieves MAE 22.87 and R² 0.90 on the held-out test set, and the MILP is solved on these forecasts, the absence of a robustness check is a limitation for practical claims. In the revised manuscript we will add a sensitivity analysis that perturbs demand inputs by ±MAE (and by sampled error bands) and re-solves the epsilon-constraint model to quantify changes in the Pareto front and the 22.4 % / 9.9 % policy point. revision: yes
-
Referee: [Methods sections] The manuscript provides neither the full CNN-LSTM architecture and hyper-parameter values nor the complete MILP formulation (decision variables, constraints, objective functions, and exponential-decay freshness term), preventing verification that the tri-objective model and its 25-point Pareto sets are correctly implemented.
Authors: We acknowledge the omission of complete specifications. The revised manuscript will include the full CNN-LSTM architecture (layer configuration, kernel sizes, LSTM units, dropout, optimizer, and training hyperparameters) together with the complete MILP formulation: all decision variables, the three objective functions, every constraint, and the explicit exponential-decay freshness term. These details will be placed in a dedicated appendix to enable full reproducibility while preserving readability of the main text. revision: yes
Circularity Check
No circularity; forecasting externally validated on public data and optimization uses standard methods
full rationale
The paper trains a CNN-LSTM on the public Coffee Chain Sales dataset (70/15/15 chronological split) and reports independent performance metrics (MAE 22.87, R^2 0.90) against external benchmarks. These point forecasts are then supplied as fixed deterministic inputs to a tri-objective MILP solved by the standard epsilon-constraint method to produce 25 Pareto solutions. The reported outcomes (22.4% emissions reduction at 9.9% cost increase) are computed results of the optimization model rather than quantities that reduce by construction to the forecast parameters or to any self-citation. No self-definitional, fitted-input-called-prediction, or load-bearing self-citation steps are present; the chain remains self-contained against external benchmarks.
Assumptions & free parameters
free parameters (2)
- epsilon values
- exponential decay rate
assumptions (2)
- domain assumption Exponential decay based on inventory age accurately represents product freshness loss.
- domain assumption The multi-period multimodal closed-loop structure with circular recovery can be represented by linear constraints in MILP.
Cite this review
Pith. "Pith review of Integrating Deep Learning Demand Forecasting with Multi-Objective Optimization for Circular Coffee Supply Chains: A Data-Driven Framework for Cost, Emissions, and Freshness Management." pith.science (2026). https://pith.science/paper/ONAJGNUB
@misc{pith2026260608314,
  author       = {Pith},
  title        = {Pith review of: Integrating Deep Learning Demand Forecasting with Multi-Objective Optimization for Circular Coffee Supply Chains: A Data-Driven Framework for Cost, Emissions, and Freshness Management},
  year         = {2026},
  howpublished = {\url{https://pith.science/paper/ONAJGNUB}},
  note         = {Machine review of arXiv:2606.08314}
}
read the original abstract
The coffee supply chain is one of the most complex agri-food networks, marked by geographically dispersed production, multi-tier coordination, and high sensitivity to quality and freshness. While sustainability and digitalization have gained attention, demand forecasting, optimization, and traceability are often treated separately. This study presents a two-phase integrated framework. First, a hybrid CNN-LSTM model is used for demand forecasting. On the public Coffee Chain Sales dataset with chronological 70/15/15 splitting, the model achieves MAE of 22.87 and R^2 of 0.90, outperforming the best deep learning benchmark by ~12% and classical methods by over 30%. In the second phase, the forecasted demand feeds a tri-objective mixed-integer linear programming (MILP) model that jointly minimizes cost, minimizes carbon emissions, and maximizes product freshness in a multi-period, multimodal, closed-loop supply chain with circular recovery. Freshness is modeled via exponential decay based on inventory age. Using the epsilon-constraint method, 25 Pareto solutions are obtained. Sensitivity and policy analyses show that balanced sustainability policies can reduce emissions by 22.4% with only a 9.9% cost increase while maintaining near-optimal freshness. Keywords: Coffee supply chain; Deep learning; Demand forecasting; Multi-objective optimization; Circular economy; CNN-LSTM; Mixed-integer linear programming.
Figures


Figures from the paper (14 more)




Reference graph
Works this paper leans on
-
[1]
Designing sustainability mea- surement of a Thai coffee supply chain using axiomatic design,
Y. Kittichotsatsawat, E. Rauch, and K. Y. Tippayawong, “Designing sustainability mea- surement of a Thai coffee supply chain using axiomatic design,”Results in Engineering, vol. 24, 103443, 2024. 23
2024
-
[2]
Shaping the future of coffee value chain: Governance and supply chain finance in West Java’s specialty coffee,
A. Abdullah, A. Satria, H. Mulyati, Y. Arkeman, and D. Indrawan, “Shaping the future of coffee value chain: Governance and supply chain finance in West Java’s specialty coffee,” SSRN working paper 4984706, 2025
2025
-
[3]
Blockchain technology to improve traceability in the cof- fee supply chain: A systematic literature review,
C. Gómez and B. Garbinato, “Blockchain technology to improve traceability in the cof- fee supply chain: A systematic literature review,”International Journal of Information Management Data Insights, vol. 5, 100359, 2025
2025
-
[4]
Blockchain-enabled traceability in African coffee value chains,
M. S. Rahman, M. A. Islam, and M. K. Hossain, “Blockchain-enabled traceability in African coffee value chains,”Journal of Cleaner Production, vol. 438, 140752, 2025
2025
-
[5]
Optimization- based model of a circular supply chain for coffee waste,
H. Zohourfazeli, A. Sabaghpourfard, A. Chaabane, and A. Jabbarzadeh, “Optimization- based model of a circular supply chain for coffee waste,”Supply Chain Analytics, 100126, 2025
2025
-
[6]
Towards a comprehensive model of a bio- fuel supply chain optimization from coffee crop residues,
M. M. M. Chávez, W. Sarache, and Y. Costa, “Towards a comprehensive model of a bio- fuel supply chain optimization from coffee crop residues,”Transportation Research Part E, vol. 116, pp. 136–162, 2018
2018
-
[7]
Multi-period production plan- ning in Colombian coffee supply chains under demand uncertainty,
N. Clavijo-Buritica, L. Triana-Sánchez, and J. W. Escobar, “Multi-period production plan- ning in Colombian coffee supply chains under demand uncertainty,”Computers & Industrial Engineering, vol. 168, 108103, 2022
2022
-
[8]
Asystematicreviewofthecoffeesupplychain: Sustainability, technology and operational perspectives,
F.DeFeliceetal., “Asystematicreviewofthecoffeesupplychain: Sustainability, technology and operational perspectives,”(systematic review), 2025
2025
Show all 30 references
-
[9]
Applications of machine learning for decision support in biomass supply chains: A systematic review,
S. Razmi, H. Mirzaee, G. Kumar, and T. Sowlati, “Applications of machine learning for decision support in biomass supply chains: A systematic review,”Computers & Chemical Engineering, 109451, 2025
2025
-
[10]
An information- sharing and cost-aware custom-loss machine learning framework for 3PL supply chain fore- casting,
M. Gabellini, F. Calabrese, F. G. Galizia, M. Ronchi, and A. Regattieri, “An information- sharing and cost-aware custom-loss machine learning framework for 3PL supply chain fore- casting,”Computers & Industrial Engineering, 111573, 2025
2025
-
[11]
A novel multi-phase hierarchical forecasting approach with machine learning in supply chain management,
S. Taghiyeh, D. C. Lengacher, A. H. Sadeghi, A. Sahebi-Fakhrabad, and R. B. Handfield, “A novel multi-phase hierarchical forecasting approach with machine learning in supply chain management,”Supply Chain Analytics, vol. 3, 100032, 2023
2023
-
[12]
A CNN–LSTM model for gold price time-series forecasting,
I. E. Livieris, E. Pintelas, and P. Pintelas, “A CNN–LSTM model for gold price time-series forecasting,”Neural Computing and Applications, vol. 32, pp. 17351–17360, 2020
2020
-
[13]
Integrated cold chain planning for fresh food distribution with temperature-dependent quality decay,
W. Yu, X. Chen, and H. Li, “Integrated cold chain planning for fresh food distribution with temperature-dependent quality decay,”Computers & Industrial Engineering, vol. 187, 109834, 2024
2024
-
[14]
Time-sensitive routing for fresh food distribution with quality degradation,
Y. Yuan, L. Wang, and H. Chen, “Time-sensitive routing for fresh food distribution with quality degradation,”Transportation Research Part E, vol. 183, 103428, 2024
2024
-
[15]
Freshness-keepingeffortsandvalue-addedservice choice in fresh food supply chains,
R.Zhang, Z.Huang, B.Liu, andJ.Wang, “Freshness-keepingeffortsandvalue-addedservice choice in fresh food supply chains,”Computers & Industrial Engineering, vol. 190, 110063, 2024
2024
-
[16]
IoT-enabled visibility in cold chain logistics for perishable products,
A. Sreenivasan and M. Suresh, “IoT-enabled visibility in cold chain logistics for perishable products,”International Journal of Production Economics, vol. 268, 109112, 2024
2024
-
[17]
Dynamic optimization of e-commerce supply chains for fresh products with blockchain and reference effect,
X. Liu, Y. He, G. H. Pakdel, and S. Li, “Dynamic optimization of e-commerce supply chains for fresh products with blockchain and reference effect,”Technological Forecasting and Social Change, vol. 214, 124040, 2025. 24
2025
-
[18]
Application of artificial intelligence in digital twin models for stormwater infrastructure systems in smart cities,
A. Gholizadeh Lonbar, A. Sharifi, A. T. Beris, A. S. Javidi, M. Nouri, and M. Ahmadi, “Application of artificial intelligence in digital twin models for stormwater infrastructure systems in smart cities,”Advanced Engineering Informatics, 2024
2024
-
[19]
Intelligent energy management with IoT framework in smart cities using intelligent analysis,
M. Nikpour, P. B. Yousefi, H. Jafarzadeh, K. Danesh, R. Shomali, S. Asadi, and A. Gholizadeh Lonbar, “Intelligent energy management with IoT framework in smart cities using intelligent analysis,”Journal of Network and Computer Applications, 2025
2025
-
[20]
PINN-DT: Optimizing energy consumption in smart buildings using hybrid physics-informed neural networks and a digital-twin framework with blockchain security,
H. Kazemi Naeini, R. Shomali, A. Pishahang, H. Hasanzadeh, S. Asadi, and A. Gholizadeh Lonbar, “PINN-DT: Optimizing energy consumption in smart buildings using hybrid physics-informed neural networks and a digital-twin framework with blockchain security,” Sensors, 2025
2025
-
[21]
Applica- tion of the Segment Anything Model for civil-infrastructure defect assessment,
M. Ahmadi, A. Gholizadeh Lonbar, H. Kazemi Naeini, and A. Tarlani Beris, “Applica- tion of the Segment Anything Model for civil-infrastructure defect assessment,”Innovative Infrastructure Solutions, 2025
2025
-
[22]
Data analysis of decision support for sustainable welfare in the presence of GDP threshold effects,
A. Gholizadeh Lonbar, F. Asgari, S. G. A. Ghoreishi, M. Khajavi, A. Foozoni, and A. Ala, “Data analysis of decision support for sustainable welfare in the presence of GDP threshold effects,” arXiv preprint, 2024
2024
-
[23]
Enhancing flood inundation mapping using machine learning for timely decision-making,
P. Nikrou, R. S. Alipour, J. Henry, and S. Cohen, “Enhancing flood inundation mapping using machine learning for timely decision-making,” Authorea preprint, 2025
2025
-
[24]
Predicting synthetic rating-curve adjustment factors with explainable machine learning for enhancing operational flood inundation mapping,
A. Baruah, R. Spies, D. Devi, S. Cohen, F. Aristizabal, P. Nikrou, and D. Tian, “Predicting synthetic rating-curve adjustment factors with explainable machine learning for enhancing operational flood inundation mapping,”Journal of Hydrology, 2025
2025
-
[25]
Transferable flood inundation mapping using deep learning trained on LISFLOOD-FP outputs and synthetic hydrographs,
P. Nikrou, S. Seyvani, and S. Cohen, “Transferable flood inundation mapping using deep learning trained on LISFLOOD-FP outputs and synthetic hydrographs,” AGU Annual Meeting, 2025
2025
-
[26]
Benchmark flood inundation mapping using RGB aerial imagery and a sub-matrix convolutional neural network,
S. Seyvani, D. Munasinghe, P. Nikrou, and S. Cohen, “Benchmark flood inundation mapping using RGB aerial imagery and a sub-matrix convolutional neural network,” AGU Annual Meeting, 2025
2025
-
[27]
A novel algorithm based on a combination of CNN and fully connected neural networks,
S. Seyvani, P. Nikrou, and S. Cohen, “A novel algorithm based on a combination of CNN and fully connected neural networks,” AGU Fall Meeting Abstracts, 2024
2024
-
[28]
A neural-network-based integration of HEC- RAS, LISFLOOD-FP, and OWP-HAND FIM for enhanced flood inundation mapping,
S. Seyvani, P. Nikrou, S. Cohen, and D. Tian, “A neural-network-based integration of HEC- RAS, LISFLOOD-FP, and OWP-HAND FIM for enhanced flood inundation mapping,” AGU Annual Meeting, 2025
2025
-
[29]
Advancements in AI-driven customer service,
M. Esmaeili, M. Ahmadi, M. D. Ismaeil, S. Mirzaei, and J. Canales Verdial, “Advancements in AI-driven customer service,” in2024 IEEE World AI IoT Congress (AIIoT), 2024
2024
-
[30]
A human-centered approach to reframing job satis- faction in the BIM-enabled construction industry,
S. Mirzaei, S. Bunt, and S. M. Bogus, “A human-centered approach to reframing job satis- faction in the BIM-enabled construction industry,” arXiv preprint arXiv:2512.20584, 2025. 25
2025
Reviewed June 27, 2026 · model on record in the stance chip above.
Discussion (0). Continue with ORCID to comment.