Mapping the Landscape of M Dwarf X-ray Flares: New Discoveries in Context
Pith reviewed 2026-06-27 17:44 UTC · model grok-4.3
The pith
M dwarf X-ray flares occur at an average rate of nine per day, implying habitable Earth-like planets lose their atmospheres in 0.5-30 million years.
A machine-rendered reading of the paper's core claim, the machinery that carries it, and where it could break.
Core claim
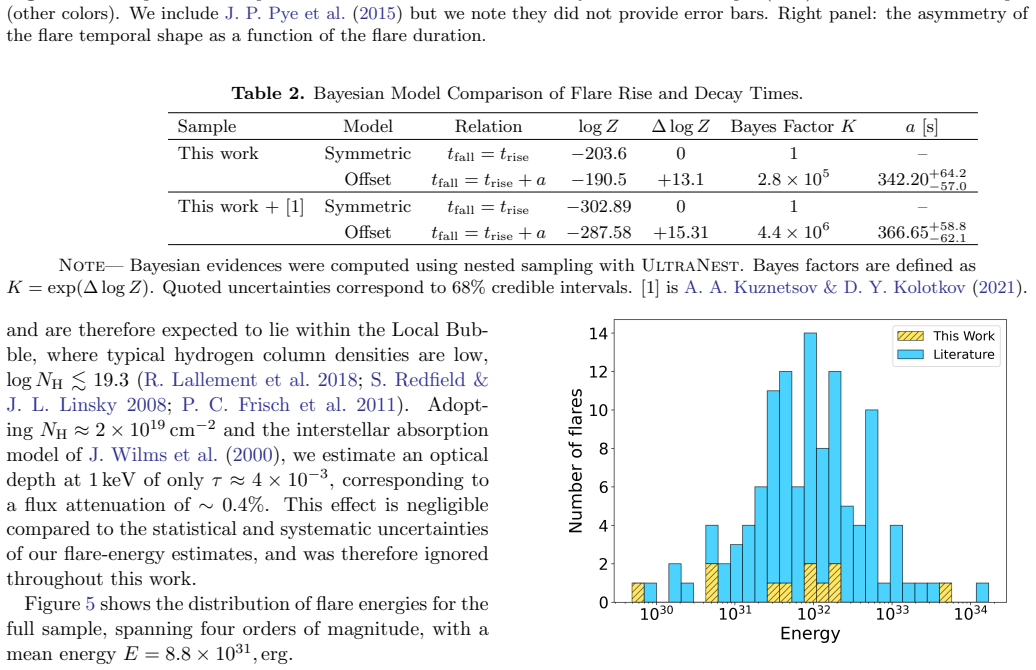
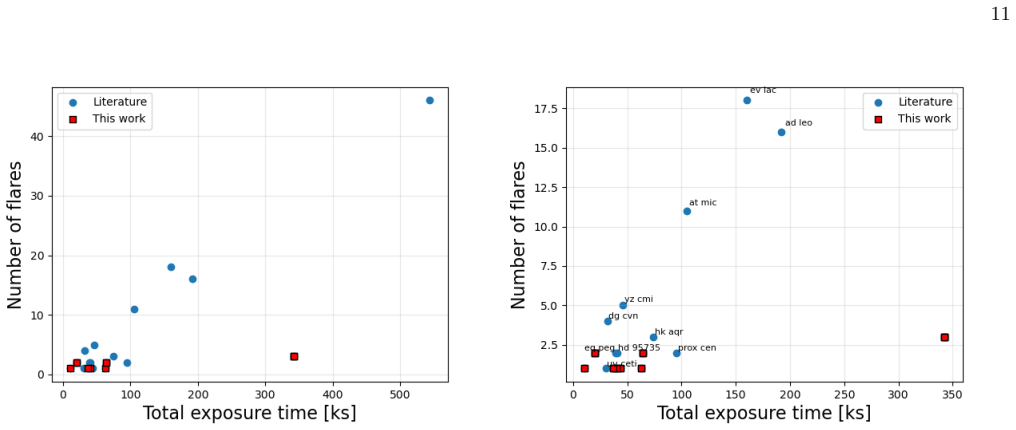
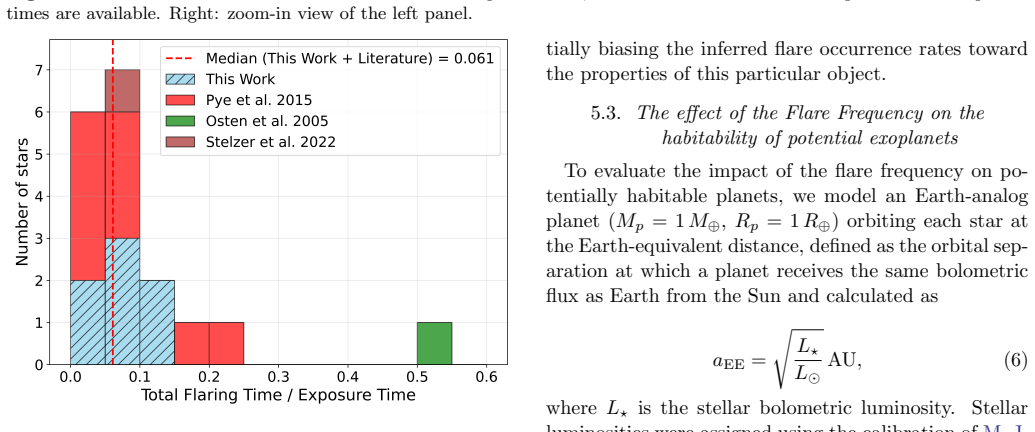
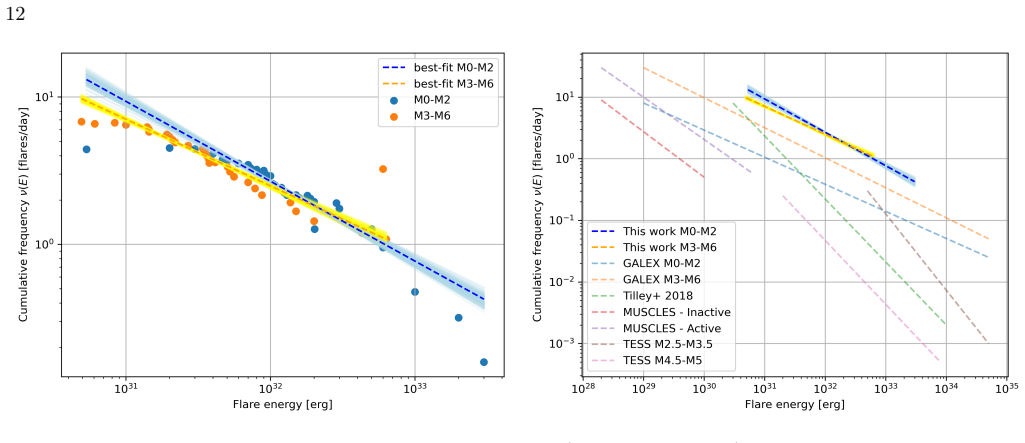
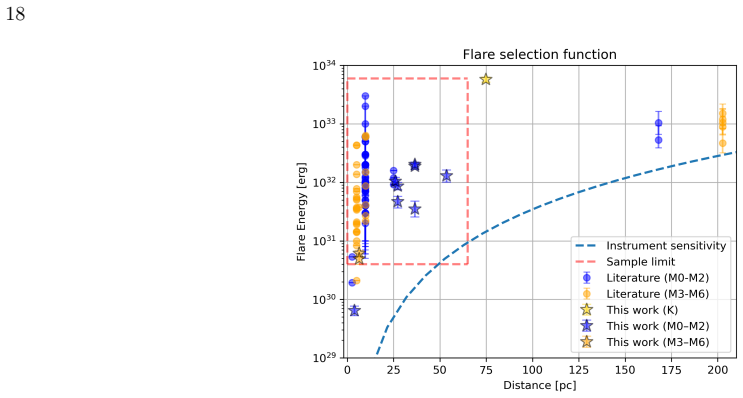
We report 11 new X-ray flares from 7 M dwarfs and compile all reported flares from the 15 known flaring M dwarfs in the literature. This yields an average flare rate of approximately 10^{-1} ks^{-1} (roughly 9 flares per day), with events spanning 10^{29} to 10^{33} erg and displaying a clear strength-duration correlation. Incorporating these flare properties into recent simulations of atmospheric escape produces an upper limit of 0.5-30 Myr for the complete loss of atmospheres on habitable Earth-like planets orbiting these stars.
What carries the argument
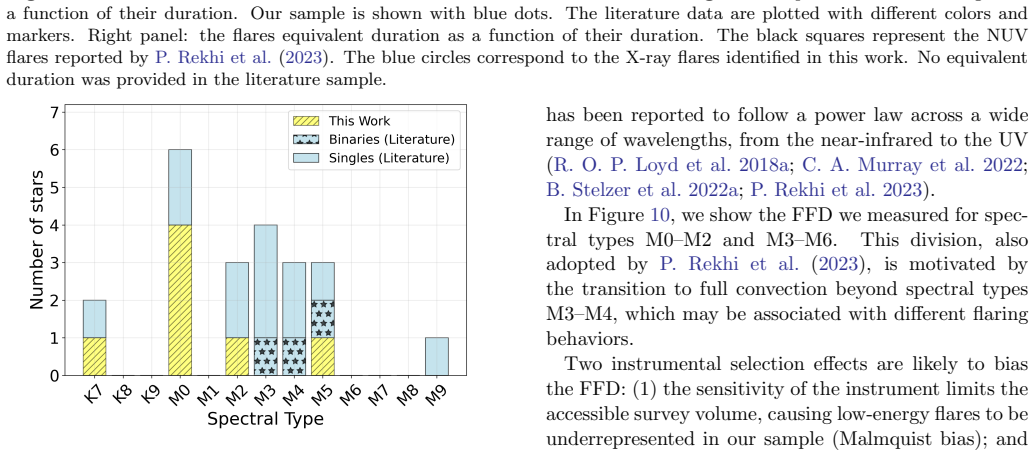
The compiled sample of X-ray flares from 15 M0-M6 stars, integrated with flare-driven atmospheric escape simulations to derive the cumulative erosion timescale.
If this is right
- Flares from M0-M6 stars follow a frequency distribution with average rate near 0.1 per kilosecond.
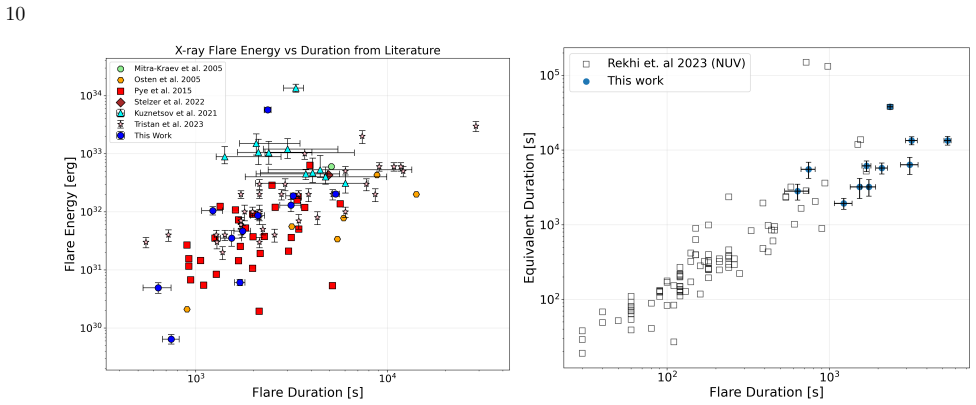
- Flare energy correlates strongly with duration across four orders of magnitude in energy.
- Atmospheric loss timescales for habitable planets fall between 0.5 and 30 million years under the derived flare statistics.
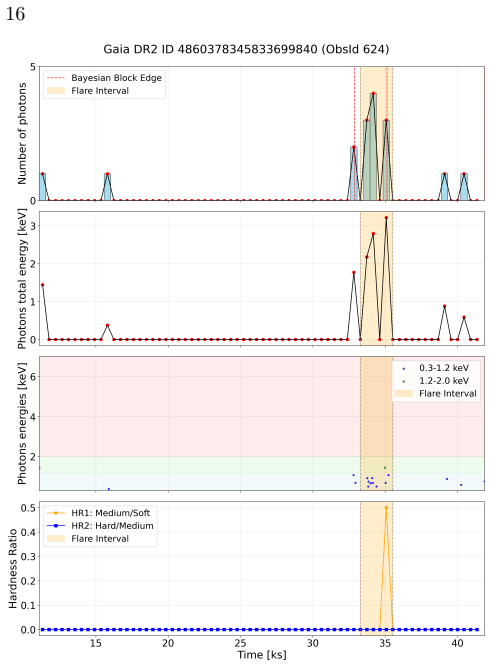
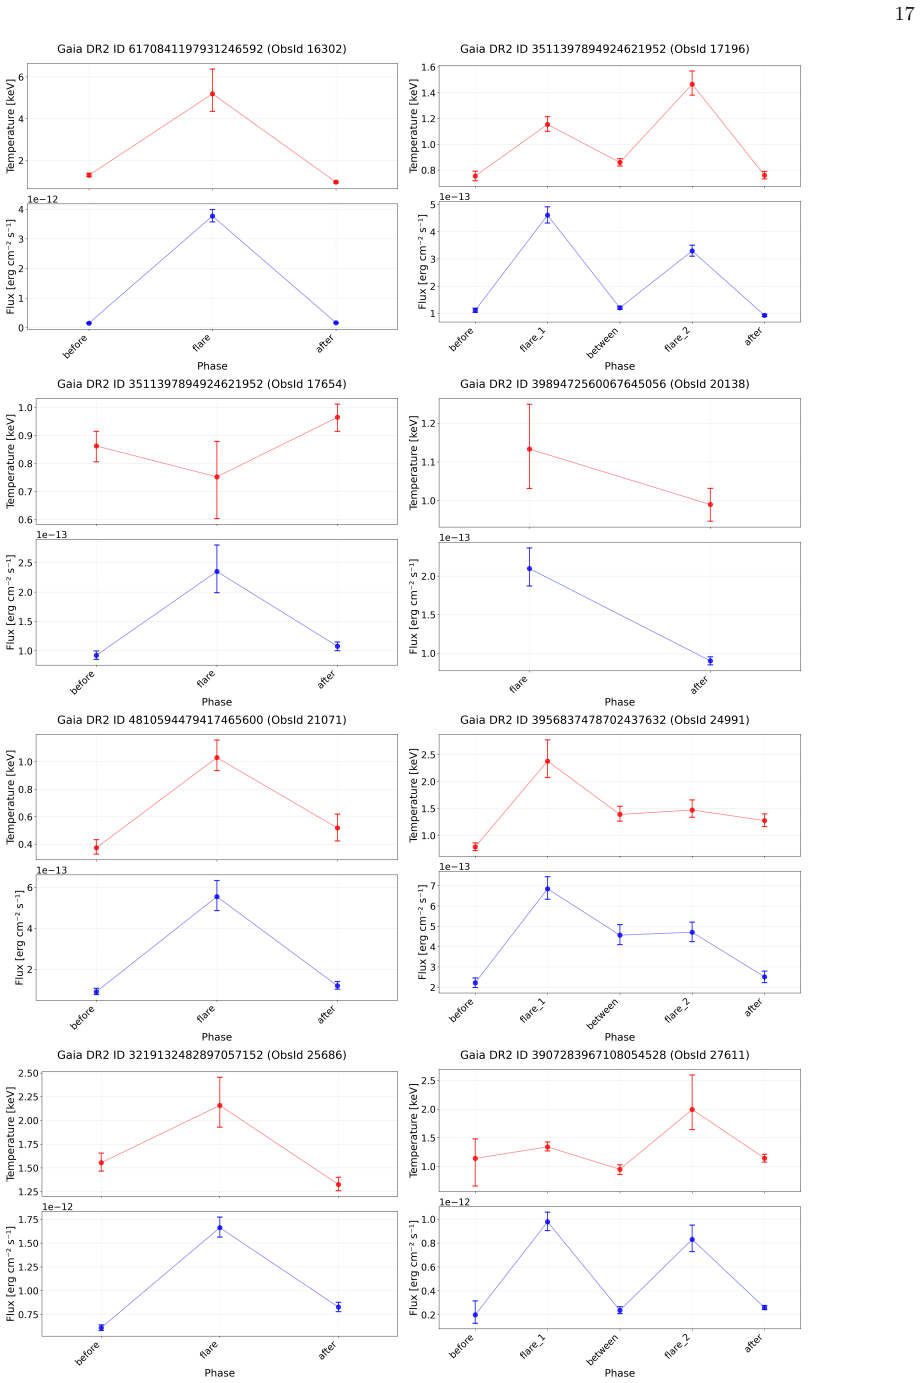
- Temporal asymmetries, flux enhancements, and temperature changes in the flares provide additional constraints on flare physics.
Where Pith is reading between the lines
- Surveys targeting less active M dwarfs may be required to find planets that retain atmospheres long enough for life to develop.
- Extending the flare sample to fainter or more distant M dwarfs could tighten or revise the 0.5-30 Myr bound.
- The same flare statistics could be used to model erosion of non-Earth-like atmospheres with different compositions or magnetic shielding.
Load-bearing premise
The observed flare sample combined with the atmospheric-escape simulations accurately captures the total effect on planets across millions of years.
What would settle it
A direct measurement or refined simulation showing that the integrated X-ray energy from flares at the measured rate does not remove an Earth-like atmosphere within 30 Myr.
Figures
read the original abstract
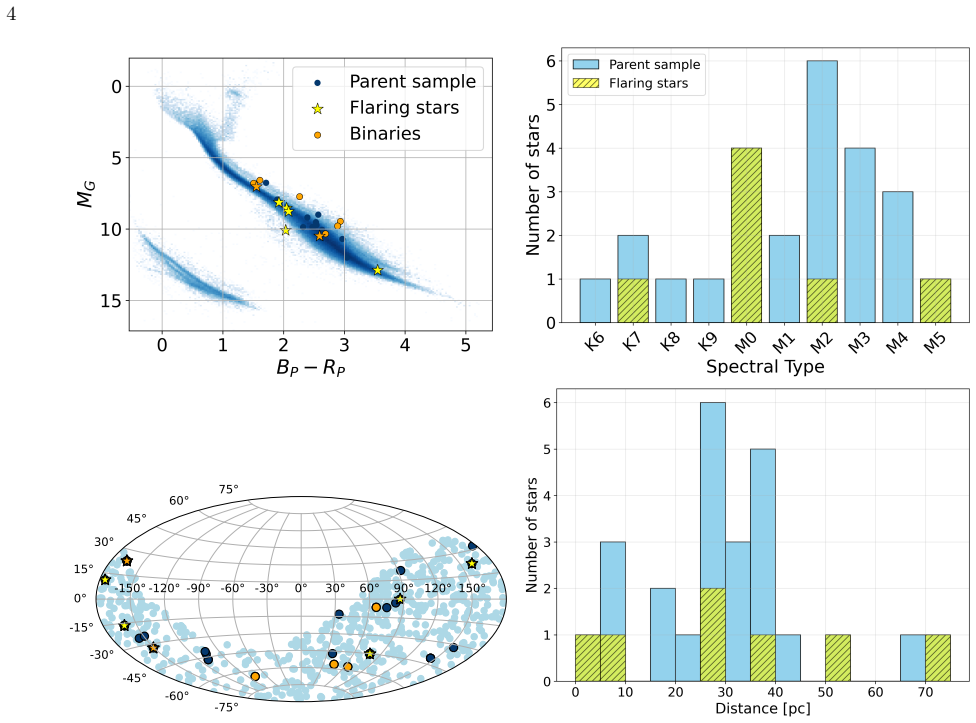
We report the discovery of 11 X-ray flares from 7 M dwarfs previously unknown to exhibit flaring activity, by cross-matching eROSITA observations of bright, nearby M dwarfs with the Chandra telescope archive. To analyze the properties of these flares in a broader context, we compile the sample of all reported X-ray flares from the 15 M dwarfs identified as flaring in the literature. We use this combined sample to derive constraints on the X-ray flare frequency distributions of M0-M6 stars. The average flare occurrence rate we measure is $\sim 10^{-1}\,\rm ks^{-1}$ (corresponding to $\sim 9$ flares per day). The X-ray flares in this sample span energies from $10^{29}\,\rm erg$ to $10^{33}\,\rm erg$ and exhibit a strong correlation between flare strength and duration. The flare properties we characterize include their durations, flux and temperature enhancements, and temporal asymmetries. Using these results and recent simulations of flare-driven atmospheric escape, we derive an upper limit on the time required for habitable Earth-like planets orbiting these M dwarfs to completely lose their atmospheres: 0.5-30 Myr.
Editorial analysis
A structured set of objections, weighed in public.
Referee Report
Summary. The manuscript reports the discovery of 11 new X-ray flares from 7 M dwarfs via cross-matching eROSITA observations with the Chandra archive. It compiles all reported X-ray flares from a total of 15 M0-M6 dwarfs, measures an average occurrence rate of ~10^{-1} ks^{-1} (~9 flares/day), characterizes flare energies (10^{29}-10^{33} erg), durations, flux/temperature enhancements, and temporal asymmetries, and combines these with recent atmospheric-escape simulations to derive an upper limit of 0.5-30 Myr for complete loss of atmospheres on habitable Earth-like planets orbiting such stars.
Significance. If the flare compilation and integration with escape models are robust, the work supplies a useful observational baseline for M-dwarf flare statistics and quantifies a potentially rapid atmospheric-erosion timescale relevant to exoplanet habitability. The new flare detections and the reported energy-duration correlation constitute concrete additions to the literature.
major comments (3)
- [Abstract] Abstract, final paragraph: The 0.5-30 Myr upper limit is stated as following directly from the measured flare rate and 'recent simulations,' yet the text provides no explicit integration steps, no statement of the assumed constant flare rate over 10^6-10^7 yr, and no assessment of whether the 15-star sample remains representative after accounting for stellar evolution or selection biases; this assumption is load-bearing for the numerical bound.
- [Sample compilation and rate derivation] Section describing the compiled sample (likely §2-3): The occurrence rate ~10^{-1} ks^{-1} appears to be a direct count from the 15 M dwarfs without reported Poisson uncertainties, completeness corrections, or a fitted frequency distribution; if the central claim of 'constraints on the X-ray flare frequency distributions' rests on this count, the derivation must be shown explicitly (e.g., via cumulative distribution or power-law fit parameters).
- [Flare property analysis] Discussion of flare properties: The reported strong correlation between flare strength and duration is used to support the escape calculation, but no quantitative fit (slope, scatter, or significance) or test against selection effects in the Chandra/eROSITA cross-match is provided; this affects whether the energy-duration relation can be extrapolated to the Myr-integrated input.
minor comments (2)
- [Abstract] The abstract cites 'recent simulations' without a reference; the main text should supply the specific papers and a brief summary of the escape model assumptions.
- [Introduction/Sample section] Notation for units (ks^{-1}, erg) is clear, but the manuscript should state whether the 15-star sample is volume-limited or magnitude-limited and how that affects the quoted average rate.
Simulated Author's Rebuttal
We thank the referee for their thoughtful and constructive report. We address each major comment below, indicating revisions where appropriate to strengthen the manuscript.
read point-by-point responses
-
Referee: [Abstract] Abstract, final paragraph: The 0.5-30 Myr upper limit is stated as following directly from the measured flare rate and 'recent simulations,' yet the text provides no explicit integration steps, no statement of the assumed constant flare rate over 10^6-10^7 yr, and no assessment of whether the 15-star sample remains representative after accounting for stellar evolution or selection biases; this assumption is load-bearing for the numerical bound.
Authors: We agree the abstract is too concise on this point. In revision we will expand the final abstract paragraph to briefly outline the integration of the observed flare rate with the escape simulations (cross-referencing the explicit steps already given in Section 4), state the constant-rate assumption, and add a short caveat on sample representativeness and evolutionary biases. The numerical bound itself is unchanged, but its presentation will be more transparent. revision: yes
-
Referee: [Sample compilation and rate derivation] Section describing the compiled sample (likely §2-3): The occurrence rate ~10^{-1} ks^{-1} appears to be a direct count from the 15 M dwarfs without reported Poisson uncertainties, completeness corrections, or a fitted frequency distribution; if the central claim of 'constraints on the X-ray flare frequency distributions' rests on this count, the derivation must be shown explicitly (e.g., via cumulative distribution or power-law fit parameters).
Authors: The quoted rate is the simple average (total flares divided by total exposure) across the 15 stars. We will revise §2–3 to report Poisson uncertainties on this average, discuss completeness of the eROSITA–Chandra cross-match, and explicitly show the derivation. Because the sample is heterogeneous we do not attempt a power-law fit, but we will add the cumulative flare-energy distribution to support the frequency-distribution claim. revision: yes
-
Referee: [Flare property analysis] Discussion of flare properties: The reported strong correlation between flare strength and duration is used to support the escape calculation, but no quantitative fit (slope, scatter, or significance) or test against selection effects in the Chandra/eROSITA cross-match is provided; this affects whether the energy-duration relation can be extrapolated to the Myr-integrated input.
Authors: We will add a quantitative characterization of the strength–duration correlation (best-fit slope, Pearson coefficient, and significance) in the revised §3, together with a brief assessment of selection effects arising from the cross-match. This will clarify the robustness of using the relation for the Myr-scale extrapolation. revision: yes
Circularity Check
No circularity: flare rates are direct counts; atmosphere-loss bound combines observations with external simulations
full rationale
The paper compiles reported X-ray flares from 15 M dwarfs and states the average occurrence rate as a direct measurement (~10^{-1} ks^{-1}) from that sample, with energies and durations likewise taken from the observed events. The 0.5-30 Myr upper limit is obtained by feeding these empirical quantities into separate 'recent simulations' of atmospheric escape; the text does not define any quantity in terms of itself, fit a parameter on a subset then rename the fit as a prediction, or rely on self-citations for the central result. The derivation therefore remains independent of its own inputs.
Axiom & Free-Parameter Ledger
Reference graph
Works this paper leans on
-
[1]
Arnaud, K. A. 1996, in Astronomical Society of the Pacific Conference Series, Vol. 101, Astronomical Data Analysis Software and Systems V, ed. G. H. Jacoby & J. Barnes, 17
1996
-
[2]
2021, AJ, 161, 147, doi: 10.3847/1538-3881/abd806
Demleitner, M., & Andrae, R. 2021, AJ, 161, 147, doi: 10.3847/1538-3881/abd806
work page internal anchor Pith review doi:10.3847/1538-3881/abd806 2021
-
[3]
2018, AJ, 156, 58, doi: 10.3847/1538-3881/aacb21
Mantelet, G., & Andrae, R. 2018, AJ, 156, 58, doi: 10.3847/1538-3881/aacb21
-
[4]
2018, A&A, 619, A177, doi: 10.1051/0004-6361/201834062
Baraffe, I., & Chabrier, G. 2018, A&A, 619, A177, doi: 10.1051/0004-6361/201834062
-
[5]
Bochanski, J. J., Hawley, S. L., Covey, K. R., et al. 2010, AJ, 139, 2679, doi: 10.1088/0004-6256/139/6/2679
-
[6]
arXiv , author =:2106.14517 , journal =
Brunner, H., Liu, T., Lamer, G., et al. 2022, A&A, 661, A1, doi: 10.1051/0004-6361/202141266
-
[7]
2014, Statistics and Computing, 26, 383–392, doi: 10.1007/s11222-014-9512-y
Buchner, J. 2016, Statistics and Computing, 26, 383, doi: 10.1007/s11222-014-9512-y
-
[8]
Buchner, J. 2019, PASP, 131, 108005, doi: 10.1088/1538-3873/aae7fc
-
[9]
2021, Journal of Open Source Software, 6, 3001, doi: 10.21105/joss.03001
Buchner, J. 2021, The Journal of Open Source Software, 6, 3001, doi: 10.21105/joss.03001
-
[10]
2025, A&A, 702, A112, doi: 10.1051/0004-6361/202555738
Caldiroli, A., Haardt, F., Gallo, E., et al. 2025, A&A, 702, A112, doi: 10.1051/0004-6361/202555738
-
[11]
1979, ApJ, 228, 939, doi: 10.1086/156922
Cash, W. 1979, ApJ, 228, 939, doi: 10.1086/156922
-
[12]
Cassak, P. A., Mullan, D. J., & Shay, M. A. 2008, ApJL, 676, L69, doi: 10.1086/587055
-
[13]
Structure and evolution of low-mass stars
Chabrier, G., & Baraffe, I. 1997, A&A, 327, 1039, doi: 10.48550/arXiv.astro-ph/9704118
work page internal anchor Pith review Pith/arXiv arXiv doi:10.48550/arxiv.astro-ph/9704118 1997
-
[14]
Chavali, S., Youngblood, A., Paudel, R. R., et al. 2022, Research Notes of the American Astronomical Society, 6, 201, doi: 10.3847/2515-5172/ac9591
-
[15]
Lin, R. P. 2008, ApJ, 677, 1385, doi: 10.1086/529011
-
[16]
Covey, K. R., Hawley, S. L., Bochanski, J. J., et al. 2008, AJ, 136, 1778, doi: 10.1088/0004-6256/136/5/1778
-
[17]
Matthews, J. M., & Cameron, C. 2016, ApJL, 829, L31, doi: 10.3847/2041-8205/829/2/L31 do Amaral, L. N. R., Shkolnik, E. L., Loyd, R. O. P., &
-
[18]
2025, ApJ, 985, 100, doi: 10.3847/1538-4357/adc932
Peacock, S. 2025, ApJ, 985, 100, doi: 10.3847/1538-4357/adc932
-
[19]
Doyle, L., Ramsay, G., Doyle, J. G., & Wu, K. 2019, MNRAS, 489, 437, doi: 10.1093/mnras/stz2205
-
[20]
Erkaev, N. V., Kulikov, Y. N., Lammer, H., et al. 2007, A&A, 472, 329, doi: 10.1051/0004-6361:20066929
-
[21]
arXiv , author =:2407.10799 , journal =
Evans, I. N., Evans, J. D., Mart´ ınez-Galarza, J. R., et al. 2024, ApJS, 274, 22, doi: 10.3847/1538-4365/ad6319
-
[22]
An extreme X-ray flare observed on EV Lac by ASCA in July 1998
Favata, F., Reale, F., Micela, G., et al. 2000, A&A, 353, 987, doi: 10.48550/arXiv.astro-ph/9909491
work page internal anchor Pith review Pith/arXiv arXiv doi:10.48550/arxiv.astro-ph/9909491 2000
-
[23]
Fleming, S. W., Million, C., Osten, R. A., Kolotkov, D. Y., & Brasseur, C. E. 2022, ApJ, 928, 8, doi: 10.3847/1538-4357/ac5037
-
[24]
Frisch, P. C., Redfield, S., & Slavin, J. D. 2011, ARA&A, 49, 237, doi: 10.1146/annurev-astro-081710-102613
-
[25]
S., Kowalski, A., France, K., et al
Froning, C. S., Kowalski, A., France, K., et al. 2019, ApJL, 871, L26, doi: 10.3847/2041-8213/aaffcd
-
[26]
Fruscione, A., McDowell, J. C., Allen, G. E., et al. 2006, in Society of Photo-Optical Instrumentation Engineers (SPIE) Conference Series, Vol. 6270, Observatory Operations: Strategies, Processes, and Systems, ed. D. R. Silva & R. E. Doxsey, 62701V, doi: 10.1117/12.671760
-
[27]
2011, A&A, 534, A133, doi: 10.1051/0004-6361/201117447
Fuhrmeister, B., Lalitha, S., Poppenhaeger, K., et al. 2011, A&A, 534, A133, doi: 10.1051/0004-6361/201117447
-
[28]
Fuhrmeister, B., Liefke, C., & Schmitt, J. H. M. M. 2007, A&A, 468, 221, doi: 10.1051/0004-6361:20066229 Gaia Collaboration, Brown, A. G. A., Vallenari, A., et al. 2018a, A&A, 616, A1, doi: 10.1051/0004-6361/201833051 Gaia Collaboration, Babusiaux, C., van Leeuwen, F., et al. 2018b, A&A, 616, A10, doi: 10.1051/0004-6361/201832843 Gaia Collaboration, Valle...
- [29]
-
[30]
Gershberg, R. E. 1972, Ap&SS, 19, 75, doi: 10.1007/BF00643168
-
[31]
L., Grießmeier, J.-M., von Paris, P., et al
Grenfell, J. L., Grießmeier, J.-M., von Paris, P., et al. 2012, Astrobiology, 12, 1109, doi: 10.1089/ast.2011.0682 G¨ udel, M. 2004, A&A Rv, 12, 71, doi: 10.1007/s00159-004-0023-2 G¨ udel, M., & Naz´ e, Y. 2009, A&A Rv, 17, 309, doi: 10.1007/s00159-009-0022-4
-
[32]
Guinan, E. F., Engle, S. G., & Durbin, A. 2016, ApJ, 821, 81, doi: 10.3847/0004-637X/821/2/81 G¨ unther, M. N., Zhan, Z., Seager, S., et al. 2020, AJ, 159, 60, doi: 10.3847/1538-3881/ab5d3a
-
[33]
Hawley, S. L., Davenport, J. R. A., Kowalski, A. F., et al. 2014, ApJ, 797, 121, doi: 10.1088/0004-637X/797/2/121
work page internal anchor Pith review doi:10.1088/0004-637x/797/2/121 2014
-
[34]
Hawley, S. L., Walkowicz, L. M., Allred, J. C., & Valenti, J. A. 2007, PASP, 119, 67, doi: 10.1086/510561 Høg, E., Fabricius, C., Makarov, V. V., et al. 2000, A&A, 355, L27
-
[35]
Howard, W. S., Corbett, H., Law, N. M., et al. 2019, ApJ, 881, 9, doi: 10.3847/1538-4357/ab2767
-
[36]
Hunt-Walker, N. M., Hilton, E. J., Kowalski, A. F., Hawley, S. L., & Matthews, J. M. 2012, PASP, 124, 545, doi: 10.1086/666495 23
-
[37]
2024, A&A, 687, A138, doi: 10.1051/0004-6361/202449541
Ilin, E., Poppenh¨ ager, K., Stelzer, B., & Dsouza, D. 2024, A&A, 687, A138, doi: 10.1051/0004-6361/202449541
-
[38]
2024, PASJ, 76, 175, doi: 10.1093/pasj/psae001
Inoue, S., Enoto, T., Namekata, K., et al. 2024, PASJ, 76, 175, doi: 10.1093/pasj/psae001
-
[39]
2009, in American Institute of Physics Conference Series, Vol
Irwin, J., Charbonneau, D., Nutzman, P., & Falco, E. 2009, in American Institute of Physics Conference Series, Vol. 1094, 15th Cambridge Workshop on Cool Stars, Stellar Systems, and the Sun, ed. E. Stempels, 445–448, doi: 10.1063/1.3099143 Ivezi´ c,ˇZ., Kahn, S. M., Tyson, J. A., et al. 2019, ApJ, 873, 111, doi: 10.3847/1538-4357/ab042c
-
[40]
Katsova, M. M., Kitchatinov, L. L., Livshits, M. A., et al. 2018, Astronomy Reports, 62, 72, doi: 10.1134/S106377291801002X
-
[41]
Kempton, E. M.-R., Bean, J. L., Louie, D. R., et al. 2018, PASP, 130, 114401, doi: 10.1088/1538-3873/aadf6f
-
[42]
2021, A&A, 646, A34, doi: 10.1051/0004-6361/202039003
Koller, F., Leitzinger, M., Temmer, M., et al. 2021, A&A, 646, A34, doi: 10.1051/0004-6361/202039003
-
[43]
Kopparapu, R. K., Ramirez, R. M., SchottelKotte, J., et al. 2014, ApJL, 787, L29, doi: 10.1088/2041-8205/787/2/L29
-
[44]
Kopparapu, R. K., Ramirez, R., Kasting, J. F., et al. 2013, ApJ, 765, 131, doi: 10.1088/0004-637X/765/2/131
-
[45]
Koskinen, T. T., Yelle, R. V., Harris, M. J., & Lavvas, P. 2013, Icarus, 226, 1695, doi: 10.1016/j.icarus.2012.09.026
-
[46]
Kowalski, A. F. 2024, Living Reviews in Solar Physics, 21, 1, doi: 10.1007/s41116-024-00039-4
-
[47]
Wisniewski, J. P., & Hilton, E. J. 2010, ApJL, 714, L98, doi: 10.1088/2041-8205/714/1/L98
-
[48]
Kowalski, A. F., Wisniewski, J. P., Hawley, S. L., et al. 2019, ApJ, 871, 167, doi: 10.3847/1538-4357/aaf058
-
[49]
Kuznetsov, A. A., Karakotov, R. R., Chandrashekhar, K., & Banerjee, D. 2023, Research in Astronomy and Astrophysics, 23, 015006, doi: 10.1088/1674-4527/aca190
-
[50]
Kuznetsov, A. A., & Kolotkov, D. Y. 2021, ApJ, 912, 81, doi: 10.3847/1538-4357/abf569
-
[51]
2018, A&A, 616, A132, doi: 10.1051/0004-6361/201832832
Lallement, R., Capitanio, L., Ruiz-Dern, L., et al. 2018, A&A, 616, A132, doi: 10.1051/0004-6361/201832832
-
[52]
Lammer, H., Lichtenegger, H. I. M., Kulikov, Y. N., et al. 2007, Astrobiology, 7, 185, doi: 10.1089/ast.2006.0128 L´ epine, S., & Gaidos, E. 2011, AJ, 142, 138, doi: 10.1088/0004-6256/142/4/138
-
[53]
Liefke, C., Fuhrmeister, B., & Schmitt, J. H. M. M. 2010, A&A, 514, A94, doi: 10.1051/0004-6361/201014012
-
[54]
Loredo, T. J. 1992, in Statistical Challenges in Modern Astronomy, ed. E. D. Feigelson & G. J. Babu, 275–297, doi: 10.1007/978-1-4613-9290-3 31
-
[55]
Loyd, R. O. P., Shkolnik, E. L., Schneider, A. C., et al. 2018a, ApJ, 867, 70, doi: 10.3847/1538-4357/aae2ae
-
[56]
Loyd, R. O. P., France, K., Youngblood, A., et al. 2018b, ApJ, 867, 71, doi: 10.3847/1538-4357/aae2bd
-
[57]
2015, Astrobiology, 15, 119, doi: 10.1089/ast.2014.1231
Luger, R., & Barnes, R. 2015, Astrobiology, 15, 119, doi: 10.1089/ast.2014.1231
-
[58]
2015, Astrobiology, 15, 57, doi: 10.1089/ast.2014.1215
Luger, R., Barnes, R., Lopez, E., et al. 2015, Astrobiology, 15, 57, doi: 10.1089/ast.2014.1215
-
[59]
2015, Earth, Planets and Space, 67, 59, doi: 10.1186/s40623-015-0217-z
Maehara, H., Shibayama, T., Notsu, Y., et al. 2015, Earth, Planets and Space, 67, 59, doi: 10.1186/s40623-015-0217-z
-
[60]
2022, A&A, 661, A29, doi: 10.1051/0004-6361/202141617
Magaudda, E., Stelzer, B., Raetz, S., et al. 2022, A&A, 661, A29, doi: 10.1051/0004-6361/202141617
-
[61]
2007, ApJ, 660, 1462, doi: 10.1086/513088
Maggio, A., Flaccomio, E., Favata, F., et al. 2007, ApJ, 660, 1462, doi: 10.1086/513088
-
[62]
Mann, A. W., Feiden, G. A., Gaidos, E., Boyajian, T., & von Braun, K. 2015, ApJ, 804, 64, doi: 10.1088/0004-637X/804/1/64
-
[63]
Mann, A. W., Feiden, G. A., Gaidos, E., Boyajian, T., & von Braun, K. 2016, ApJ, 819, 87, doi: 10.3847/0004-637X/819/1/87
-
[64]
Mason, B. D., Wycoff, G. L., Hartkopf, W. I., Douglass, G. G., & Worley, C. E. 2001, AJ, 122, 3466, doi: 10.1086/323920
-
[65]
Meadows, V. S., Reinhard, C. T., Arney, G. N., et al. 2018, Astrobiology, 18, 630, doi: 10.1089/ast.2017.1727
-
[66]
Miller, A. A., Abrams, N. S., Aldering, G., et al. 2025, PASP, 137, 094204, doi: 10.1088/1538-3873/ae02c5
-
[67]
Mitra-Kraev, U., Harra, L. K., Williams, D. R., & Kraev, E. 2005a, A&A, 436, 1041, doi: 10.1051/0004-6361:20052834
-
[68]
Mitra-Kraev, U., Harra, L. K., G¨ udel, M., et al. 2005b, A&A, 431, 679, doi: 10.1051/0004-6361:20041201
-
[69]
2019, ApJ, 870, 10, doi: 10.3847/1538-4357/aaee64
Mondrik, N., Newton, E., Charbonneau, D., & Irwin, J. 2019, ApJ, 870, 10, doi: 10.3847/1538-4357/aaee64
-
[70]
A., Queloz, D., Gillon, M., et al
Murray, C. A., Queloz, D., Gillon, M., et al. 2022, MNRAS, 513, 2615, doi: 10.1093/mnras/stac1078
-
[71]
Murray-Clay, R. A., Chiang, E. I., & Murray, N. 2009, ApJ, 693, 23, doi: 10.1088/0004-637X/693/1/23
-
[72]
2020, PASJ, 72, 68, doi: 10.1093/pasj/psaa051
Namekata, K., Maehara, H., Sasaki, R., et al. 2020, PASJ, 72, 68, doi: 10.1093/pasj/psaa051
-
[73]
R., Irwin, J., Charbonneau, D., et al
Newton, E. R., Irwin, J., Charbonneau, D., et al. 2017, ApJ, 834, 85, doi: 10.3847/1538-4357/834/1/85
-
[74]
Nousek, J. A., & Shue, D. R. 1989, ApJ, 342, 1207, doi: 10.1086/167676
-
[75]
Osten, R. A., Hawley, S. L., Allred, J. C., Johns-Krull, C. M., & Roark, C. 2005, ApJ, 621, 398, doi: 10.1086/427275
-
[76]
A., Godet, O., Drake, S., et al
Osten, R. A., Godet, O., Drake, S., et al. 2010, ApJ, 721, 785, doi: 10.1088/0004-637X/721/1/785
-
[77]
Pandey, J. C., & Singh, K. P. 2008, MNRAS, 387, 1627, doi: 10.1111/j.1365-2966.2008.13342.x 24
-
[78]
Park, T., Kashyap, V. L., Siemiginowska, A., et al. 2006, ApJ, 652, 610, doi: 10.1086/507406
-
[79]
Parker, E. N. 1993, ApJ, 408, 707, doi: 10.1086/172631
-
[80]
Intrinsic Colors, Temperatures, and Bolometric Corrections of Pre-Main Sequence Stars
Pecaut, M. J., & Mamajek, E. E. 2013, ApJS, 208, 9, doi: 10.1088/0067-0049/208/1/9
work page internal anchor Pith review doi:10.1088/0067-0049/208/1/9 2013
discussion (0)
Sign in with ORCID, Apple, or X to comment. Anyone can read and Pith papers without signing in.