LLM-Based Visualization Evaluation: How Well Do Literacy-Stratified Personas Approximate Human Judgments?
Pith reviewed 2026-06-27 14:44 UTC · model grok-4.3
The pith
Literacy-stratified LLM personas match human visualization judgments on some tasks but diverge systematically on others.
A machine-rendered reading of the paper's core claim, the machinery that carries it, and where it could break.
Core claim
The central claim is that a two-stage process of constructing visualization literacy personas grounded in VLAT and then directing LLMs to adopt them produces plausible proxies for literacy-dependent perception under some conditions but not others; benchmarking against human data from VLAT and BeauVIS reveals specific task types and evaluation dimensions where persona responses align with human distributions and where they diverge.
What carries the argument
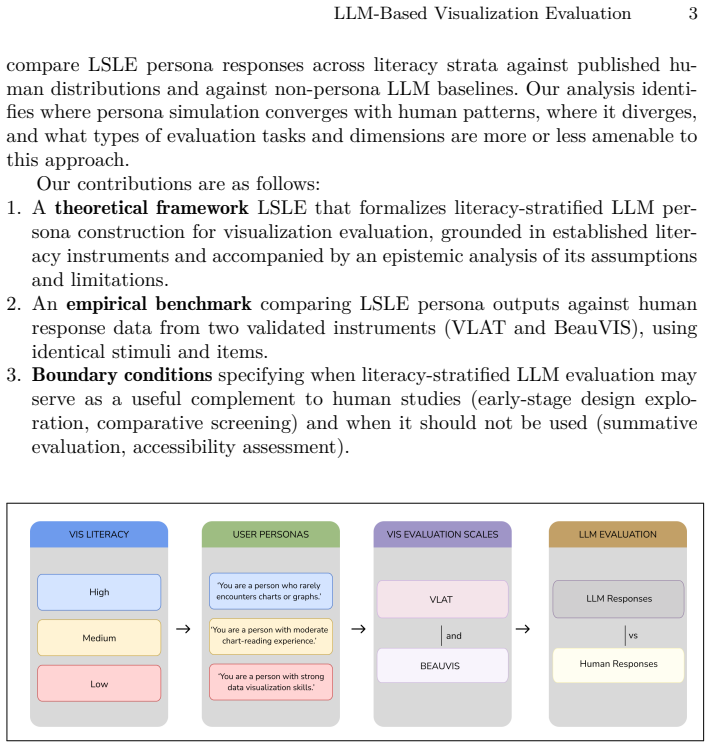
Literacy-Stratified LLM Evaluation (LSLE) framework: a two-stage process that constructs personas from visualization literacy instruments such as VLAT and then instructs LLMs to role-play as those personas when evaluating visualization artifacts.
If this is right
- LSLE supports early-stage design exploration by allowing rapid iteration without immediate human recruitment.
- The method is appropriate for rapid comparative screening of visualization alternatives.
- LSLE is not intended to replace summative evaluation that requires real-user data.
- Boundary conditions limit responsible use to cases where the identified convergence patterns hold.
Where Pith is reading between the lines
- The same persona-construction approach could be tested with additional user attributes such as domain expertise or cultural background to expand its scope.
- Observed systematic failures may indicate specific perceptual processes that current LLMs model poorly.
- Applying LSLE to visualization types absent from the original VLAT and BeauVIS stimuli would provide a direct test of generalizability.
- Hybrid pipelines that combine LSLE outputs with targeted human checks could reduce overall evaluation cost while preserving validity.
Load-bearing premise
Directing LLMs to adopt personas grounded in VLAT produces plausible proxies for literacy-dependent perception under the conditions the framework claims to characterize.
What would settle it
A follow-up human study using new visualization stimuli and literacy-stratified participants whose response distributions deviate from LSLE outputs in ways not anticipated by the VLAT and BeauVIS benchmarks.
Figures
read the original abstract
Evaluating data visualizations across diverse user populations continues to pose a significant methodological challenge within visualization research. We propose a theorized evaluation framework, Literacy-Stratified LLM Evaluation (LSLE), which formalizes a two-stage process. The first stage involves constructing visualization literacy personas grounded in established frameworks such as VLAT. The second stage directs large language models to adopt these personas as simulated evaluators of visualization artifacts. We ground the framework in an epistemic analysis that characterizes the conditions under which LLM persona simulation may produce plausible proxies for literacy-dependent perception - and, critically, the conditions under which it does not - engaging directly with emerging critiques of LLM-as-participant paradigms from the VIS and HCI literature. To empirically test LSLE's boundaries, we benchmark its outputs against openly available human response data from the validation studies of two established instruments: VLAT and BeauVIS. Using the same stimuli and assessment items as the original human studies, we compare LSLE persona responses across literacy strata against published human distributions and against default (non-persona) LLM baselines. Our analysis reveals where literacy-stratified personas converge with and diverge from human response patterns - identifying task types and evaluation dimensions where persona simulation approximates human variability and where it systematically fails. We discuss implications for the responsible use of LLM-assisted evaluation as a complement to empirical methods, and propose boundary conditions for when LSLE may be most appropriate: early-stage design exploration and rapid comparative screening rather than summative evaluation.
Editorial analysis
A structured set of objections, weighed in public.
Referee Report
Summary. The paper proposes the Literacy-Stratified LLM Evaluation (LSLE) framework. It constructs visualization literacy personas grounded in VLAT, directs LLMs to adopt these personas for evaluating visualizations, and benchmarks the outputs against published human response distributions from the original VLAT and BeauVIS validation studies. The central claim is that this process identifies task types and evaluation dimensions where the stratified personas converge with or systematically diverge from human patterns, thereby defining boundary conditions for appropriate use (early-stage exploration and rapid screening, not summative evaluation) while engaging critiques of LLM-as-participant methods.
Significance. If the empirical comparisons are robust, the work offers a structured, epistemically grounded approach to LLM-assisted visualization evaluation that directly addresses methodological challenges in the field. Strengths include the explicit two-stage design, use of openly available human data for validation, and engagement with existing VIS/HCI critiques rather than assuming perfect simulation. This could usefully complement empirical methods for rapid iteration while clarifying limits.
major comments (2)
- [Empirical Evaluation] The empirical benchmarking section does not specify the quantitative metrics (e.g., distributional divergence measures, correlation coefficients, or statistical tests) used to compare LSLE persona responses against human distributions and non-persona baselines. This detail is load-bearing for the claims identifying specific task types and dimensions of convergence versus systematic failure.
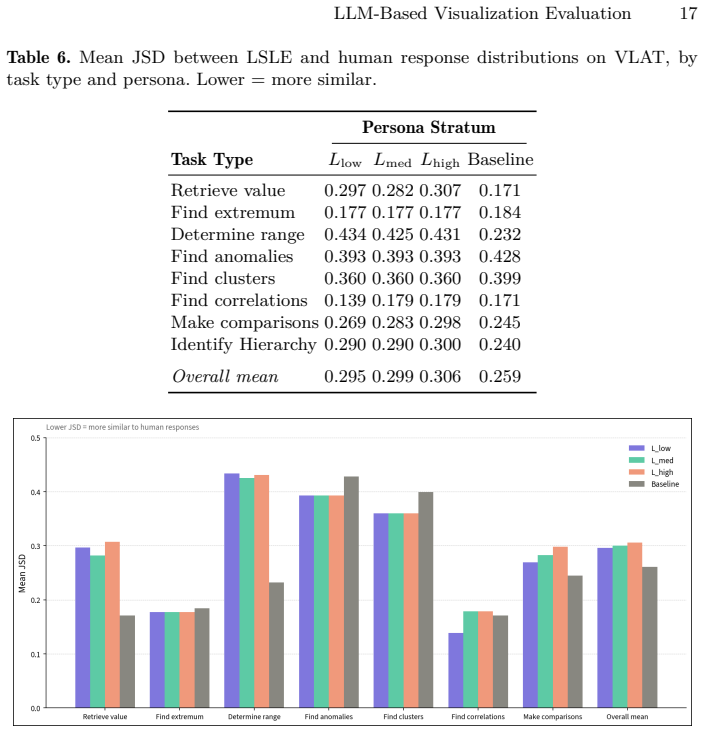
- [Results] The results presentation lacks raw or summarized response distributions (or effect sizes) across literacy strata for the VLAT and BeauVIS items. Without these, it is not possible to verify whether the reported convergences and divergences actually support the stated boundary conditions.
minor comments (2)
- The abstract would be strengthened by a one-sentence summary of the main empirical pattern (e.g., which task types showed strongest convergence).
- [LSLE Framework] Notation for the two-stage process could be clarified with a simple diagram or numbered steps in the framework section.
Simulated Author's Rebuttal
We thank the referee for their constructive comments, which identify important omissions in the description and presentation of our empirical benchmarking. We respond to each major comment below and will revise the manuscript accordingly to improve transparency.
read point-by-point responses
-
Referee: [Empirical Evaluation] The empirical benchmarking section does not specify the quantitative metrics (e.g., distributional divergence measures, correlation coefficients, or statistical tests) used to compare LSLE persona responses against human distributions and non-persona baselines. This detail is load-bearing for the claims identifying specific task types and dimensions of convergence versus systematic failure.
Authors: We agree that the specific quantitative metrics are not detailed in the current manuscript. The Empirical Evaluation section describes comparisons of LSLE outputs to human distributions and baselines but does not name the measures (such as divergence metrics or correlation coefficients) or tests used. We will revise this section to explicitly specify the metrics and statistical approaches employed, along with their rationale for identifying convergence and divergence patterns. revision: yes
-
Referee: [Results] The results presentation lacks raw or summarized response distributions (or effect sizes) across literacy strata for the VLAT and BeauVIS items. Without these, it is not possible to verify whether the reported convergences and divergences actually support the stated boundary conditions.
Authors: The referee correctly observes that the Results section does not include summarized response distributions or effect sizes across literacy strata. While the manuscript reports patterns of convergence and divergence, it does not present the underlying data. We will add tables or figures with summarized distributions and effect sizes for key VLAT and BeauVIS items to enable verification of the boundary conditions. revision: yes
Circularity Check
No significant circularity detected
full rationale
The paper proposes the LSLE framework as a two-stage process of constructing VLAT-grounded personas and then benchmarking LLM outputs against external, published human response distributions from the original VLAT and BeauVIS validation studies. The central analysis compares persona responses to these independent human data using the same stimuli, explicitly aiming to identify both convergence and systematic divergence rather than assuming equivalence. No equations, fitted parameters, or self-citations are described that would reduce any result to the paper's own inputs by construction. The work is self-contained against external benchmarks and engages existing literature critiques without relying on unverified internal premises.
Axiom & Free-Parameter Ledger
Reference graph
Works this paper leans on
-
[1]
In: Proceedings of the Interna- tional Conference on Machine Learning (ICML)
Aher, G., Arriaga, R.I., Kalai, A.T.: Using large language models to simulate mul- tiple humans and replicate human subject studies. In: Proceedings of the Interna- tional Conference on Machine Learning (ICML). pp. 337–371 (2023)
2023
-
[2]
In: Proceedings of the IEEE Symposium on Information Visualization (InfoVis)
Amar, R., Eagan, J., Stasko, J.: Low-level components of analytic activity in in- formation visualization. In: Proceedings of the IEEE Symposium on Information Visualization (InfoVis). pp. 111–117 (2005)
2005
-
[3]
Political Analysis 31(3), 337–351 (2023)
Argyle, L.P., Busby, E.C., Fulda, N., Gubler, J.R., Rytting, C., Wingate, D.: Out of one, many: Using language models to simulate human samples. Political Analysis 31(3), 337–351 (2023)
2023
-
[4]
Computer Graphics Forum37(3), 573–595 (2018)
Borgo, R., Micallef, L., Bach, B., McGee, F., Lee, B.: Information visualization evaluation using crowdsourcing. Computer Graphics Forum37(3), 573–595 (2018)
2018
-
[5]
In: Computer Graphics Forum
Borgo, R., Micallef, L., Bach, B., McGee, F., Lee, B.: Information visualization evaluation using crowdsourcing. In: Computer Graphics Forum. vol. 37, pp. 573–
-
[6]
Wiley Online Library (2018)
2018
-
[7]
Proceedings of the National Academy of Sciences116(6), 1857–1864 (2019)
Börner,K.,Bueckle,A.,Ginda,M.:Datavisualizationliteracy:Definitions,concep- tual frameworks, exercises, and assessments. Proceedings of the National Academy of Sciences116(6), 1857–1864 (2019)
2019
-
[8]
Information Visualization15(3), 198–213 (2016)
Börner, K., Maltese, A., Balliet, R.N., Heimlich, J.: Investigating aspects of data visualization literacy using 20 information visualizations and 273 science museum visitors. Information Visualization15(3), 198–213 (2016)
2016
-
[9]
IEEE Transactions on Visualization and Computer Graphics 20(12), 1963–1972 (2014)
Boy, J., Rensink, R.A., Bertini, E., Fekete, J.D.: A principled way of assessing visualization literacy. IEEE Transactions on Visualization and Computer Graphics 20(12), 1963–1972 (2014)
1963
-
[10]
IEEE Transactions on Visualization and Computer Graphics31(1), 1083–1093 (2025)
Cabouat, A.F., He, T., Isenberg, P., Isenberg, T.: PREVis: Perceived readability evaluation for visualizations. IEEE Transactions on Visualization and Computer Graphics31(1), 1083–1093 (2025)
2025
-
[11]
In: Kerren, A., Stasko, J.T., Fekete, J.D., North, C
Carpendale, S.: Evaluating information visualizations. In: Kerren, A., Stasko, J.T., Fekete, J.D., North, C. (eds.) Information Visualization: Human-Centered Issues and Perspectives, pp. 19–45. Springer (2008)
2008
-
[12]
Chen, L., Li, J., Dong, X., Zhang, P., Zang, Y., Chen, Z., Duan, H., Wang, J., Qiao, Y., Lin, D., Zhao, F.: Are we on the right way for evaluating large vision-language models? arXiv preprint arXiv:2403.20330 (2024)
work page internal anchor Pith review Pith/arXiv arXiv 2024
-
[13]
Chiang, J., Lee, K.: Can large language models be an alternative to human evalua- tions? In: Proceedings of the Annual Meeting of the Association for Computational Linguistics (ACL). pp. 15607–15631 (2023)
2023
-
[14]
Journal of the American Statistical Association79(387), 531–554 (1984) 24 S Panda
Cleveland, W.S., McGill, R.: Graphical perception: Theory, experimentation, and application to the development of graphical methods. Journal of the American Statistical Association79(387), 531–554 (1984) 24 S Panda
1984
-
[15]
In: Computer graphics fórum
Elavsky, F., Bennett, C., Moritz, D.: How accessible is my visualization? evaluating visualization accessibility with chartability. In: Computer graphics fórum. vol. 41, pp. 57–70. Wiley Online Library (2022)
2022
-
[16]
In: Proceedings of the 2012 BELIV Workshop: Beyond Time and Errors-Novel Evaluation Methods for Visualization
Elmqvist, N., Yi, J.S.: Patterns for visualization evaluation. In: Proceedings of the 2012 BELIV Workshop: Beyond Time and Errors-Novel Evaluation Methods for Visualization. pp. 1–8 (2012)
2012
-
[17]
In: Proceedings of the ACM CHI Conference on Human Factors in Computing Systems
Hämäläinen, P., Tavast, M., Berry, A., Bain, M.A., Glassman, C., Kuikkaniemi, K.: Evaluating large language models in generating synthetic HCI research data: A case study. In: Proceedings of the ACM CHI Conference on Human Factors in Computing Systems. pp. 1–19 (2023)
2023
-
[18]
IEEE Transactions on Visualization and Computer Graphics29(1), 363–373 (2023)
He, T., Isenberg, P., Dachselt, R., Isenberg, T.: BeauVis: A validated scale for measuring the aesthetic pleasure of visual representations. IEEE Transactions on Visualization and Computer Graphics29(1), 363–373 (2023)
2023
-
[19]
In: Proceedings of the ACM CHI Conference on Human Factors in Computing Systems
Heer, J., Bostock, M.: Crowdsourcing graphical perception: Using mechanical turk to assess visualization design. In: Proceedings of the ACM CHI Conference on Human Factors in Computing Systems. pp. 203–212 (2010)
2010
-
[20]
In: Proceed- ings of the 62nd Annual Meeting of the Association for Computational Linguistics (Volume 1: Long Papers)
Hu, T., Collier, N.: Quantifying the persona effect in llm simulations. In: Proceed- ings of the 62nd Annual Meeting of the Association for Computational Linguistics (Volume 1: Long Papers). pp. 10289–10307 (2024)
2024
-
[21]
IEEE Transactions on Visualization and Computer Graphics19(12), 2818–2827 (2013)
Isenberg, T., Isenberg, P., Chen, J., Sedlmair, M., Möller, T.: A systematic review on the practice of evaluating visualization. IEEE Transactions on Visualization and Computer Graphics19(12), 2818–2827 (2013)
2013
-
[22]
IEEE Computer Graphics and Applications41(2), 8–16 (2021)
Jena, A., Butler, M., Dwyer, T., Ellis, K., Engelke, U., Kirkham, R., Marriott, K., Paris, C., Rajamanickam, V.: The next billion users of visualization. IEEE Computer Graphics and Applications41(2), 8–16 (2021)
2021
-
[23]
In: Proceedings of the IEEE Visualization and Visual Analytics (VIS)
Kim, H., Moritz, D., Hullman, J.: Design probes for large language models: Ex- ploring LLM-generated visualization design spaces. In: Proceedings of the IEEE Visualization and Visual Analytics (VIS). pp. 1–5 (2024)
2024
-
[24]
In: Computer graphics forum
Kim, N.W., Joyner, S.C., Riegelhuth, A., Kim, Y.: Accessible visualization: Design space, opportunities, and challenges. In: Computer graphics forum. vol. 40, pp. 173–188. Wiley Online Library (2021)
2021
-
[25]
In: Proceedings of the ACM CHI Conference on Human Factors in Computing Systems
Kittur, A., Chi, E.H., Suh, B.: Crowdsourcing user studies with mechanical turk. In: Proceedings of the ACM CHI Conference on Human Factors in Computing Systems. pp. 453–456 (2008)
2008
-
[26]
IEEE Transactions on Visualization and Computer Graphics18(9), 1520–1536 (2012)
Lam, H., Bertini, E., Isenberg, P., Plaisant, C., Carpendale, S.: Empirical studies in information visualization: Seven scenarios. IEEE Transactions on Visualization and Computer Graphics18(9), 1520–1536 (2012)
2012
-
[27]
IEEE Transactions on Visualization and Computer Graphics23(1), 551–560 (2017)
Lee, S., Kim, S.H., Kwon, B.C.: VLAT: Development of a visualization literacy as- sessment test. IEEE Transactions on Visualization and Computer Graphics23(1), 551–560 (2017)
2017
-
[28]
In: Proceedings of the IEEE Visualization and Visual Analytics (VIS)
Li, Y., Chen, W., Wu, Y.: LLM4Vis: Explainable visualization recommendation using ChatGPT. In: Proceedings of the IEEE Visualization and Visual Analytics (VIS). pp. 1–5 (2024)
2024
-
[29]
Linxen, S., Sturm, C., Brühlmann, F., Cassau, V., Opwis, K., Reinecke, K.: How weird is chi? In: Proceedings of the 2021 chi conference on human factors in com- puting systems. pp. 1–14 (2021)
2021
-
[30]
IEEE Trans- actions on Visualization and Computer Graphics15(6), 921–928 (2009)
Munzner, T.: A nested model for visualization design and validation. IEEE Trans- actions on Visualization and Computer Graphics15(6), 921–928 (2009)
2009
-
[31]
Cognitive research: principles and implications3(1), 29 (2018) LLM-Based Visualization Evaluation 25
Padilla, L.M., Creem-Regehr, S.H., Hegarty, M., Stefanucci, J.K.: Decision making with visualizations: a cognitive framework across disciplines. Cognitive research: principles and implications3(1), 29 (2018) LLM-Based Visualization Evaluation 25
2018
-
[32]
Frontiers in Psychology11, 579267 (2021)
Padilla, L.M., Powell, M., Kay, M., Hullman, J.: Uncertain about uncertainty: How qualitative expressions of forecaster confidence impact decision-making with uncertainty visualizations. Frontiers in Psychology11, 579267 (2021)
2021
-
[33]
arXiv preprint arXiv:2409.14858 (2024)
Panda, S.: Llms’ ways of seeing user personas. arXiv preprint arXiv:2409.14858 (2024)
-
[34]
Computer Graphics Forum42(3), 1–12 (2023)
Pandey, A.V., Murtaza, K., Bertini, E.: Mini-VLAT: A short and effective measure of visualization literacy. Computer Graphics Forum42(3), 1–12 (2023)
2023
-
[35]
In: Proceedings of the 33rd annual acm conference on human factors in computing systems
Pandey,A.V.,Rall,K.,Satterthwaite,M.L.,Nov,O.,Bertini,E.:Howdeceptiveare deceptive visualizations? an empirical analysis of common distortion techniques. In: Proceedings of the 33rd annual acm conference on human factors in computing systems. pp. 1469–1478 (2015)
2015
-
[36]
In: Proceed- ings of the Working Conference on Advanced Visual Interfaces (AVI)
Plaisant, C.: The challenge of information visualization evaluation. In: Proceed- ings of the Working Conference on Advanced Visual Interfaces (AVI). pp. 109–116 (2004)
2004
-
[37]
In: Advances in Neural Information Processing Systems (NeurIPS) (2024)
Salewski, L., Alaniz, S., Rio-Torto, I., Schulz, E., Akata, Z.: In-context imperson- ation reveals large language models’ strengths and biases. In: Advances in Neural Information Processing Systems (NeurIPS) (2024)
2024
-
[38]
In: Extended abstracts of the CHI conference on human factors in computing systems
Schuller, A., Janssen, D., Blumenröther, J., Probst, T.M., Schmidt, M., Kumar, C.: Generating personas using llms and assessing their viability. In: Extended abstracts of the CHI conference on human factors in computing systems. pp. 1–7 (2024)
2024
-
[39]
Nature623(7987), 493–498 (2023)
Shanahan, M., McDonell, K., Reynolds, L.: Role play with large language models. Nature623(7987), 493–498 (2023)
2023
-
[40]
In: Proceedings of the ACM CHI Conference on Human Factors in Computing Systems (2024)
Shankar, S., Zamfirescu-Pereira, J., Hartmann, B., Parameswaran, A.K., Arawjo, I.: Who validates the validators? aligning LLM-assisted evaluation of LLM outputs with human preferences. In: Proceedings of the ACM CHI Conference on Human Factors in Computing Systems (2024)
2024
-
[41]
IEEE transactions on visualization and computer graphics20(12), 2152– 2160 (2014)
Talbot, J., Setlur, V., Anand, A.: Four experiments on the perception of bar charts. IEEE transactions on visualization and computer graphics20(12), 2152– 2160 (2014)
2014
-
[42]
arXiv preprint arXiv:2505.17202 (2025)
Verma,A.,Mukherjee,K.,Potts,C.,Kreiss,E.,Fan,J.E.:Chart-6:human-centered evaluation of data visualization understanding in vision-language models. arXiv preprint arXiv:2505.17202 (2025)
-
[43]
Journal of Visualization25(1), 95–110 (2022)
Wei, Y., Mei, H., Huang, W., Wu, X., Xu, M., Chen, W.: An evolutional model for operation-driven visualization design. Journal of Visualization25(1), 95–110 (2022)
2022
discussion (0)
Sign in with ORCID, Apple, or X to comment. Anyone can read and Pith papers without signing in.