Internet Quality Barometer (IQB): A preliminary data-driven evaluation of the IQB framework
Pith reviewed 2026-06-27 11:16 UTC · model grok-4.3
The pith
The IQB framework turns raw speed tests into a 0-1 Internet quality score by chaining measurement-to-requirement and requirement-to-use-case mappings.
A machine-rendered reading of the paper's core claim, the machinery that carries it, and where it could break.
Core claim
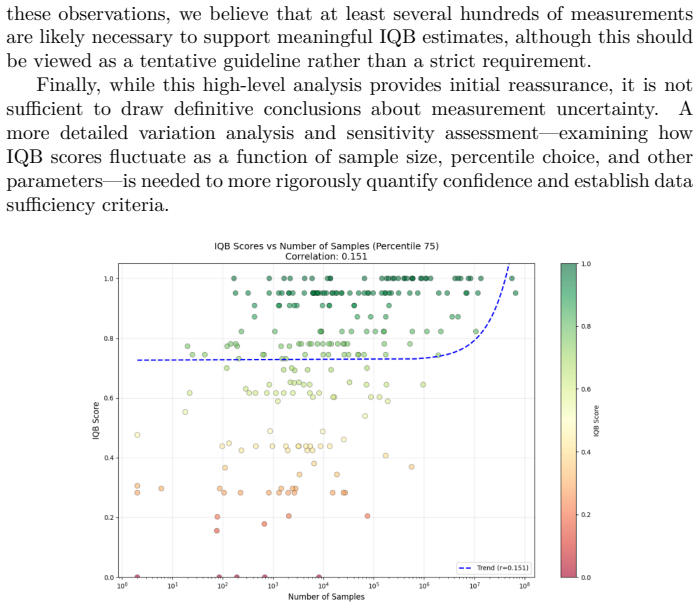
The authors built an open-source IQB library and prototype application that compute the composite 0-1 score from raw measurements, map those measurements to network requirements, map requirements to representative use cases, and aggregate across use cases; they then performed a preliminary sensitivity analysis on global data to quantify how parameter choices in the mappings affect the resulting scores and to identify the most influential parameters.
What carries the argument
The IQB score, formed by successive mappings from raw speed-test data to network requirements, then to representative use cases, and finally aggregated into a single 0-1 index.
Load-bearing premise
The chosen mappings from raw measurements to requirements and from requirements to use cases match real user needs.
What would settle it
A side-by-side comparison, for the same locations, of IQB scores computed under the authors' default mappings versus scores computed under alternative mappings that better match measured user satisfaction surveys.
Figures
read the original abstract
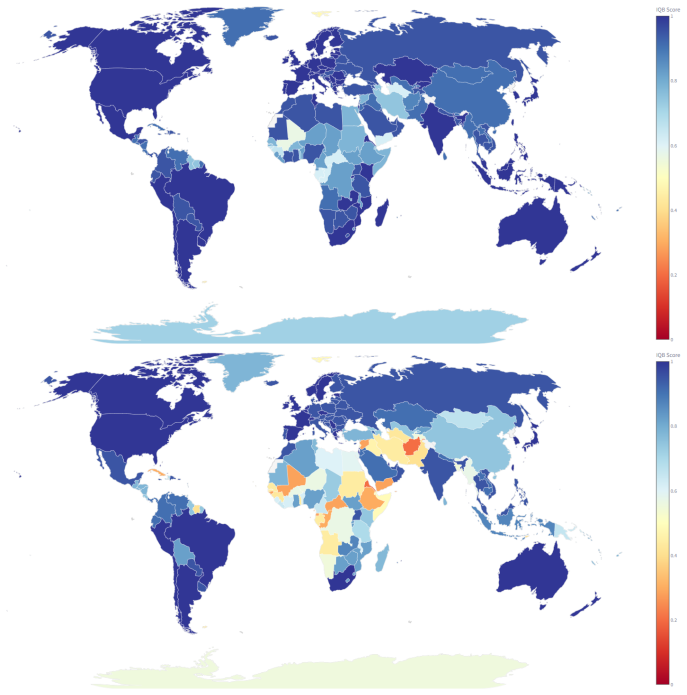
The Internet Quality Barometer (IQB) framework was designed to transform raw Internet measurement data into actionable insights about Internet quality. Specifically, the framework maps raw speed test measurements to network requirements (e.g., throughput, latency), maps these requirements to representative Internet use cases (such as video streaming or web browsing), and finally aggregates performance across use cases into a single IQB score. The IQB score is a composite index ranging from 0 to 1, intended to capture overall Internet quality in a way that is both interpretable and comparable across locations. We implemented the IQB framework in practice by developing an open-source IQB library and a prototype web application. These tools enabled us to compute IQB scores at scale, including global estimates aggregated at the level of countries, regions, and cities. In this report we conduct a preliminary sensitivity analysis of the IQB framework, investigating how different parameter choices affect the resulting IQB scores, identifying which parameters the framework is most sensitive to, and highlighting cases that may lead to outliers or potentially misleading results.
Editorial analysis
A structured set of objections, weighed in public.
Referee Report
Summary. The manuscript presents the Internet Quality Barometer (IQB) framework, which maps raw speed-test measurements first to network requirements (throughput, latency) and then to representative use cases (video streaming, web browsing), finally aggregating performance into a single 0-1 composite IQB score. It reports the development of an open-source IQB library and prototype web application that enable computation of these scores at scale, including global aggregates at country, region, and city levels, together with a preliminary sensitivity analysis that identifies parameter influence and potential outliers.
Significance. The open-source library and web-application prototype constitute a concrete, reproducible contribution that allows others to compute and extend the IQB scores. If the two-stage mapping from measurements to use cases can be shown to reflect actual user experience, the resulting 0-1 index would offer an interpretable, location-comparable metric for Internet quality assessment.
major comments (2)
- [Abstract] Abstract: the central claim that the IQB score is 'interpretable and comparable across locations' rests on the accuracy of the mappings from raw measurements to network requirements and from requirements to use cases; the reported sensitivity analysis only quantifies robustness to internal parameter choices and does not supply external validation (user QoE surveys, controlled experiments, or comparison with established QoE models) that would confirm these mappings encode real-world needs.
- [Abstract] Abstract and implementation description: no data sources, measurement volume, exact threshold values, or aggregation formulas are stated, rendering the reported country-, region-, and city-level estimates unverifiable and preventing assessment of whether the sensitivity-analysis results generalize beyond the chosen (possibly tuned) parameter set.
minor comments (1)
- The abstract would be strengthened by a single sentence stating the approximate number of speed-test records or locations analyzed, giving readers a sense of scale for the global estimates.
Simulated Author's Rebuttal
We thank the referee for the constructive comments, which help clarify the scope and limitations of this preliminary work on the IQB framework. We respond to each major comment below.
read point-by-point responses
-
Referee: [Abstract] Abstract: the central claim that the IQB score is 'interpretable and comparable across locations' rests on the accuracy of the mappings from raw measurements to network requirements and from requirements to use cases; the reported sensitivity analysis only quantifies robustness to internal parameter choices and does not supply external validation (user QoE surveys, controlled experiments, or comparison with established QoE models) that would confirm these mappings encode real-world needs.
Authors: We agree that external validation would strengthen the claim of interpretability and comparability. The manuscript is explicitly positioned as a preliminary report focused on framework definition and internal sensitivity analysis; the mappings draw from published network requirement guidelines for the selected use cases. In revision we will add an explicit limitations paragraph in the abstract and main text, state the literature sources for thresholds, and note that external QoE validation is planned for subsequent work. revision: partial
-
Referee: [Abstract] Abstract and implementation description: no data sources, measurement volume, exact threshold values, or aggregation formulas are stated, rendering the reported country-, region-, and city-level estimates unverifiable and preventing assessment of whether the sensitivity-analysis results generalize beyond the chosen (possibly tuned) parameter set.
Authors: We accept that explicit specification is required for verifiability. The open-source library encodes the formulas and default thresholds; the manuscript text describes the overall aggregation logic. To address the comment we will insert a dedicated reproducibility subsection listing the data sources employed for the global aggregates, the measurement volumes, the precise threshold values, and the aggregation formulas used in the reported results and sensitivity runs. revision: yes
Circularity Check
No circularity: IQB mappings presented as design choices with sensitivity analysis
full rationale
The paper defines the IQB framework explicitly through chosen mappings (raw measurements to network requirements to use cases) and aggregation to a 0-1 score, then reports sensitivity analysis on those parameter choices. No derivation, prediction, or result reduces by construction to its own inputs; the mappings are introduced as framework design rather than derived or fitted outputs. No self-citations appear as load-bearing justifications, no uniqueness theorems are invoked, and no ansatz or renaming of known results is used. The evaluation remains self-contained as an internal robustness check on a proposed index.
Axiom & Free-Parameter Ledger
Reference graph
Works this paper leans on
-
[1]
Proceedings of the 5th ACM SIGCAS/SIGCHI Conference on Computing and Sustainable Societies , pages=
Characterizing internet access and quality inequities in california m-lab measurements , author=. Proceedings of the 5th ACM SIGCAS/SIGCHI Conference on Computing and Sustainable Societies , pages=
-
[2]
Computer Networks , volume=
A general QoE assessment framework for applications and services , author=. Computer Networks , volume=. 2023 , publisher=
2023
-
[3]
TPRC49: The 49th Research Conference on Communication, Information and Internet Policy , year=
Measurement, meaning and purpose: Exploring the M-Lab NDT dataset , author=. TPRC49: The 49th Research Conference on Communication, Information and Internet Policy , year=
-
[4]
FCC ECFS System, Oct , volume=
Making Broadband Internet Labels Useful and Usable: Preliminary Report on Consumer-Driven Broadband Label Design , author=. FCC ECFS System, Oct , volume=
-
[5]
Technological Forecasting and Social Change , volume=
Composite indices for the evaluation of a country's information technology development level: Extensions of the IDI of the ITU , author=. Technological Forecasting and Social Change , volume=. 2015 , publisher=
2015
-
[6]
ACM SIGCOMM Computer Communication Review , volume=
M-Lab: User initiated Internet data for the research community , author=. ACM SIGCOMM Computer Communication Review , volume=. 2022 , publisher=
2022
-
[7]
Applied Sciences , volume=
Network traffic type-based quality of experience (qoe) assessment for universal services , author=. Applied Sciences , volume=. 2019 , publisher=
2019
-
[8]
Proceedings of the ACM on Measurement and Analysis of Computing Systems , volume=
A comparative analysis of ookla speedtest and measurement labs network diagnostic test (ndt7) , author=. Proceedings of the ACM on Measurement and Analysis of Computing Systems , volume=. 2023 , publisher=
2023
-
[9]
2013 , type =
Brunnstr. 2013 , type =
2013
-
[10]
Quality of Experience: Advanced Concepts, Applications and Methods , editor =. 2014 , publisher =. doi:10.1007/978-3-319-02681-7 , isbn =
-
[11]
Proceedings of the 2025 ACM Internet Measurement Conference , pages=
Poster: The Internet Quality Barometer Framework , author=. Proceedings of the 2025 ACM Internet Measurement Conference , pages=
2025
-
[12]
Proceedings of the 22nd ACM Internet Measurement Conference , pages=
The importance of contextualization of crowdsourced active speed test measurements , author=. Proceedings of the 22nd ACM Internet Measurement Conference , pages=
-
[13]
Proceedings of the 25th ACM international conference on Multimedia , pages=
Quality-of-experience of adaptive video streaming: Exploring the space of adaptations , author=. Proceedings of the 25th ACM international conference on Multimedia , pages=
-
[14]
and Yang, Fangchun , journal=
Yang, Mingzhe and Wang, Shangguang and Calheiros, Rodrigo N. and Yang, Fangchun , journal=. Survey on QoE Assessment Approach for Network Service , year=
-
[15]
2019 , publisher =
Guidelines on Producing Leading, Composite and Sentiment Indicators , author =. 2019 , publisher =
2019
-
[16]
2008 , publisher =
Handbook on Constructing Composite Indicators: Methodology and User Guide , author =. 2008 , publisher =
2008
-
[17]
2016 , month = dec, url =
Measuring Fixed Broadband Report 2016: A Report on Consumer Fixed Broadband Performance in the United States , author =. 2016 , month = dec, url =
2016
-
[18]
2024 , month = aug, url =
Measuring Fixed Broadband -- Thirteenth Report: A Report on Consumer Fixed Broadband Performance in the United States , author =. 2024 , month = aug, url =
2024
-
[19]
Speedtest Global Index: About , author =
discussion (0)
Sign in with ORCID, Apple, or X to comment. Anyone can read and Pith papers without signing in.