Semantic Segmentation of Node and Edge Diagrams for Assistive Technology
Pith reviewed 2026-06-27 13:22 UTC · model grok-4.3
The pith
Compact deep learning models segment node-link diagrams with over 93% per-pixel accuracy on synthetic data.
A machine-rendered reading of the paper's core claim, the machinery that carries it, and where it could break.
Core claim
The authors present compact deep learning models for semantic segmentation of node-link diagrams that achieve per-pixel accuracy exceeding 93% on a large synthetic dataset, enabling the extraction of node and edge information from bitmap images without requiring an underlying machine-readable representation.
What carries the argument
Compact deep learning models trained for pixel-wise classification of nodes, edges, and background in node-link diagrams.
If this is right
- Bitmap images of node-link diagrams can be processed into node and edge labels without access to vector source files.
- Assistive interfaces gain the ability to handle the image formats in which diagrams are typically distributed.
- Automated conversion from visual to structured representations becomes feasible for graphs and flowcharts.
- Compact model size supports deployment in resource-limited accessibility tools.
Where Pith is reading between the lines
- If accuracy holds on real diagrams, the output could feed graph reconstruction steps to produce traversable data structures for screen readers.
- Integration with optical character recognition might allow full non-visual description of labeled nodes and edges.
- Controlled user studies with visually impaired participants would be required to verify whether segmentation accuracy produces measurable accessibility gains.
Load-bearing premise
That high performance on synthetic node-link diagrams will transfer to real-world bitmap images and that pixel-level segmentation alone is sufficient to enable effective assistive interfaces.
What would settle it
Running the trained models on a held-out set of real published node-link diagram images and measuring per-pixel accuracy substantially below 93 percent, or finding that the resulting segmentations do not improve non-visual task performance in user testing.
Figures
read the original abstract
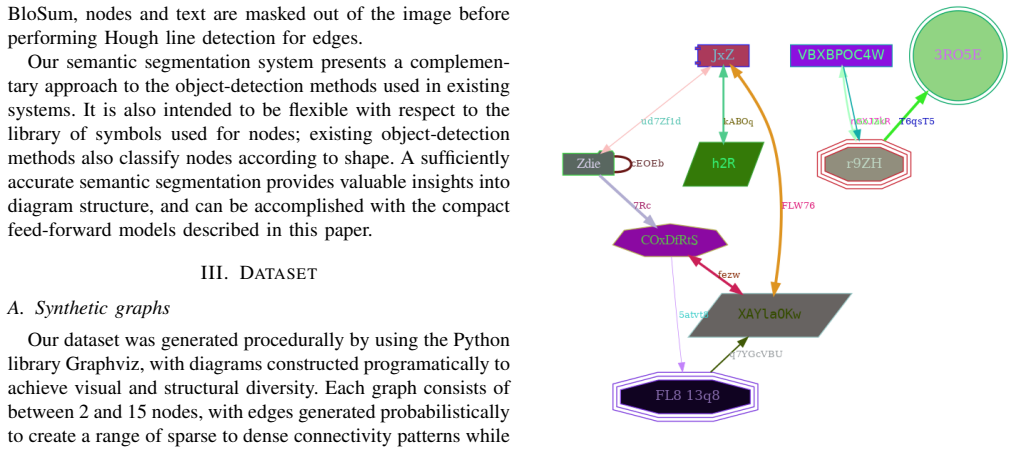
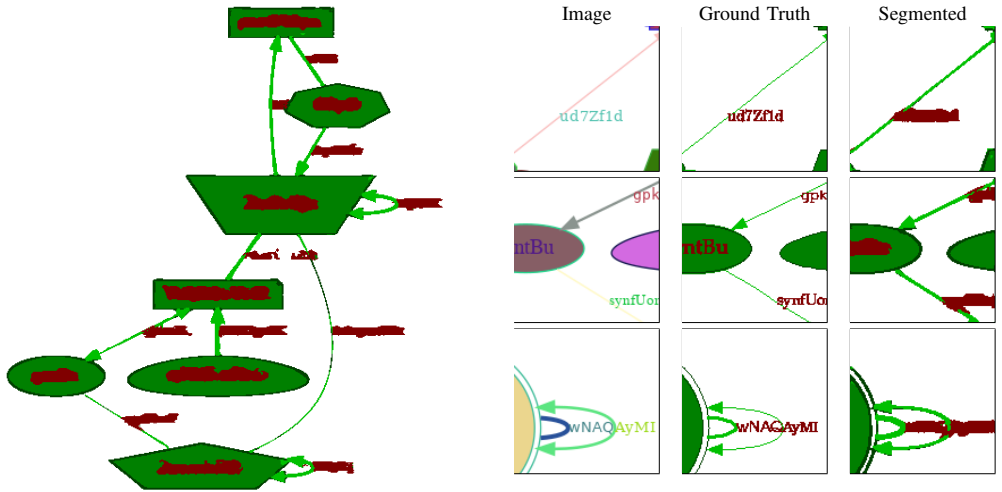
In this paper, we present a novel set of related models for semantic segmentation of node-link diagrams. These diagrams are frequently used to represent mathematical graphs, relationships between concepts, and flowcharts. Such diagrams are difficult to access non-visually; while some assistive interfaces have been designed for node-link diagrams, they rely upon a machine-readable representation of the diagram, whereas such diagrams will generally be made available as bitmap images. Our compact deep learning models show excellent quantitative and qualitative performance on a large synthetic dataset of node-link diagrams, reaching per-pixel accuracy over 93\%.
Editorial analysis
A structured set of objections, weighed in public.
Referee Report
Summary. The manuscript introduces a set of compact deep learning models for semantic segmentation of node-link diagrams (graphs, concept maps, flowcharts) to enable non-visual assistive interfaces. The central claim is that these models achieve excellent quantitative and qualitative performance, with per-pixel accuracy exceeding 93%, when evaluated on a large synthetic dataset of node-link diagrams.
Significance. If the reported accuracy holds under distribution shift to real bitmap diagrams and if the segmentation output can be integrated into usable assistive interfaces, the work would address a genuine accessibility gap. The synthetic-data approach is a reasonable starting point for controlled experiments, but the absence of real-world validation or efficacy testing substantially reduces the immediate significance for the assistive-technology framing.
major comments (2)
- [Abstract] Abstract: The performance claim (>93% per-pixel accuracy) is stated without any description of model architecture, training procedure, loss function, baselines, or error analysis. This information is load-bearing for assessing whether the result constitutes a technical contribution.
- [Evaluation] Evaluation section (or equivalent): All quantitative and qualitative results are reported exclusively on synthetic data. No held-out real bitmap diagrams, no analysis of distribution shift (edge thickness, font variation, background noise), and no user studies or integration experiments with assistive interfaces are provided. These omissions directly undermine the assistive-technology motivation.
minor comments (1)
- [Abstract] The abstract refers to 'a novel set of related models' but does not clarify how the models differ from one another or from standard segmentation architectures; a brief comparison table would improve clarity.
Simulated Author's Rebuttal
We thank the referee for the constructive comments. We address each major point below, proposing revisions where they strengthen the manuscript without altering its core scope as a controlled study on synthetic data.
read point-by-point responses
-
Referee: [Abstract] Abstract: The performance claim (>93% per-pixel accuracy) is stated without any description of model architecture, training procedure, loss function, baselines, or error analysis. This information is load-bearing for assessing whether the result constitutes a technical contribution.
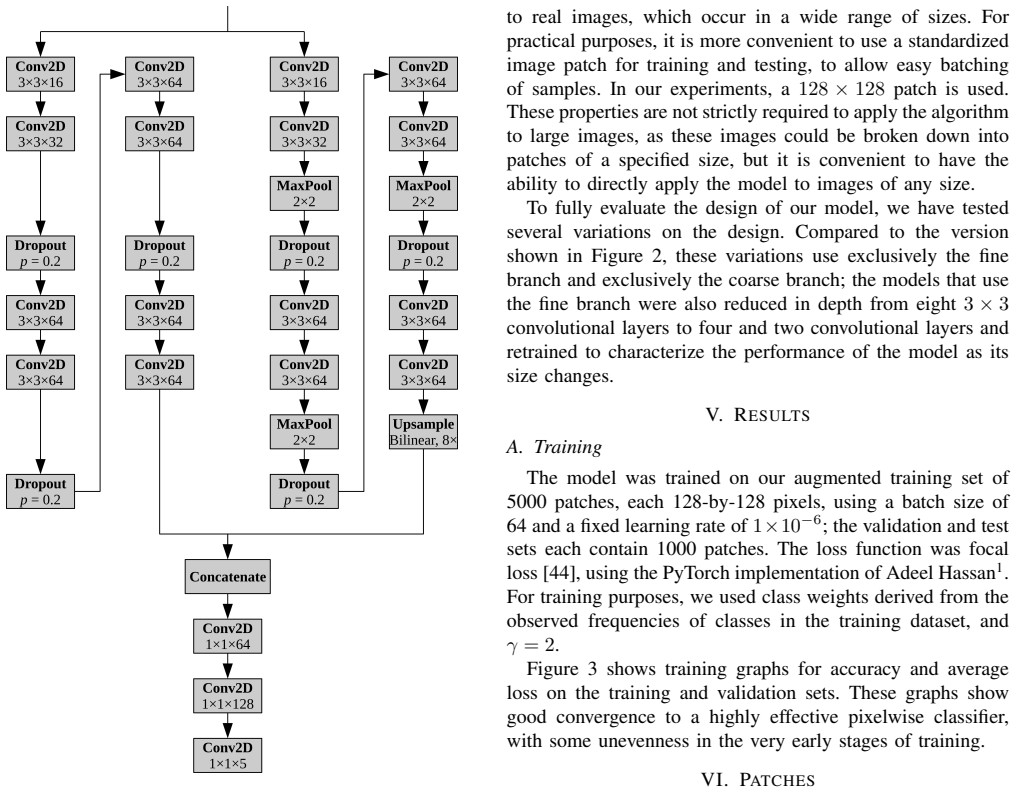
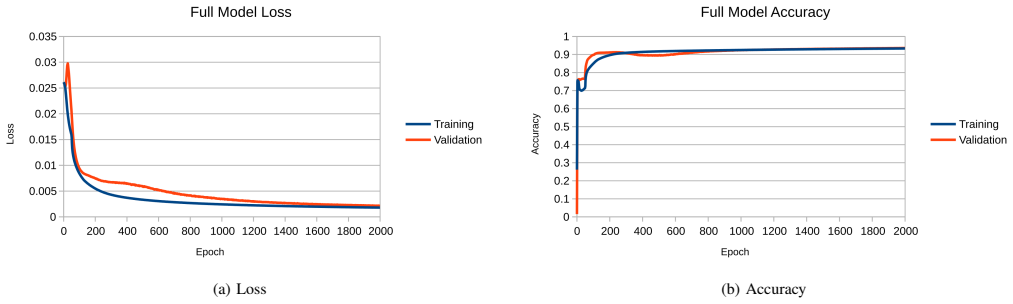
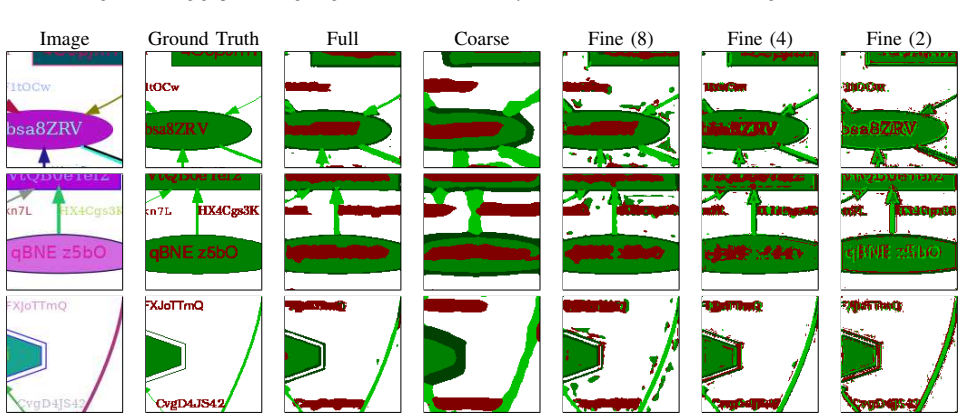
Authors: The abstract is intentionally concise due to length limits. Full details on the compact U-Net variants, training procedure (including loss functions such as cross-entropy with class weighting), baselines (standard segmentation models), and error analysis (per-class IoU and confusion matrices) appear in Sections 3 and 4. We will revise the abstract to add one sentence summarizing the architecture family and evaluation protocol to improve standalone readability. revision: yes
-
Referee: [Evaluation] Evaluation section (or equivalent): All quantitative and qualitative results are reported exclusively on synthetic data. No held-out real bitmap diagrams, no analysis of distribution shift (edge thickness, font variation, background noise), and no user studies or integration experiments with assistive interfaces are provided. These omissions directly undermine the assistive-technology motivation.
Authors: We agree that real-world validation would increase immediate applicability to assistive interfaces. The manuscript deliberately uses a large, procedurally generated synthetic dataset that incorporates controlled variations in line thickness, fonts, and layout to establish baseline performance and enable reproducible experiments. Section 5 already contains a limitations paragraph noting the synthetic-to-real gap. We will expand this section with explicit discussion of expected distribution shifts (e.g., edge thickness and background noise) and outline concrete next steps for real-diagram collection and interface integration, while keeping new experiments outside the current revision scope. revision: partial
Circularity Check
No circularity detected; empirical ML results on synthetic data
full rationale
The paper reports quantitative performance (per-pixel accuracy >93%) of compact deep learning models on a large synthetic dataset of node-link diagrams. No derivation chain, equations, fitted parameters presented as predictions, or self-referential steps appear in the abstract or described claims. The result is a standard empirical evaluation metric on held-out synthetic data rather than any first-principles derivation or self-definition. No self-citations, uniqueness theorems, or ansatzes are invoked as load-bearing elements. This is a normal non-circular finding for an applied computer vision paper.
Axiom & Free-Parameter Ledger
Reference graph
Works this paper leans on
-
[1]
Why a Diagram is (Sometimes) Worth Ten Thousand Words,
J. H. Larkin and H. A. Simon, “Why a Diagram is (Sometimes) Worth Ten Thousand Words,”Cognitive Science, vol. 11, pp. 65–100, Jan. 1987
1987
-
[2]
Learning from text with diagrams: Promoting mental model development and inference generation.,
K. R. Butcher, “Learning from text with diagrams: Promoting mental model development and inference generation.,”Journal of Educational Psychology, vol. 98, p. 182–197, Feb. 2006
2006
-
[3]
Bemyeyes
“Bemyeyes.” https://www.bemyeyes.com/
-
[4]
Cognitive load in interactive knowledge construction,
L. Verhoeven, W. Schnotz, and F. Paas, “Cognitive load in interactive knowledge construction,” vol. 19, no. 5, pp. 369–375
-
[5]
TADA: Mak- ing Node-link Diagrams Accessible to Blind and Low-Vision People,
Y . Zhao, M. A. Nacenta, M. A. Sukhai, and S. Somanath, “TADA: Mak- ing Node-link Diagrams Accessible to Blind and Low-Vision People,” Nov. 2023
2023
-
[6]
TeDUB: A System for Presenting and Exploring Technical Drawings for Blind People,
H. Petrie, C. Schlieder, P. Blenkhorn, G. Evans, A. King, A.-M. O’Neill, G. T. Ioannidis, B. Gallagher, D. Crombie, R. Mager, and M. Alafaci, “TeDUB: A System for Presenting and Exploring Technical Drawings for Blind People,” inComputers Helping People with Special Needs (K. Miesenberger, J. Klaus, and W. Zagler, eds.), (Berlin, Heidelberg), pp. 537–539, ...
2002
-
[7]
GSK: Universally accessible graph sketching,
S. P. Balik, S. P. Mealin, M. F. Stallmann, and R. D. Rodman, “GSK: Universally accessible graph sketching,” inProceeding of the 44th ACM Technical Symposium on Computer Science Education, SIGCSE ’13, (New York, NY , USA), pp. 221–226, Association for Computing Machinery, Mar. 2013
2013
-
[8]
Chart-Text: A Fully Auto- mated Chart Image Descriptor,
A. Balaji, T. Ramanathan, and V . Sonathi, “Chart-Text: A Fully Auto- mated Chart Image Descriptor,” Dec. 2018
2018
-
[9]
Block Diagram-to-Text: Understanding Block Diagram Images by Generating Natural Language Descriptors,
S. Bhushan and M. Lee, “Block Diagram-to-Text: Understanding Block Diagram Images by Generating Natural Language Descriptors,” AACL/IJCNLP, 2022
2022
-
[10]
A system for understanding imaged infographics and its applications,
W.-H. Huang and C. L. Tan, “A system for understanding imaged infographics and its applications,”ACM Symposium on Document En- gineering, pp. 9–18, Aug. 2007
2007
-
[11]
AutoChart: A Dataset for Chart-to-Text Generation Task,
J. Zhu, J. Ran, R. K.-W. Lee, K. T. W. Choo, and L. Zhi, “AutoChart: A Dataset for Chart-to-Text Generation Task,”Recent Advances in Natural Language Processing, Aug. 2021
2021
-
[12]
Chart decoder: Generating textual and numeric information from chart images automatically,
D. Dai, M. Wang, Z. Niu, and J. Zhang, “Chart decoder: Generating textual and numeric information from chart images automatically,” Journal of Visual Languages and Computing, vol. 48, pp. 101–109, Oct. 2018
2018
-
[13]
View: Visual Information Extraction Widget for improving chart images accessibility,
J. Gao, Y . Zhou, and K. E. Barner, “View: Visual Information Extraction Widget for improving chart images accessibility,” pp. 2865–2868, Sept. 2012
2012
-
[14]
ChartSense: Interactive Data Extraction from Chart Images,
D. Jung, W. Kim, H. Song, J.-i. Hwang, B. Lee, B. Kim, and J. Seo, “ChartSense: Interactive Data Extraction from Chart Images,” pp. 6706– 6717, May 2017
2017
-
[15]
Data Extraction from Charts via Single Deep Neural Network,
X. Liu, D. Klabjan, and P. Bless, “Data Extraction from Charts via Single Deep Neural Network,”arXiv: Computer Vision and Pattern Recognition, June 2019
2019
-
[16]
FigureSeer: Parsing Result-Figures in Research Papers,
N. Siegel, Z. Horvitz, R. Levin, S. K. Divvala, and A. Farhadi, “FigureSeer: Parsing Result-Figures in Research Papers,” pp. 664–680, Oct. 2016
2016
-
[17]
Diag2graph: Representing Deep Learning Diagrams In Research Papers As Knowledge Graphs,
A. Roy, I. Akrotirianakis, A. V . Kannan, D. Fradkin, A. Canedo, K. Koneripalli, and T. Kulahcioglu, “Diag2graph: Representing Deep Learning Diagrams In Research Papers As Knowledge Graphs,” in2020 IEEE International Conference on Image Processing (ICIP), pp. 2581– 2585, Oct. 2020
2020
-
[18]
Arrow R-CNN for Flowchart Recognition,
B. Sch ¨afer and H. Stuckenschmidt, “Arrow R-CNN for Flowchart Recognition,” in2019 International Conference on Document Analysis and Recognition Workshops (ICDARW), vol. 1, pp. 7–13, Sept. 2019
2019
-
[19]
Arrow R-CNN for handwritten diagram recognition,
B. Sch ¨afer, M. Keuper, and H. Stuckenschmidt, “Arrow R-CNN for handwritten diagram recognition,”International Journal on Document Analysis and Recognition (IJDAR), vol. 24, pp. 3–17, June 2021
2021
-
[20]
DiagramNet: Hand-Drawn Diagram Recognition Using Visual Arrow-Relation Detection,
B. Sch ¨afer and H. Stuckenschmidt, “DiagramNet: Hand-Drawn Diagram Recognition Using Visual Arrow-Relation Detection,” inDocument Analysis and Recognition – ICDAR 2021(J. Llad ´os, D. Lopresti, and S. Uchida, eds.), (Cham), pp. 614–630, Springer International Publish- ing, 2021
2021
-
[21]
Reverse-Engineering Visualizations: Recovering Visual Encodings from Chart Images,
J. Poco and J. Heer, “Reverse-Engineering Visualizations: Recovering Visual Encodings from Chart Images,”Computer Graphics F orum, vol. 36, pp. 353–363, June 2017
2017
-
[22]
ReVision: Automated classification, analysis and redesign of chart images,
M. Savva, N. Kong, A. Chhajta, F.-F. Li, M. Agrawala, and J. Heer, “ReVision: Automated classification, analysis and redesign of chart images,” pp. 393–402, Oct. 2011
2011
-
[23]
Towards Au- tomated Infographic Design: Deep Learning-based Auto-Extraction of Extensible Timeline,
C. Zhutian, Y . Wang, Q. Wang, Y . Wang, and H. Qu, “Towards Au- tomated Infographic Design: Deep Learning-based Auto-Extraction of Extensible Timeline,”IEEE Transactions on Visualization and Computer Graphics, pp. 1–1, 2019
2019
-
[24]
Dynamic Graph Generation Network: Generating Relational Knowledge from Diagrams,
D. Kim, Y . Yoo, J. Kim, S. Lee, and N. Kwak, “Dynamic Graph Generation Network: Generating Relational Knowledge from Diagrams,” in2018 IEEE/CVF Conference on Computer Vision and Pattern Recog- nition, pp. 4167–4175, June 2018
2018
-
[25]
Textbook Question Answering with Multi-modal Context Graph Understanding and Self-supervised Open- set Comprehension,
D. Kim, S. Kim, and N. Kwak, “Textbook Question Answering with Multi-modal Context Graph Understanding and Self-supervised Open- set Comprehension,” inProceedings of the 57th Annual Meeting of the Association for Computational Linguistics, (Florence, Italy), pp. 3568– 3584, Association for Computational Linguistics, 2019
2019
-
[26]
A Diagram is Worth a Dozen Images,
A. Kembhavi, M. Salvato, E. Kolve, M. Seo, H. Hajishirzi, and A. Farhadi, “A Diagram is Worth a Dozen Images,”European Con- ference on Computer Vision, pp. 235–251, Oct. 2016
2016
-
[27]
ISAAQ - Mastering Textbook Questions with Pre-trained Transformers and Bottom-Up and Top- Down Attention,
J. M. Gomez-Perez and R. Ortega, “ISAAQ - Mastering Textbook Questions with Pre-trained Transformers and Bottom-Up and Top- Down Attention,” inProceedings of the 2020 Conference on Empirical Methods in Natural Language Processing (EMNLP), (Online), pp. 5469– 5479, Association for Computational Linguistics, 2020
2020
-
[28]
GeoSQA: A Benchmark for Scenario-based Question Answering in the Geography Domain at High School Level,
Z. Huang, Y . Shen, X. Li, Y . Wei, G. Cheng, L. Zhou, X. Dai, and Y . Qu, “GeoSQA: A Benchmark for Scenario-based Question Answering in the Geography Domain at High School Level,”Conference on Empirical Methods in Natural Language Processing, pp. 5865–5870, Nov. 2019
2019
-
[29]
CoG-DQA: Chain-of-Guiding Learning with Large Language Models for Diagram Question Answering,
S. Wang, L. Zhang, L. Zhu, T. Qin, K.-H. Yap, X. Zhang, and J. Liu, “CoG-DQA: Chain-of-Guiding Learning with Large Language Models for Diagram Question Answering,” pp. 13969–13979
-
[30]
Diagram Perception Networks for Textbook Question Answering via Joint Optimization,
J. Ma, J. Liu, Q. Chai, P. Wang, and J. Tao, “Diagram Perception Networks for Textbook Question Answering via Joint Optimization,” vol. 132, no. 5, pp. 1578–1591
-
[31]
Symbol Detection in Online Handwritten Graphics Using Faster R-CNN,
F. D. Julca-Aguilar and N. S. T. Hirata, “Symbol Detection in Online Handwritten Graphics Using Faster R-CNN,” in2018 13th IAPR Inter- national Workshop on Document Analysis Systems (DAS), pp. 151–156, Apr. 2018
2018
-
[32]
Visualizing for the Non-Visual: Enabling the Visually Impaired to Use Visualization,
J. Choi, S. Jung, D. Park, J. Choo, and N. Elmqvist, “Visualizing for the Non-Visual: Enabling the Visually Impaired to Use Visualization,” Computer Graphics F orum, vol. 38, pp. 249–260, June 2019
2019
-
[33]
Exploring Chart Question Answering for Blind and Low Vision Users,
J. Kim, A. Srinivasan, N. W. Kim, and Y .-S. Kim, “Exploring Chart Question Answering for Blind and Low Vision Users,” inProceedings of the 2023 CHI Conference on Human Factors in Computing Systems, (Hamburg Germany), pp. 1–15, ACM, Apr. 2023
2023
-
[34]
TADA: Making Node-link Diagrams Accessible to Blind and Low-Vision Peo- ple,
Y . Zhao, M. A. Nacenta, M. A. Sukhai, and S. Somanath, “TADA: Making Node-link Diagrams Accessible to Blind and Low-Vision Peo- ple,” inProceedings of the 2024 CHI Conference on Human Factors in Computing Systems, CHI ’24, (New York, NY , USA), pp. 1–20, Association for Computing Machinery, May 2024
2024
-
[35]
Audiograf: A diagram-reader for the blind,
A. R. Kennel, “Audiograf: A diagram-reader for the blind,” inProceed- ings of the Second Annual ACM Conference on Assistive Technologies, Assets ’96, (New York, NY , USA), pp. 51–56, Association for Comput- ing Machinery, Apr. 1996
1996
-
[36]
Automated interpretation and accessible presentation of technical diagrams for blind people,
M. Horstmann, M. Lorenz, A. Watkowski, G. Ioannidis, O. Herzog, A. King, D. Evans, C. Hagen, C. Schlieder, A.-M. Burn, N. King, H. Petrie, S. Dijkstra, and D. Crombie, “Automated interpretation and accessible presentation of technical diagrams for blind people,”The New Review of Hypermedia and Multimedia, vol. 10, pp. 141–163, Dec. 2004
2004
-
[37]
Presenting UML Software Engineering Diagrams to Blind People,
A. King, P. Blenkhorn, D. Crombie, S. Dijkstra, G. Evans, and J. Wood, “Presenting UML Software Engineering Diagrams to Blind People,” inComputers Helping People with Special Needs(K. Miesenberger, J. Klaus, W. L. Zagler, and D. Burger, eds.), (Berlin, Heidelberg), pp. 522–529, Springer, 2004
2004
-
[38]
Providing interactive access to architectural floorplans for blind people,
H. Petrie, N. King, A.-M. Burn, and P. Pavan, “Providing interactive access to architectural floorplans for blind people,”British Journal of Visual Impairment, vol. 24, pp. 4–11, Jan. 2006
2006
-
[39]
Including blind people in computing through access to graphs,
S. P. Balik, S. P. Mealin, M. F. Stallmann, R. D. Rodman, M. L. Glatz, and V . J. Sigler, “Including blind people in computing through access to graphs,” inProceedings of the 16th International ACM SIGACCESS Conference on Computers & Accessibility, ASSETS ’14, (New York, NY , USA), pp. 91–98, Association for Computing Machinery, Oct. 2014
2014
-
[40]
PLUMB: An interface for users who are blind to display, create, and modify graphs,
M. Calder, R. F. Cohen, J. Lanzoni, and Y . Xu, “PLUMB: An interface for users who are blind to display, create, and modify graphs,” in Proceedings of the 8th International ACM SIGACCESS Conference on Computers and Accessibility, Assets ’06, (New York, NY , USA), pp. 263–264, Association for Computing Machinery, Oct. 2006
2006
-
[41]
PLUMB: Displaying graphs to the blind using an active auditory interface,
R. F. Cohen, R. Yu, A. Meacham, and J. Skaff, “PLUMB: Displaying graphs to the blind using an active auditory interface,” inProceedings of the 7th International ACM SIGACCESS Conference on Computers and Accessibility, Assets ’05, (New York, NY , USA), pp. 182–183, Association for Computing Machinery, Oct. 2005
2005
-
[42]
Teaching graphs to visually impaired students using an active auditory interface,
R. F. Cohen, A. Meacham, and J. Skaff, “Teaching graphs to visually impaired students using an active auditory interface,”SIGCSE Bull., vol. 38, pp. 279–282, Mar. 2006
2006
-
[43]
Using an audio interface to assist users Who are visually impaired with steering tasks,
R. F. Cohen, V . Haven, J. A. Lanzoni, A. Meacham, J. Skaff, and M. Wissell, “Using an audio interface to assist users Who are visually impaired with steering tasks,” inProceedings of the 8th International ACM SIGACCESS Conference on Computers and Accessibility, Assets ’06, (New York, NY , USA), pp. 119–124, Association for Computing Machinery, Oct. 2006
2006
-
[44]
Focal loss for dense object detection,
T.-Y . Lin, P. Goyal, R. Girshick, K. He, and P. Dollar, “Focal loss for dense object detection,” inProceedings of the IEEE International Conference on Computer Vision (ICCV), Oct 2017
2017
-
[45]
Tactile graphics project
Richard Ladner, Melody Ivory-Ndiaye, Raj Rao, Sheryl Burgstahler, Sangyun Hahn, Beverly Slablosky, Matt Renzelmann, Satria Krisnandi, Maha Ramasamy, Jack Hebert, Jacob Christensen, Eileen Hash, Terri Moore, Andy Jaya, “Tactile graphics project.” https://tactilegraphics.cs.washington.edu/. University of Washington
-
[46]
Chart4blind: An intelligent interface for chart accessibility conversion,
O. Moured, M. Baumgarten-Egemole, K. M ¨uller, A. Roitberg, T. Schwarz, and R. Stiefelhagen, “Chart4blind: An intelligent interface for chart accessibility conversion,” inProceedings of the 29th Interna- tional Conference on Intelligent User Interfaces, pp. 504–514, 2024
2024
-
[47]
Conditional random fields as recurrent neural networks,
S. Zheng, S. Jayasumana, B. Romera-Paredes, V . Vineet, Z. Su, D. Du, C. Huang, and P. H. Torr, “Conditional random fields as recurrent neural networks,” inProceedings of the IEEE international conference on computer vision, pp. 1529–1537, 2015
2015
discussion (0)
Sign in with ORCID, Apple, or X to comment. Anyone can read and Pith papers without signing in.