Weibull-Stationary Stochastic Differential Equations for Conditional Long-Horizon Wind Power Forecasting
Pith reviewed 2026-06-27 07:51 UTC · model grok-4.3
The pith
Three Weibull-stationary SDE models for wind speed yield equivalent probabilistic accuracy in power forecasts, so the fastest one can be used without loss of fidelity.
A machine-rendered reading of the paper's core claim, the machinery that carries it, and where it could break.
Core claim
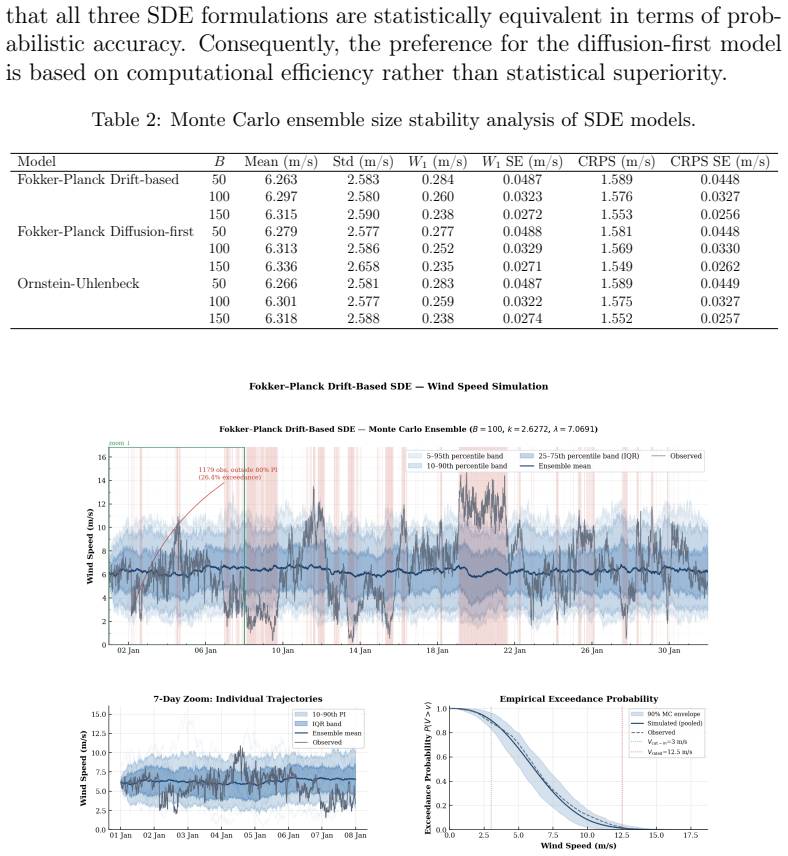
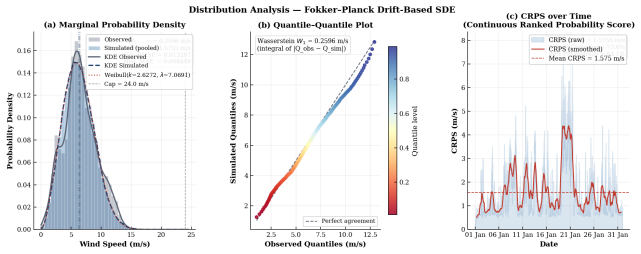
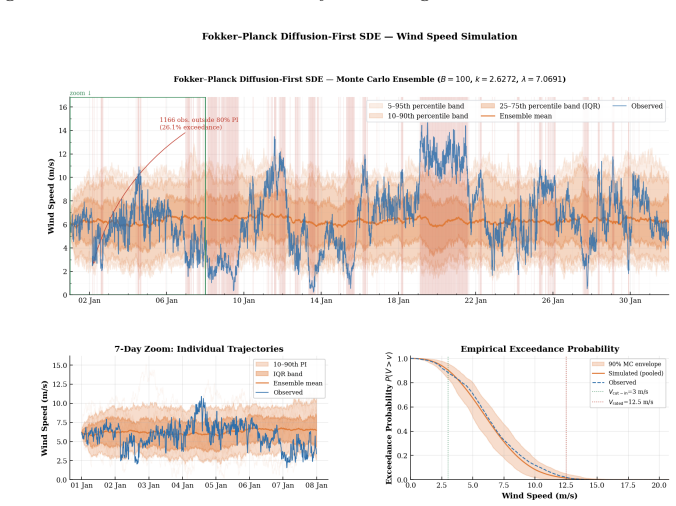
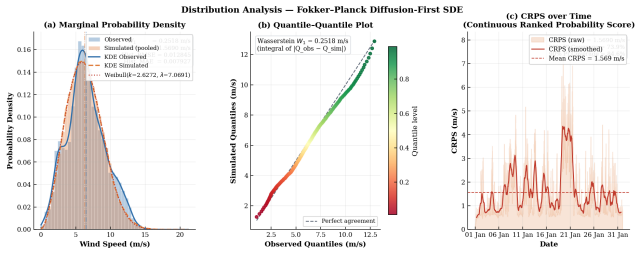
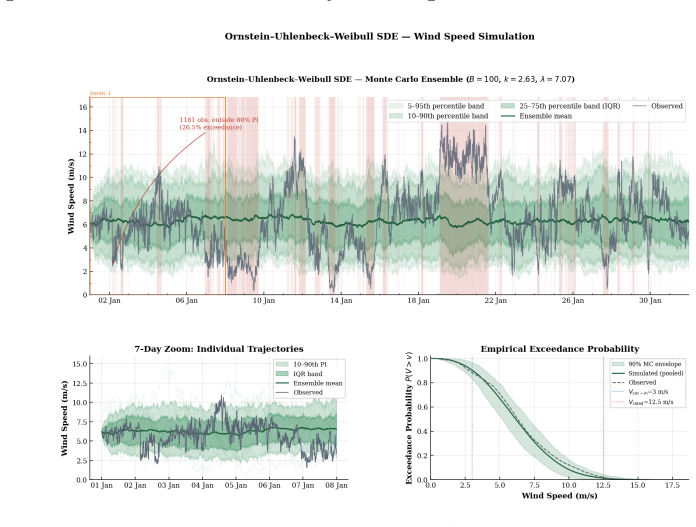
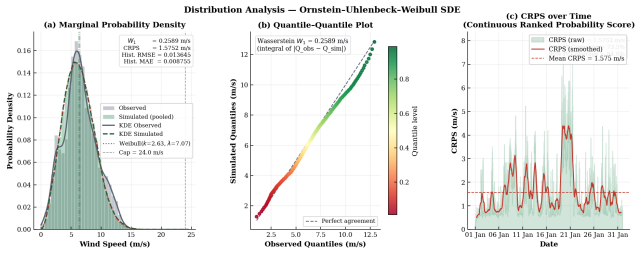
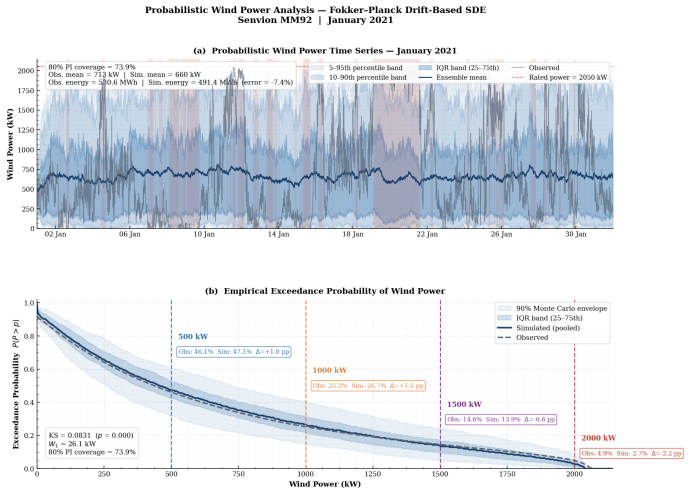
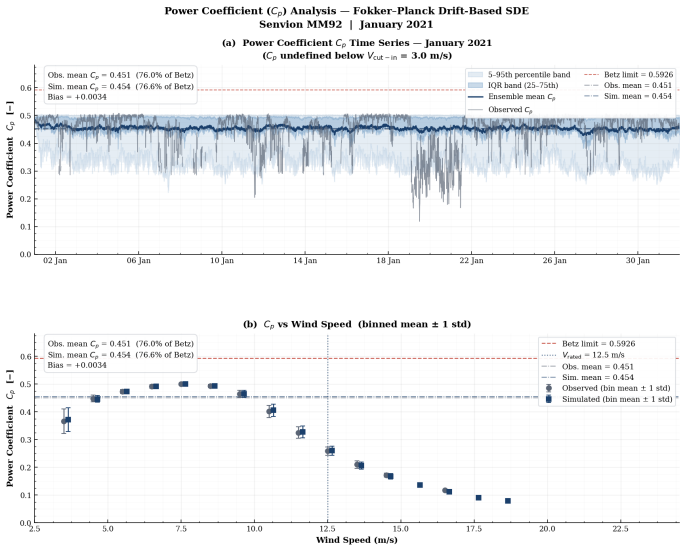
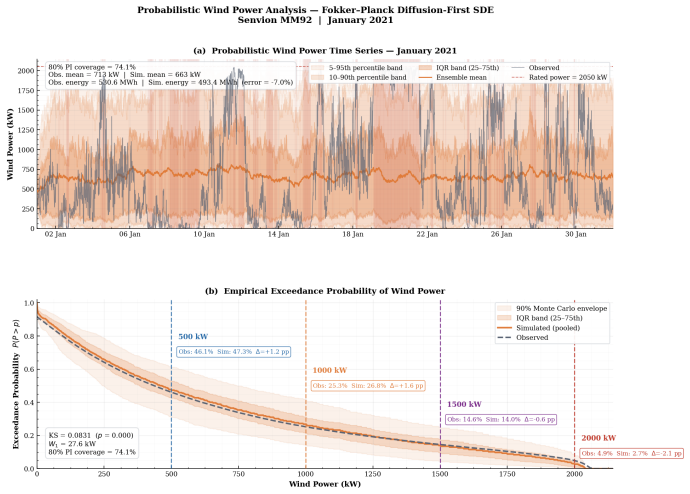
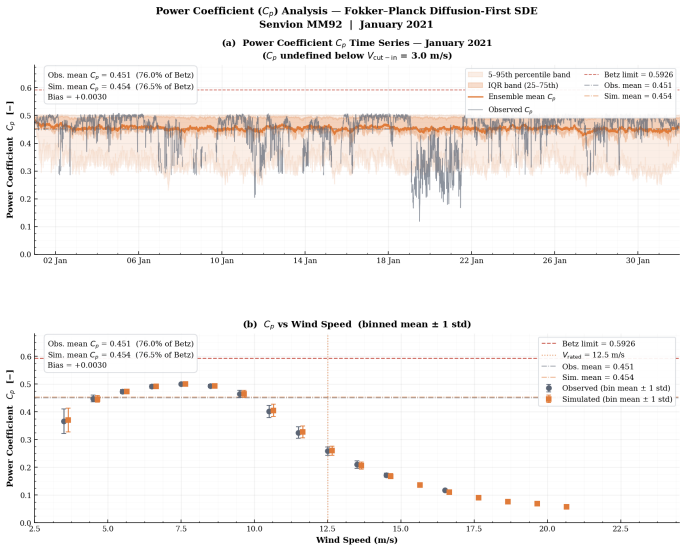
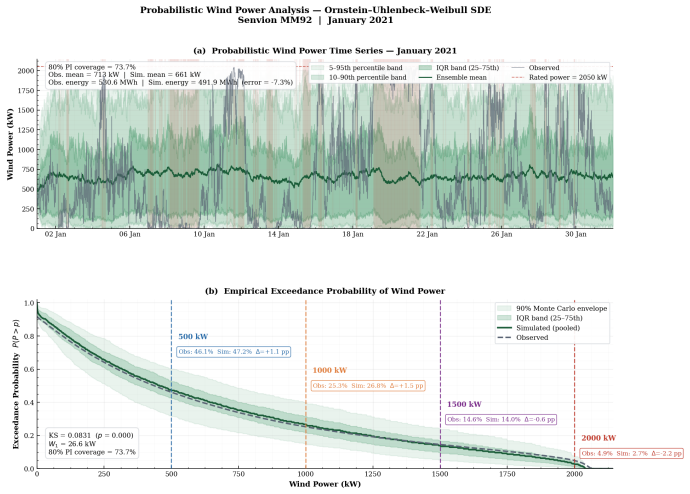
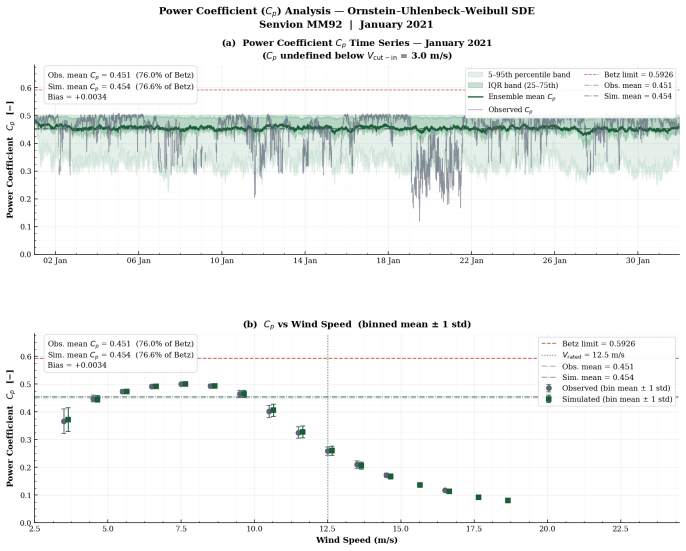
Conditional on the MMSE forecasted Weibull invariant law, the Ornstein-Uhlenbeck-Weibull transform, the Fokker-Planck drift-first diffusion, and the Fokker-Planck diffusion-first model generate wind-speed ensembles whose power-mapped distributions are statistically indistinguishable, with mean CRPS values between 1.569 and 1.575 m/s; the diffusion-first model is therefore preferred on computational grounds, reducing runtime by about a factor of seven, while Wasserstein distances in the power domain remain 26.1-27.6 kW (below 1.4% of rated capacity) and exceedance-probability errors stay below 1.6 percentage points over the 0-1500 kW range.
What carries the argument
The diffusion-first Fokker-Planck SDE for positive wind speeds conditioned on the forecasted Weibull invariant law, which matches the accuracy of the OU-Weibull and drift-first alternatives at lower computational cost.
If this is right
- The diffusion-first model can be substituted for the OU-Weibull or drift-first formulations without degrading probabilistic accuracy.
- Exceedance-probability errors remain below 1.6 percentage points over the 0-1500 kW range and rise to about 2.2 percentage points near rated power.
- Monthly energy-yield bias stays around -7.3% for the examined month.
- The resulting probability distributions supply decision-relevant inputs for reserve, storage, market, or fatigue problems rather than solving those problems outright.
- Full marginalisation over the Kalman predictive law of the Weibull parameters is a direct next step left open by the work.
Where Pith is reading between the lines
- The same conditioning strategy on a forecasted invariant law could be tested on solar irradiance or wave-height series to check whether computational savings appear in other renewable domains.
- Direct insertion of the SDE ensembles into unit-commitment or storage-sizing optimisers would reveal whether the reported Wasserstein distances translate into measurable operational gains.
- The Godambe covariance correction for parameter estimation from autocorrelated SCADA data may extend to other short-term renewable forecasting pipelines that rely on monthly distributional fits.
- Repeating the comparison across multiple turbines and seasons would test whether the observed equivalence of the three SDEs is specific to the January 2021 Kelmarsh data or holds more generally.
Load-bearing premise
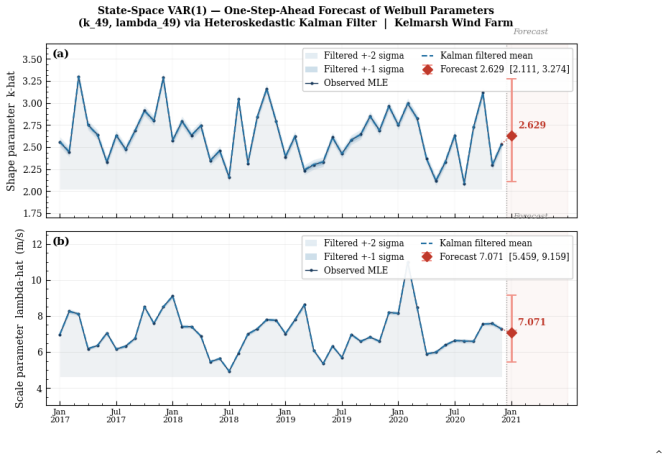
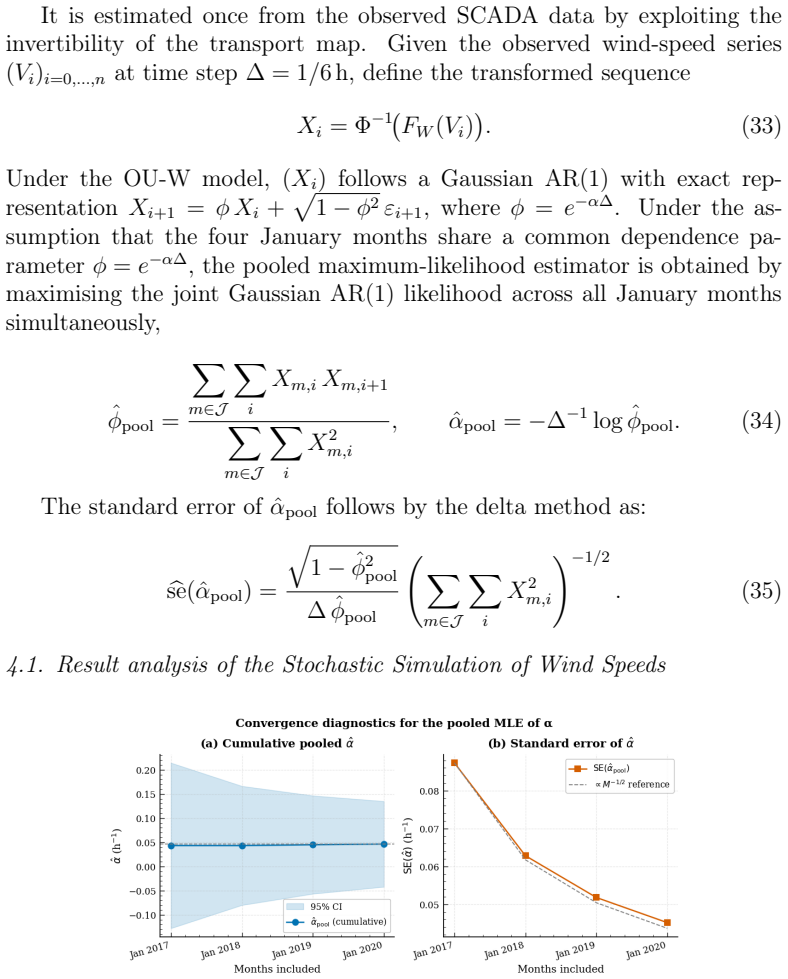
The monthly Weibull shape and scale parameters estimated from serially dependent SCADA data and forecasted by the heteroskedastic Kalman filter on a bivariate VAR(1) model are accurate enough that conditioning the SDE models on their MMSE values produces simulated power distributions that match observed data.
What would settle it
A statistically significant difference in mean CRPS larger than 0.01 m/s or a Wasserstein distance above 30 kW between the diffusion-first model and either of the other two models on an independent test month would falsify the claim of statistical indistinguishability.
Figures
read the original abstract
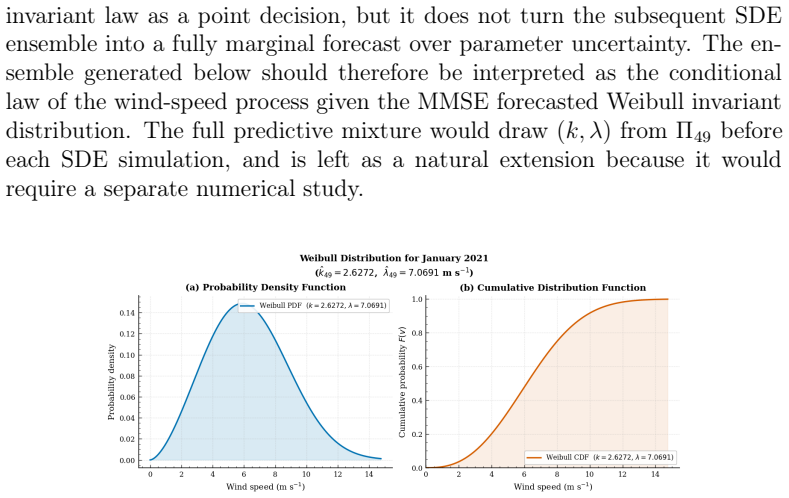
We present a one-month-ahead conditional probabilistic framework for wind-power forecasting at ten-minute resolution. Monthly Weibull shape and scale parameters are estimated from serially dependent SCADA wind-speed data, corrected through a Godambe covariance, and forecast by a heteroskedastic Kalman filter on a bivariate VAR(1) state-space model. Conditional on the MMSE forecasted Weibull invariant law, we construct and compare three positive wind-speed SDE models: an Ornstein-Uhlenbeck-Weibull transform, a Fokker-Planck drift-first diffusion, and a Fokker-Planck diffusion-first model. The simulated wind-speed ensembles are mapped to power through a calibrated XGBoost power curve. Applied to January 2021 data from a Senvion MM92 turbine at Kelmarsh Wind Farm, the three SDE formulations are statistically indistinguishable in probabilistic accuracy, with mean CRPS values between 1.569 and 1.575 m/s. The diffusion-first model is therefore preferred on computational grounds, reducing runtime by about a factor of seven relative to the OU-Weibull model. In the power domain, the Wasserstein distance between simulated and observed distributions is 26.1-27.6 kW, below $1.4\%$ of rated capacity, while the monthly energy-yield bias is about $-7.3\%$ for the examined month. Exceedance-probability errors remain below 1.6 percentage points over the 0-1500 kW range and about 2.2 percentage points near rated power. These quantities provide decision-relevant probabilistic inputs for downstream operational problems, rather than completed reserve, storage, market, or fatigue-optimization decisions. Full marginalisation over the Kalman predictive law of the Weibull parameters is left as a natural extension.
Editorial analysis
A structured set of objections, weighed in public.
Referee Report
Summary. The manuscript presents a one-month-ahead conditional probabilistic framework for wind-power forecasting at ten-minute resolution. Monthly Weibull shape and scale parameters are estimated from serially dependent SCADA data with Godambe covariance correction, then forecasted via a heteroskedastic Kalman filter on a bivariate VAR(1) state-space model. Conditional on the MMSE forecasted Weibull invariant law, three positive wind-speed SDE models are constructed and compared: an Ornstein-Uhlenbeck-Weibull transform, a Fokker-Planck drift-first diffusion, and a Fokker-Planck diffusion-first model. Simulated wind-speed ensembles are mapped to power through a calibrated XGBoost power curve. On January 2021 data from a Senvion MM92 turbine at Kelmarsh Wind Farm, the three SDE formulations yield statistically indistinguishable probabilistic accuracy (mean CRPS 1.569–1.575 m/s). The diffusion-first model is preferred for reducing runtime by a factor of approximately seven. In the power domain, Wasserstein distances are 26.1–27.6 kW (<1.4% of rated capacity), monthly energy bias is about −7.3%, and exceedance-probability errors remain below 2.2 percentage points.
Significance. If the reported metrics hold after addressing parameter uncertainty, the framework provides a computationally tractable route to generating decision-relevant probabilistic wind-power ensembles by combining stochastic differential equations, state-space forecasting, and machine-learned power curves. The explicit identification of the diffusion-first model as runtime-efficient and the deferral of full marginalization constitute clear, actionable contributions to applied stochastic modeling in renewables.
major comments (2)
- [Abstract] Abstract: The central performance claims (CRPS range 1.569–1.575 m/s, Wasserstein distances 26.1–27.6 kW, energy bias −7.3%) are obtained by simulating the three SDEs conditioned solely on the MMSE point forecast of the Weibull shape/scale pair. Because the heteroskedastic Kalman filter on the VAR(1) state-space model produces a non-degenerate predictive covariance (after Godambe correction for serial dependence), the reported ensembles omit integration over the full predictive law of the Weibull parameters. This omission is load-bearing for the claimed statistical indistinguishability and sub-1.4% capacity error; the abstract correctly flags full marginalization as future work, but the current metrics therefore reflect a narrower conditional law than the one-step-ahead predictive distribution.
- [Results] Results section (implied by abstract claims): The statement that the three SDE formulations are “statistically indistinguishable” rests on CRPS values differing by at most 0.006 m/s. No standard errors, bootstrap intervals, or formal pairwise tests on the CRPS differences are referenced, making it impossible to assess whether the observed similarity exceeds sampling variability of the 10-minute ensemble evaluation.
minor comments (2)
- [Abstract] Abstract: The phrases “about a factor of seven” and “about −7.3%” would be more precise if replaced by exact reported values or accompanied by uncertainty measures.
- [Methods] Notation: The distinction between the three Fokker-Planck formulations (drift-first vs. diffusion-first) would benefit from an explicit equation reference or short table summarizing the drift and diffusion coefficients for each model.
Simulated Author's Rebuttal
We thank the referee for their careful and constructive review. We address each major comment below, indicating whether revisions will be incorporated.
read point-by-point responses
-
Referee: [Abstract] The central performance claims are obtained by simulating the three SDEs conditioned solely on the MMSE point forecast of the Weibull shape/scale pair. The reported ensembles omit integration over the full predictive law of the Weibull parameters. This omission is load-bearing for the claimed statistical indistinguishability; the abstract correctly flags full marginalization as future work, but the current metrics reflect a narrower conditional law than the one-step-ahead predictive distribution.
Authors: We thank the referee for this observation. The manuscript explicitly presents a conditional framework in which ensembles are generated given the MMSE forecast of the monthly Weibull parameters; this conditioning is stated in the abstract, methods, and results. Full marginalization over the Kalman predictive covariance is correctly identified as future work owing to its computational cost. The reported CRPS, Wasserstein, and bias metrics are therefore accurate for the conditional model as implemented, which remains a tractable and decision-relevant contribution. No change to the scope or claims is required. revision: no
-
Referee: [Results] The statement that the three SDE formulations are “statistically indistinguishable” rests on CRPS values differing by at most 0.006 m/s. No standard errors, bootstrap intervals, or formal pairwise tests on the CRPS differences are referenced, making it impossible to assess whether the observed similarity exceeds sampling variability of the 10-minute ensemble evaluation.
Authors: We agree that uncertainty quantification on the CRPS differences would strengthen the indistinguishability claim. In the revised manuscript we will add bootstrap standard errors (resampling the 10-minute evaluation periods) for the reported CRPS values of each SDE model and will note whether the observed 0.006 m/s spread lies within these intervals. revision: yes
Circularity Check
No significant circularity; forecasting setup is self-contained against out-of-sample data.
full rationale
The derivation estimates monthly Weibull parameters from historical SCADA data (with Godambe correction), fits a VAR(1) Kalman filter to the resulting time series of past monthly estimates, produces an MMSE forecast of the next month's parameters, conditions the three SDE models on that forecasted invariant law, simulates ensembles, and maps them via a separately calibrated XGBoost power curve. Performance (CRPS, Wasserstein) is then measured on the held-out January 2021 observations. Because the target month's Weibull law is forecasted rather than estimated from the evaluation data itself, and because the paper explicitly flags full marginalization over the Kalman predictive distribution as future work, none of the central objects reduce by construction to the evaluation quantities. The indistinguishability of the SDE variants follows directly from their shared stationary law rather than from any self-referential fitting step. This is a standard out-of-sample forecasting pipeline with an acknowledged approximation; no load-bearing claim collapses to a fit on the reported metrics.
Axiom & Free-Parameter Ledger
free parameters (3)
- monthly Weibull shape and scale parameters
- VAR(1) state-space parameters
- XGBoost power-curve parameters
axioms (2)
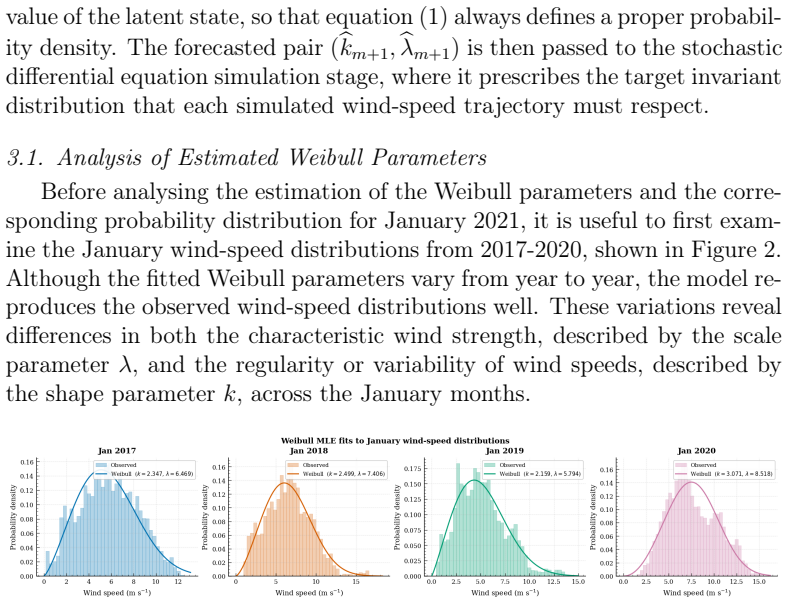
- domain assumption Wind-speed process admits a stationary Weibull distribution within each calendar month
- standard math Fokker-Planck equation governs the evolution of the probability density for the chosen SDE drift and diffusion terms
Reference graph
Works this paper leans on
-
[1]
Jakhmola, A., Jewell, J., Vinichenko, V. et al. Probabilistic pro- jections of global wind and solar power growth based on historical national experience. Nat Energy (2026). DOI:https://doi.org/10. 1038/s41560-026-02021-w
2026
-
[2]
Selvaraj, J., Muthuramalingam, L., Karthikeyan, V. et al. Optimiz- ing Wind Energy Integration: A Review of Forecasting Techniques and Emerging Trends. Arch Computat Methods Eng 33, 4261–4286 (2026). DOI:https://doi.org/10.1007/s11831-025-10442-1
-
[3]
Ai, C., He, S., Hu, H., Fan, X. and Wang, W. Chaotic time series wind power interval prediction based on quadratic decomposition and intel- ligent optimization algorithm. Chaos, Solitons & Fractals, 177, 114222 (2023). DOI:https://doi.org/10.1016/j.chaos.2023.114222
-
[5]
Xie, Y., Li, C., Li, M., Liu, F. and Taukenova, M. An overview of deter- ministic and probabilistic forecasting methods of wind energy. iScience, 26(1), 105804 (2023). DOI:https://doi.org/10.1016/j.isci.2022. 105804
-
[6]
Saeed, et al. Enhanced wind speed forecasting for sustainable power systems: A deep learning framework unifying deterministic predictions 40 anduncertaintyquantification.Energy, 335, 137979(2025).DOI:https: //doi.org/10.1016/j.energy.2025.137979
-
[7]
Dantas, G. and Browell, J. Seamless Short- to Mid-Term Probabilis- tic Wind Power Forecasting. Wind Energy, 29(2), e70079 (2026). DOI: https://doi.org/10.1002/we.70079
-
[8]
and Oral, B
Arslan Tuncar, E., Sağlam, Ş. and Oral, B. A review of short-term wind power generation forecasting methods in recent technological trends. Energy Reports, 12, 197-209 (2024). DOI:https://doi.org/10.1016/ j.egyr.2024.06.006
2024
-
[9]
Guo, X., Zeng, P., Xiong, X., Wang, G. and Cui, Y. Short-term wind power forecasting methods based on machine learning: A review and case study. Energy Reports, 14, 3753-3782 (2025). DOI:https://doi. org/10.1016/j.egyr.2025.10.040
-
[10]
and Di Persio, L
Ghadiri, M. and Di Persio, L. Hybrid SDE-Neural Networks for Inter- pretable Wind Power Prediction Using SCADA Data. Electricity, 6(3), 48 (2025). URL:https://www.mdpi.com/2673-4826/6/3/48
2025
-
[11]
Di Persio, L., Fraccarolo, N. and Veronese, A. Wind Energy Production in Italy: A Forecasting Approach Based on Fractional Brownian Motion andGenerativeAdversarialNetworks.Mathematics, 12(13)(2024).DOI: https://doi.org/10.3390/math12132105
-
[12]
and Cirio, D
Ceresa, G., Trevisiol, A., Rapizza, M.R. and Cirio, D. Stochastic Sim- ulation of Wind Power Profiles from Time Series Analysis Consid- ering Dependencies on Meteorological Variables. In: Pong, P. (eds) Renewable Energy Resources and Conservation. Green Energy and Technology. Springer, Cham (2024). DOI:https://doi.org/10.1007/ 978-3-031-59005-4_10
2024
-
[13]
Iversen, E.B., Morales, J.M., Møller, J.K., Trombe, P.-J.andMadsen, H. Leveraging stochastic differential equations for probabilistic forecasting of wind power using a dynamic power curve. Wind Energy, 20, 33-44 (2017). DOI:https://doi.org/10.1002/we.1988
-
[14]
Wu, Y., Du, W., Wu, W., Yin, T., Wang, Y. and Li, P. Medium and Long-Term Power Generation Forecasting and Operation Strategies for 41 Wind Farms Based on Deep Learning. In: 2025 IEEE 2nd International Conference on Deep Learning and Computer Vision (DLCV), pp. 1-6 (2025). DOI:https://doi.org/10.1109/DLCV65218.2025.11088843
-
[15]
Ladopoulou, D., Hong, D.M. and Dellaportas, P. Probabilistic Wind Power Modelling via Heteroscedastic Non-Stationary Gaussian Pro- cesses. arXiv preprint arXiv:2505.09026 (2025). Available at:https: //arxiv.org/abs/2505.09026
arXiv 2025
-
[16]
Zárate-Miñano, R., Anghel, M. and Milano, F. Continuous wind speed models based on stochastic differential equations. Applied Energy, 104, 42-49 (2013). DOI:https://doi.org/10.1016/j.apenergy.2012.10. 064
-
[18]
Arenas-López, J.P. and Badaoui, M. A Fokker–Planck equation based approach for modelling wind speed and its power output. Energy Con- version and Management, 222, 113152 (2020). DOI:https://doi.org/ 10.1016/j.enconman.2020.113152
-
[19]
Arenas-López, J.P. and Badaoui, M. The Ornstein-Uhlenbeck process for estimating wind power under a memoryless transformation. Energy, 213, 118842 (2020). DOI:https://doi.org/10.1016/j.energy.2020. 118842
-
[20]
Available at: https://zenodo.org/records/5841834
Peder Bacher,Wind Turbine SCADA Datasets, 2022. Available at: https://zenodo.org/records/5841834. Accessed August 28, 2024
arXiv 2022
-
[21]
Morrison, R., Liu, X. and Lin, Z. Anomaly detection in wind turbine SCADA data for power curve cleaning. Renewable Energy, 184, 473-486 (2022). DOI:https://doi.org/10.1016/j.renene.2021.11.118
-
[22]
Gill, S., Stephen, B. and Galloway, S. Wind Turbine Condition Assess- ment Through Power Curve Copula Modeling. IEEE Transactions on Sustainable Energy, 3(1), 94-101 (2012). DOI:https://doi.org/10. 1109/TSTE.2011.2167164. 42
arXiv 2012
- [23]
-
[24]
and Bossanyi, E.Wind Energy Handbook
Burton, T., Jenkins, N., Sharpe, D. and Bossanyi, E.Wind Energy Handbook. 2nd ed. Wiley (2011). DOI:https://doi.org/10.1002/ 9781119992714
2011
-
[25]
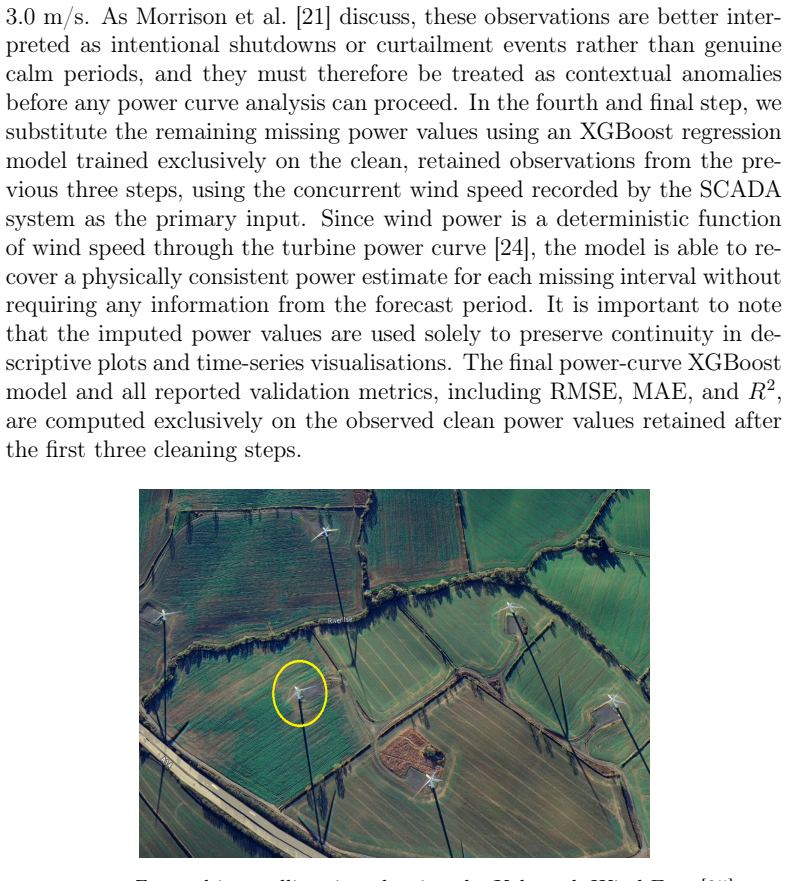
Available at:https://maps.google.com
Google Maps.Kelmarsh Wind Farm, Northamptonshire, United King- dom. Available at:https://maps.google.com. Accessed: 20 May 2026
2026
-
[26]
Senvion MM92 Wind Turbine Specifications,Wind Turbine Mod- els, available athttps://en.wind-turbine-models.com/turbines/ 889-senvion-mm92, accessed on March 22, 2026
2026
-
[27]
Seguro and T.W
J.V. Seguro and T.W. Lambert,Modern estimation of Weibull param- eters for wind energy applications, Wind Engineering, 24(4), 247-262,
-
[28]
DOI:https://doi.org/10.1260/0309524001495620
-
[29]
Carta, P
J.A. Carta, P. Ramírez, and S. Velázquez,A review of wind speed proba- bility distributions used in wind energy analysis, Renewable and Sustain- able Energy Reviews, 13(5), 933-955, 2009. DOI:https://doi.org/10. 1016/j.rser.2008.02.005
2009
-
[31]
Ramírez, P. and Carta, J.A. Influence of the data sampling interval in the estimation of the parameters of the Weibull wind speed probabil- ity density distribution: a case study. Energy Conversion and Manage- ment, 46(15), 2419-2438 (2005). DOI:https://doi.org/10.1016/j. enconman.2004.11.004
work page doi:10.1016/j 2005
-
[32]
Maximum Likelihood Estimation of Misspecified Models
White, H. Maximum Likelihood Estimation of Misspecified Models. Econometrica, 50(1), 1-25 (1982). DOI:https://doi.org/10.2307/ 1912526. 43
1982
-
[33]
Heteroskedasticity and Autocorrelation Consistent Covariance Matrix Estimation
Andrews, D.W.K. Heteroskedasticity and Autocorrelation Consistent Covariance Matrix Estimation. Econometrica, 59(3), 817-858 (1991). DOI:https://doi.org/10.2307/2938229
-
[34]
Springer, Berlin Heidelberg (2005)
Lütkepohl, H.New Introduction to Multiple Time Series Analysis. Springer, Berlin Heidelberg (2005). DOI:https://doi.org/10.1007/ 978-3-540-27752-1
2005
-
[35]
and Casella, G.Theory of Point Estimation
Lehmann, E.L. and Casella, G.Theory of Point Estimation. 2nd ed. Springer New York (1998). ISBN: 978-0-387-98502-2
1998
-
[36]
A New Approach to Linear Filtering and Prediction Prob- lems
Kalman, R.E. A New Approach to Linear Filtering and Prediction Prob- lems. Journal of Basic Engineering, 82(1), 35-45 (1960)
1960
-
[37]
Carta, J.A., Ramírez, P. and Velázquez, S. A review of wind speed prob- ability distributions used in wind energy analysis: Case studies in the Canary Islands. Renewable and Sustainable Energy Reviews, 13(5), 933- 955 (2009). DOI:https://doi.org/10.1016/j.rser.2008.05.005
-
[38]
Haessig, P., Multon, B., Ahmed, H.B., Lascaud, S. and Bondon, P. Energy storage sizing for wind power: impact of the autocorrelation of day-ahead forecast errors. Wind Energy, 18, 43-57 (2015). DOI:https: //doi.org/10.1002/we.1680
-
[39]
Risken, H.The Fokker-Planck Equation: Methods of Solution and Ap- plications. 2nd ed. Springer, Berlin (1996). ISBN: 978-3-540-61530-9
1996
-
[40]
Xiong, X., Guo, X., Zeng, P., Zou, R. and Wang, X. A Short-Term Wind Power Forecast Method via XGBoost Hyper-Parameters Optimization. Frontiers in Energy Research, 10, 905155 (2022). DOI:https://doi. org/10.3389/fenrg.2022.905155
-
[41]
and Wu, Y
Zheng, H. and Wu, Y. A XGBoost Model with Weather Similarity Analysis and Feature Engineering for Short-Term Wind Power Fore- casting. Applied Sciences, 9, 3019 (2019). DOI:https://doi.org/10. 3390/app9153019
2019
-
[42]
Chen, T. and Guestrin, C. XGBoost: A Scalable Tree Boosting System. CoRR, abs/1603.02754 (2016). URL:http://arxiv.org/abs/1603. 02754. 44
Pith/arXiv arXiv 2016
-
[43]
ISBN: 0-534-24312-6
Casella, G.andBerger, R.L.Statistical Inference.2nded.DuxburyPress (2002). ISBN: 0-534-24312-6
2002
-
[44]
and Duck, P.Stochastic wind speed modelling for estimation of expected wind power output
Loukatou, A., Howell, S., Johnson, P. and Duck, P.Stochastic wind speed modelling for estimation of expected wind power output. Applied Energy, 228, 1328-1340 (2018). DOI:https://doi.org/10.1016/j.apenergy. 2018.06.117
-
[45]
Benth, F.E., Di Persio, L. and Lavagnini, S. Stochastic modeling of wind derivatives in energy markets. Risks, 6(2) (2018). DOI:https: //doi.org/10.3390/risks6020056. 45
discussion (0)
Sign in with ORCID, Apple, or X to comment. Anyone can read and Pith papers without signing in.