Graph Reduction in Multirelational Networks: A Spreading-Oriented Reduction Benchmark
Pith reviewed 2026-06-27 07:20 UTC · model grok-4.3
The pith
Graph reduction preserves seed set quality on single-layer networks but causes ranking degradation on multirelational networks.
A machine-rendered reading of the paper's core claim, the machinery that carries it, and where it could break.
Core claim
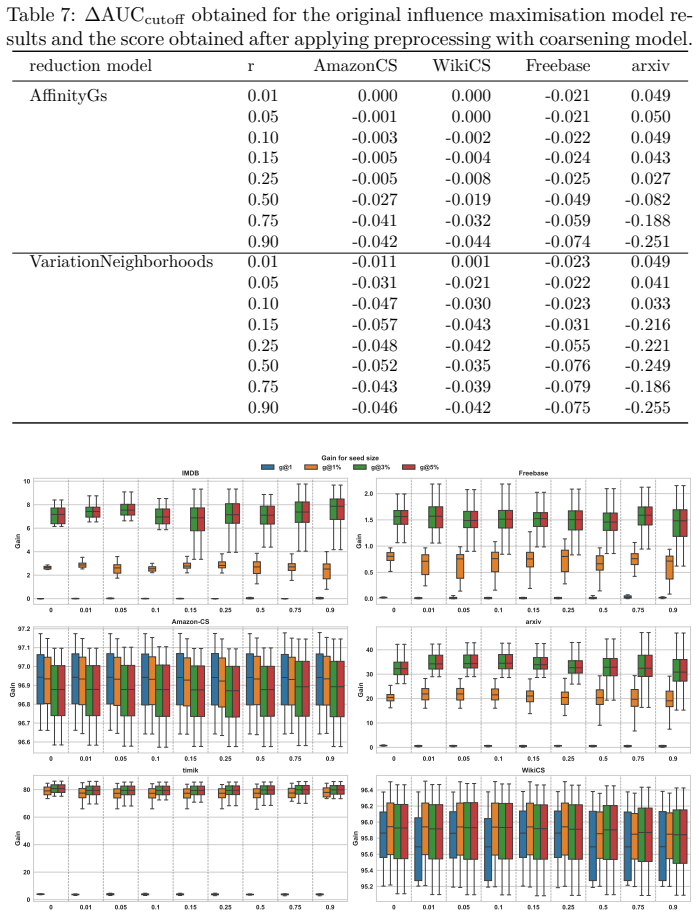
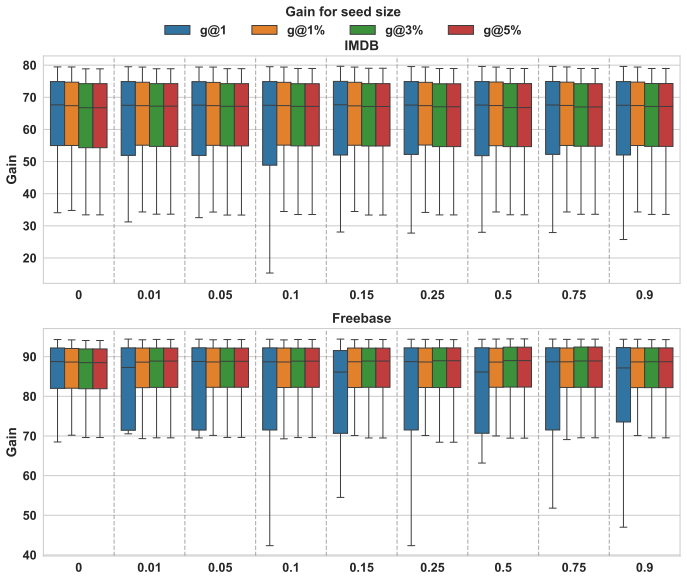
The authors establish through the SORB pipeline that the impact of graph reduction on influence maximization is strongly dependent on network type and evaluation task: sparsification preserves seed set quality on single-layer networks, whereas flattened multilayer networks exhibit systematic ranking degradation regardless of reduction strategy.
What carries the argument
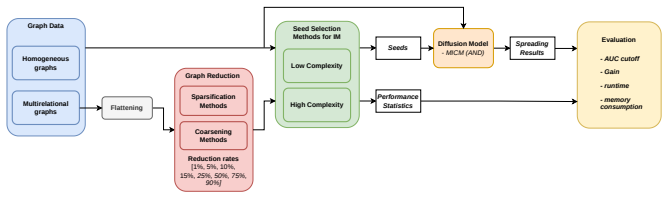
The Spreading-Oriented Reduction Benchmark (SORB) pipeline, an extensible evaluation framework that folds graph reduction steps directly into influence maximization testing on collections of single-layer and multirelational networks.
If this is right
- Influence maximization studies must incorporate reduction steps into evaluation rather than testing algorithms on full graphs alone.
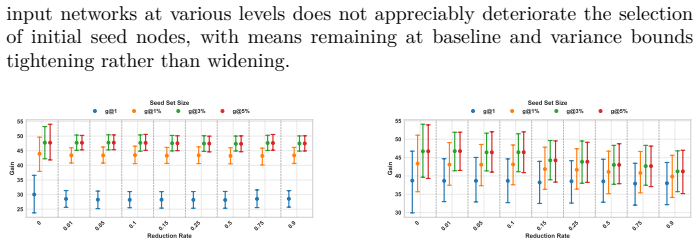
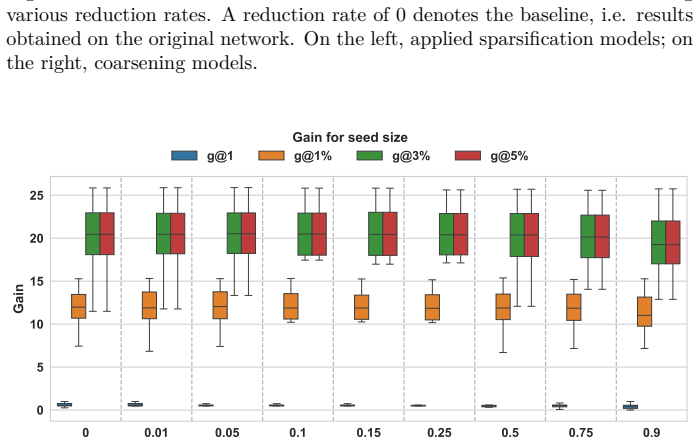
- Sparsification can be applied to single-layer networks for computational savings with limited loss in seed set quality under Gain@k.
- All tested reduction methods harm ranking performance on flattened multilayer networks across both Gain@k and AUC_cutoff.
- Task-specific metrics reveal differences that single-metric evaluations would miss when reduction is involved.
- Standardized benchmarks like SORB make the trade-off between network size and spreading prediction accuracy measurable and comparable.
Where Pith is reading between the lines
- For applications on real social networks that are often multirelational, reduction may need to be avoided or replaced by methods that preserve layer structure rather than flattening.
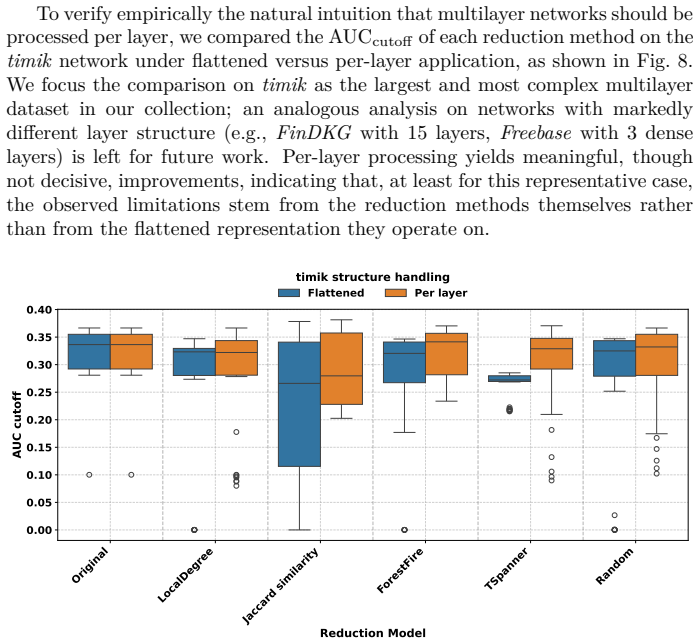
- The consistent degradation on multilayer cases may trace to the flattening step itself, pointing to a need for reduction operators that operate directly on multilayer representations.
- Extending the benchmark to dynamic or temporal networks could test whether the same type-dependent patterns hold when edges appear and disappear over time.
Load-bearing premise
The chosen collection of real-world networks is representative of the networks on which influence maximization is typically applied.
What would settle it
Running the same SORB pipeline on a new collection of multirelational networks and observing no systematic ranking degradation after reduction would falsify the claim of consistent degradation in that network type.
Figures
read the original abstract
Real-world networks are inherently incomplete, noisy, and dynamically evolving, making it difficult to capture all actors and their relationships. Their scale often renders direct analysis computationally demanding. While influence maximisation (IM) has been widely studied, the role of graph reduction as a preprocessing step, and its impact on IM accuracy, remains underexplored. In this work, we introduce the Spreading-Oriented Reduction Benchmark (SORB), an open-source, standardised framework for systematically evaluating IM models across diverse task settings. SORB provides an extensible pipeline operating on a representative collection of real-world networks, including single- and multilayer structures, and accounts for graph reduction directly into the evaluation process. This design shifts the focus from analysing IM algorithms in isolation to quantifying how graph reduction alters predictive performance. Using SORB, we study the effects of sparsification and coarsening across multiple IM scenarios. Our results show that the impact of reduction is strongly dependent on both the network type (single-layer vs. multirelational) and the downstream task ($Gain@k$ vs. $\mathrm{AUC}_{\mathrm{cutoff}}$): sparsification preserves seed set quality on single-layer networks, whereas flattened multilayer networks exhibit systematic ranking degradation regardless of reduction strategy. These findings highlight the importance of reduction-aware, multi-task evaluation when studying spreading processes in complex networks.
Editorial analysis
A structured set of objections, weighed in public.
Referee Report
Summary. The manuscript introduces the Spreading-Oriented Reduction Benchmark (SORB), an open-source extensible pipeline for evaluating how graph reduction (sparsification and coarsening) affects influence maximization accuracy. It applies SORB to a collection of real-world single-layer and multirelational networks and reports that reduction effects depend strongly on network type and downstream task: sparsification preserves seed-set quality (Gain@k) on single-layer networks, whereas flattened multilayer networks exhibit systematic ranking degradation (AUC_cutoff) independent of reduction strategy.
Significance. If the empirical patterns are robust to broader validation, SORB could provide a needed standardized, reduction-aware framework for IM studies on complex networks. The open-source pipeline and multi-task design are positive features for reproducibility and for shifting focus from isolated algorithm performance to preprocessing effects.
major comments (2)
- [Abstract] Abstract (and likely Datasets section): the assertion that SORB operates on a 'representative collection' of networks lacks explicit selection criteria, any tabulated comparison of network statistics (size, density, degree heterogeneity, community structure) against standard IM benchmarks, or an argument that the chosen graphs reflect the topologies and spreading dynamics where IM is typically applied. This is load-bearing for the central claim that observed differences can be attributed to network type rather than unmeasured covariates in the specific collection.
- [Abstract] Abstract (and Results): the reported 'strong dependence' on network type and task, including 'systematic ranking degradation,' is presented without reference to statistical tests, confidence intervals, error bars, or controls for multiple comparisons. This makes it impossible to assess whether the contrast between single-layer preservation and multilayer degradation is statistically reliable or sensitive to post-hoc choices.
minor comments (1)
- [Abstract] Abstract: the notation AUC_cutoff is introduced without definition or reference to its exact computation (e.g., how the cutoff is chosen or how AUC is calculated on the reduced graph).
Simulated Author's Rebuttal
We thank the referee for their constructive comments, which highlight important areas for improving the clarity and rigor of our claims regarding the SORB benchmark. We address each major comment below and will incorporate revisions to strengthen the manuscript.
read point-by-point responses
-
Referee: [Abstract] Abstract (and likely Datasets section): the assertion that SORB operates on a 'representative collection' of networks lacks explicit selection criteria, any tabulated comparison of network statistics (size, density, degree heterogeneity, community structure) against standard IM benchmarks, or an argument that the chosen graphs reflect the topologies and spreading dynamics where IM is typically applied. This is load-bearing for the central claim that observed differences can be attributed to network type rather than unmeasured covariates in the specific collection.
Authors: We agree that the manuscript would benefit from greater transparency on network selection. In the revised version, we will expand the Datasets section with explicit selection criteria (e.g., coverage of single-layer vs. multirelational structures, range of sizes and densities, and relevance to spreading processes), include a table comparing key statistics against common IM benchmarks (such as SNAP or KONECT networks), and add a brief justification arguing that the collection captures representative topologies for influence maximization studies. revision: yes
-
Referee: [Abstract] Abstract (and Results): the reported 'strong dependence' on network type and task, including 'systematic ranking degradation,' is presented without reference to statistical tests, confidence intervals, error bars, or controls for multiple comparisons. This makes it impossible to assess whether the contrast between single-layer preservation and multilayer degradation is statistically reliable or sensitive to post-hoc choices.
Authors: We acknowledge the absence of formal statistical support in the current presentation. The revision will add statistical tests (e.g., non-parametric paired tests for metric differences across reduction methods), report confidence intervals or standard errors, include error bars on figures, and apply multiple-comparison corrections. These additions will be placed in the Results section to substantiate the reported patterns. revision: yes
Circularity Check
No circularity; empirical benchmark with independent results
full rationale
The paper introduces the SORB empirical pipeline and reports observed performance differences (Gain@k and AUC_cutoff) across network types and reduction strategies on a collection of real-world graphs. No equations, fitted parameters, or derivations are presented that reduce the reported contrasts to quantities defined by the authors' own inputs. The representativeness assumption is external to the results and does not create a self-definitional or fitted-input reduction. No self-citation load-bearing steps, uniqueness theorems, or ansatzes appear in the abstract or described claims.
Axiom & Free-Parameter Ledger
axioms (1)
- domain assumption Real-world networks are inherently incomplete, noisy, and dynamically evolving
Reference graph
Works this paper leans on
-
[1]
Easley and J
D. Easley and J. Kleinberg,Networks, Crowds, and Markets: Reasoning About a Highly Connected World. Cambridge: CambridgeUniversityPress, 2010
2010
-
[2]
Spreading processes in multilayer networks,
M. Salehi, R. Sharma, M. Marzolla, M. Magnani, P. Siyari, and D. Mon- tesi, “Spreading processes in multilayer networks,”IEEE Transactions on Network Science and Engineering, vol. 2, no. 2, pp. 65–83, 2015
2015
-
[3]
Maximizing the spread of influ- ence through a social network,
D. Kempe, J. Kleinberg, and É. Tardos, “Maximizing the spread of influ- ence through a social network,” inProceedings of the 9th ACM SIGKDD international conference on Knowledge discovery and data mining, 2003, pp. 137–146
2003
-
[4]
Identifying super spreaders in multilayer networks,
M. Czuba, M. Stolarski, A. Piróg, P. Bielak, and P. Bródka, “Identifying super spreaders in multilayer networks,”arXiv preprint arXiv:2505.20980, 2025
arXiv 2025
-
[5]
Influence maximization frameworks, performance, challenges and directions on social network: A theoretical study,
S. S. Singh, D. Srivastva, M. Verma, and J. Singh, “Influence maximization frameworks, performance, challenges and directions on social network: A theoretical study,”Journal of King Saud University-Computer and Infor- mation Sciences, vol. 34, no. 9, pp. 7570–7603, 2022
2022
-
[6]
Large-scale graph process- ing systems: a survey,
N. Liu, D.-s. Li, Y.-m. Zhang, and X.-l. Li, “Large-scale graph process- ing systems: a survey,”Frontiers of Information Technology & Electronic Engineering, vol. 21, no. 3, pp. 384–404, 2020. 24
2020
-
[7]
Sparsity and noise: Where knowl- edge graph embeddings fall short,
J. Pujara, E. Augustine, and L. Getoor, “Sparsity and noise: Where knowl- edge graph embeddings fall short,” inProceedings of the 2017 conference on empirical methods in natural language processing, 2017, pp. 1751–1756
2017
-
[8]
Gc4nc: A benchmark frameworkforgraphcondensationonnodeclassificationwithnewinsights,
S. Gong, J. Ni, N. Sachdeva, C. Yang, and W. Jin, “Gc4nc: A benchmark frameworkforgraphcondensationonnodeclassificationwithnewinsights,” arXiv preprint arXiv:2406.16715, 2024
arXiv 2024
-
[9]
Gcondenser: Benchmarking graph con- densation,
Y. Liu, R. Qiu, and Z. Huang, “Gcondenser: Benchmarking graph con- densation,” inProceedings of the 34th ACM International Conference on Information and Knowledge Management, 2025, pp. 6466–6470
2025
-
[10]
Influence maximization in social networks: a survey of behaviour-aware methods,
A. Zareie and R. Sakellariou, “Influence maximization in social networks: a survey of behaviour-aware methods,”Social Network Analysis and Mining, vol. 13, no. 1, p. 78, 2023
2023
-
[11]
C. Shi, X. Wang, and P. S. Yu,Introduction. Singapore: Springer Singa- pore, 2022, pp. 1–8
2022
-
[12]
A multilayer network dataset of interaction and influence spreading in a virtual world,
J. Jankowski, R. Michalski, and P. Bródka, “A multilayer network dataset of interaction and influence spreading in a virtual world,”Scientific Data, vol. 4, no. 1, p. 170144, 2017
2017
-
[13]
An influence model based on heterogeneous online social network for influence maximization,
X. Deng, F. Long, B. Li, D. Cao, and Y. Pan, “An influence model based on heterogeneous online social network for influence maximization,”IEEE Transactions on Network Science and Eng., vol. 7, pp. 737–749, 2020
2020
-
[14]
Mahe-im: Multiple aggregation of heteroge- neous relation embedding for influence max. on heterogeneous information network,
Y. Li, L. Li, Y. Liu, and Q. Li, “Mahe-im: Multiple aggregation of heteroge- neous relation embedding for influence max. on heterogeneous information network,”Expert Sys. with Appl., vol. 202, p. 117289, 04 2022
2022
-
[15]
CIM: clique-based heuristic for finding influential nodes in multilayer networks,
V. Rao. K, M. Katukuri, and M. Jagarapu, “CIM: clique-based heuristic for finding influential nodes in multilayer networks,”Applied Intelligence, vol. 52, no. 5, pp. 5173–5184, Mar. 2022
2022
-
[16]
Multilayer networks,
M. Kivelä, A. Arenas, M. Barthelemy, J. P. Gleeson, Y. Moreno, and M. A. Porter, “Multilayer networks,”Journal of Complex Networks, vol. 2, no. 3, pp. 203–271, 07 2014
2014
-
[17]
A comprehensive survey on graph reduction: Sparsification, coarsening, and condensation,
M. Hashemi, S. Gong, J. Ni, W. Fan, B. A. Prakash, and W. Jin, “A comprehensive survey on graph reduction: Sparsification, coarsening, and condensation,”arXiv preprint arXiv:2402.03358, 2024
arXiv 2024
-
[18]
Z. Zhao, Y. Wang, and Z. Feng, “Nearly-linear time spectral graph reduc- tion for scalable graph partitioning and data visualization,”arXiv preprint arXiv:1812.08942, 2018
Pith/arXiv arXiv 2018
-
[19]
Privacy for free: How does dataset conden- sation help privacy?
T. Dong, B. Zhao, and L. Lyu, “Privacy for free: How does dataset conden- sation help privacy?” inInternational Conference on Machine Learning. PMLR, 2022, pp. 5378–5396. 25
2022
-
[20]
Graph data augmentation for graph machine learning: A sur- vey,
T. Zhao, W. Jin, Y. Liu, Y. Wang, G. Liu, S. Günnemann, N. Shah, and M. Jiang, “Graph data augmentation for graph machine learning: A sur- vey,”arXiv preprint arXiv:2202.08871, 2022
arXiv 2022
-
[21]
Scaling R-GCN training with graph summarization,
A. Generale, T. Blume, and M. Cochez, “Scaling R-GCN training with graph summarization,” inCompanion Proceedings of the Web Conference 2022, 2022
2022
-
[22]
Rank-refining seed selection methods for bud- get constrained influence maximisation in multilayer networks under linear threshold model,
M. Czuba and P. Bródka, “Rank-refining seed selection methods for bud- get constrained influence maximisation in multilayer networks under linear threshold model,”Social Network Analysis and Mining, vol. 15, no. 1, p. 46, 2025
2025
-
[23]
Efficient influence maximization in social networks,
W. Chen, Y. Wang, and S. Yang, “Efficient influence maximization in social networks,” inProceedings of the 15th ACM SIGKDD internat. conf. on Knowledge discovery and data mining, 2009, pp. 199–208
2009
-
[24]
Influence maximiza- tion in social networks using graph embedding and graph neural network,
S. Kumar, A. Mallik, A. Khetarpal, and B. Panda, “Influence maximiza- tion in social networks using graph embedding and graph neural network,” Information Sciences, vol. 607, pp. 1617–1636, 2022
2022
-
[25]
Deep graph representation learning and optimization for influ- ence maximization,
C. Ling, J. Jiang, J. Wang, M. T. Thai, L. Xue, J. Song, M. Qiu, and L. Zhao, “Deep graph representation learning and optimization for influ- ence maximization,” inProceedings of the 40th International Conference on Machine Learning, ser. ICML’23. JMLR.org, 2023
2023
-
[26]
Gc-bench: An open and unified benchmark for graph condensation,
Q. Sun, Z. Chen, B. Yang, C. Ji, X. Fu, S. Zhou, H. Peng, J. Li, and P. S. Yu, “Gc-bench: An open and unified benchmark for graph condensation,” Advances in neural information processing systems, vol. 37, pp. 37900– 37927, 2024
2024
-
[27]
Debunking the myths of influence maximization: An in-depth benchmarking study,
A. Arora, S. Galhotra, and S. Ranu, “Debunking the myths of influence maximization: An in-depth benchmarking study,” inProceedings of the 2017 ACM international conference on management of data, 2017, pp. 651– 666
2017
-
[28]
Influence maximization revisited: The state of the art and the gaps that remain
——, “Influence maximization revisited: The state of the art and the gaps that remain.” inEDBT, 2019, pp. 440–443
2019
-
[29]
Wiki-cs: A wikipedia-based benchmark for graph neural networks,
P. Mernyei and C. Cangea, “Wiki-cs: A wikipedia-based benchmark for graph neural networks,”arXiv preprint arXiv:2007.02901, 2020
arXiv 2007
-
[30]
Pitfalls of graph neural network evaluation,
O. Shchur, M. Mumme, A. Bojchevski, and S. Günnemann, “Pitfalls of graph neural network evaluation,”arXiv preprint arXiv:1811.05868, 2018
Pith/arXiv arXiv 2018
-
[31]
Self-supervised heterogeneous graph neural network with co-contrastive learning,
X. Wang, N. Liu, H. Han, and C. Shi, “Self-supervised heterogeneous graph neural network with co-contrastive learning,” inProceedings of the 27th ACM SIGKDD conference on knowledge discovery & data mining, 2021, pp. 1726–1736. 26
2021
-
[32]
Explaining reviews and ratings with paco: Poisson additive co-clustering,
C.-Y. Wu, A. Beutel, A. Ahmed, and A. J. Smola, “Explaining reviews and ratings with paco: Poisson additive co-clustering,” inProceedings of the 25th International Conference Companion on World Wide Web, 2016, pp. 127–128
2016
-
[33]
Findkg: dynamic knowledge graph with large language models for global finance. 2023,
X. Li, “Findkg: dynamic knowledge graph with large language models for global finance. 2023,”Available at SSRN, 2023
2023
-
[34]
Identifying modular flows on multilayer networks reveals highly overlapping organiza- tion in interconnected systems,
M. De Domenico, A. Lancichinetti, A. Arenas, and M. Rosvall, “Identifying modular flows on multilayer networks reveals highly overlapping organiza- tion in interconnected systems,”Phys. Rev. X, vol. 5, p. 011027, 3 2015
2015
-
[35]
GC4NC: A benchmark frameworkforgraphcondensationonnodeclassificationwithnewinsights,
S. Gong, J. Ni, N. Sachdeva, C. Yang, and W. Jin, “GC4NC: A benchmark frameworkforgraphcondensationonnodeclassificationwithnewinsights,” inThe Thirty-ninth Annual Conference on Neural Information Processing Systems Datasets and Benchmarks Track, 2025
2025
-
[36]
Algorithms for large-scale network analysis and the networkit toolkit,
E.Angriman, A.vanderGrinten, M.Hamann, H.Meyerhenke, andM.Pen- schuck, “Algorithms for large-scale network analysis and the networkit toolkit,” inAlgorithms for big data: DFG priority program 1736. Springer, 2023, pp. 3–20
2023
-
[37]
Local graph sparsification for scalable clustering,
V. Satuluri, S. Parthasarathy, and Y. Ruan, “Local graph sparsification for scalable clustering,” inProceedings of the 2011 ACM SIGMOD Interna- tional Conference on Management of data, 2011, pp. 721–732
2011
-
[38]
Additive graph spanners,
A. L. Liestman and T. C. Shermer, “Additive graph spanners,”Networks, vol. 23, no. 4, pp. 343–363, 1993
1993
-
[39]
Graph evolution: Densifica- tion and shrinking diameters,
J. Leskovec, J. Kleinberg, and C. Faloutsos, “Graph evolution: Densifica- tion and shrinking diameters,”ACM transactions on Knowledge Discovery from Data (TKDD), vol. 1, no. 1, pp. 2–es, 2007
2007
-
[40]
Graph reduction with spectral and cut guarantees,
A. Loukas, “Graph reduction with spectral and cut guarantees,”Journal of Machine Learning Research, vol. 20, no. 116, pp. 1–42, 2019
2019
-
[41]
Scaling up graph neural networks via graph coarsening,
Z. Huang, S. Zhang, C. Xi, T. Liu, and M. Zhou, “Scaling up graph neural networks via graph coarsening,” inProceedings of the 27th ACM SIGKDD conference on knowledge discovery & data mining, 2021, pp. 675–684
2021
-
[42]
The ml-model for multi-layer social networks,
M. Magnani and L. Rossi, “The ml-model for multi-layer social networks,” in2011 International conference on advances in social networks analysis and mining. IEEE, 2011, pp. 5–12
2011
-
[43]
Sequential seeding in multi- layer networks,
P. Bródka, J. Jankowski, and R. Michalski, “Sequential seeding in multi- layer networks,”Chaos: An Interdisciplinary Journal of Nonlinear Science, vol. 31, no. 3, 2021
2021
-
[44]
Identification of influential spreaders in complex networks,
M. Kitsak, L. K. Gallos, S. Havlin, F. Liljeros, L. Muchnik, H. E. Stan- ley, and H. A. Makse, “Identification of influential spreaders in complex networks,”Nature physics, vol. 6, no. 11, pp. 888–893, 2010. 27
2010
-
[45]
Network diffusion framework to simulate spreading processes in complex networks,
M. Czuba, M. Nurek, D. Serwata, Y.-X. Qi, M. Jia, K. Musial, R. Michalski, and P. Bródka, “Network diffusion framework to simulate spreading processes in complex networks,”Big Data Mining And Analytics, vol. 7, no. 3, pp. 637–654, 2024. [Online]. Available: https://doi.org/10.26599/BDMA.2024.9020010 28
discussion (0)
Sign in with ORCID, Apple, or X to comment. Anyone can read and Pith papers without signing in.